
Abstract
BACKGROUND: Oxygen has been widely used for COPD patients because long-term oxygen therapy can improve survival duration of COPD patients with severe hypoxemia. The typical oxygen delivery methods used for long-term oxygen therapy are continuous flow oxygen (CFO) and demand oxygen delivery (DOD). Currently, DOD is preferred to CFO in oxygen conserving devices because waste of oxygen is substantial in CFO. However, DOD causes discomfort to patients since it abruptly supplies high-flow oxygen during inhalation only.
METHODS: To overcome the drawbacks of CFO and DOD, we developed a novel oxygen delivery method, synchronized DOD (SDOD), which can reduce waste oxygen and patient discomfort. We used the concept of “jerk” from physics, which indicates the rate of change of acceleration, and defined a discomfort index (DI) to quantitatively represent the degree of discomfort. To determine the correlation between DI and the actual human feeling of discomfort, we tested subjects' responses to different levels of DI. Moreover, depending on the level of oxygen saving of each method, CFO, DOD, and SDOD regions were identified in a prescription flow/supply flow plane. A bench study was conducted to experimentally compare the Fio2 between CFO and SDOD at 20 breaths/min.
RESULTS: The results of this study illustrate that there is a region of compromise between oxygen saving and patient comfort that is filled by SDOD. DI is positively correlated with actual human discomfort (P < .001). In addition, the DI of SDOD was much lower than that of DOD. Fio2 of SDOD was 2–5% less than that of CFO.
CONCLUSIONS: In conclusion, SDOD might provide more comfortable oxygen delivery by reducing DI, and conserves oxygen while offering an equivalent Fio2.
- oxygen conserving device
- saving ratio
- synchronized demand oxygen delivery
- discomfort index
- COPD
- Fio2
Introduction
Recently, the number of patients with respiratory disease has been increasing due to various reasons, including air pollution and smoking.1 Oxygen has been widely used for COPD patients because long-term oxygen therapy (LTOT) can improve survival of COPD patients with severe hypoxemia.2 To evaluate the performance of LTOT systems, the Fio2 of the oxygen supplied to the lungs has been measured.3,4
Two typical methods are used for delivering oxygen: continuous flow oxygen (CFO) and demand oxygen delivery (DOD); both have inherent drawbacks. CFO often restricts patients' activity due to the large size of the oxygen tank that is required to continuously supply oxygen, and wastes oxygen considerably.5 Although oxygen conserving devices have adopted DOD, which supplies oxygen during inhalation only, to reduce waste oxygen, it makes breathing uncomfortable because a preset volume of oxygen (bolus) is abruptly supplied to the patient when inhalation begins. Moreover, when rapid changes in pressure or breathing patterns occur, oxygen may not be supplied, due to the low sensitivity of the pressure sensor used in DOD devices.6–9
The saving ratio (SR) is defined as the ratio between the prescription flow and the supply flow. CFO does not incur any oxygen saving, since it supplies oxygen continuously to patients at the flow prescribed by clinicians (SR = 1). On the other hand, current oxygen conserving devices have a value for SR as high as 3.46 because DOD mainly focuses on conserving oxygen. Thus, a wide gap in SR exists between CFO and DOD. A new method for filling this gap would be interesting. In current oxygen conserving devices, oxygen discharge is triggered by the pressure change at initiation of the inhalation period. In general, oxygen conserving devices deliver a bolus dependent on the manufacturer's setting values. The bolus size of each setting varies among manufacturers, which has created controversy in the industry. When oxygen is discharged, the slope of the oxygen flow curve rapidly increases within 0.1 seconds. Moreover, the flow of an oxygen conserving device is 2 or 3 times greater than that of CFO (0.5–5 L/min).10 Thus, it is worthwhile to define a discomfort index (DI) to quantify the level of discomfort of oxygen devices, in order to reduce patient discomfort caused by the abrupt delivery of a bolus of oxygen. Moreover, it is necessary to determine the relationship between actual human discomfort and different levels of DI.
This study introduces a synchronized DOD (SDOD) method, which supplies the required amount of oxygen by synchronization with the breathing patterns of patients. This method is designed to reduce patient discomfort and conserve oxygen. According to the SR and the breathing patterns of patients, a time-dependent oxygen profile is determined. By using this profile, SDOD is able to deliver oxygen smoothly. Thus, SDOD can be used when the available amount of oxygen is more than the amount required by DOD and less than that required by CFO, because it conserves oxygen and delivers oxygen to patients before inhalation. In other words, the SDOD method can be used in the range of SR between CFO and DOD.
The purposes of this study were to define a DI for oxygen delivery devices and determine its relationship to the human feeling of discomfort, to reduce the level of discomfort of DOD devices by developing SDOD, to define the region where oxygen is delivered efficiently by SDOD using the prescription flow and the supply flow, and to compare the Fio2 between SDOD and CFO.
QUICK LOOK
Current knowledge
Long-term oxygen therapy improves survival duration in patients with COPD. In home oxygen therapy, pulse oxygen delivery conserves oxygen and has economic advantages over continuous flow oxygen. Patient comfort is equivalent with continuous flow versus pulse oxygen therapy.
What this paper contributes to our knowledge
A new method of oxygen delivery, synchronized demand oxygen delivery (SDOD), reduced patient discomfort, compared to pulse oxygen delivery. Fio2 was 2–5% lower with SDOD than with continuous flow oxygen. SDOD may improve comfort while conserving oxygen.
Methods
Definition of Discomfort Index
In this study, the concept of “jerk” was used to quantitatively measure the degree of patient discomfort during oxygen delivery. In physics, jerk is defined as the third derivative of the position in the equation:
Region Classification in the Prescription Flow/Supply Flow Plane
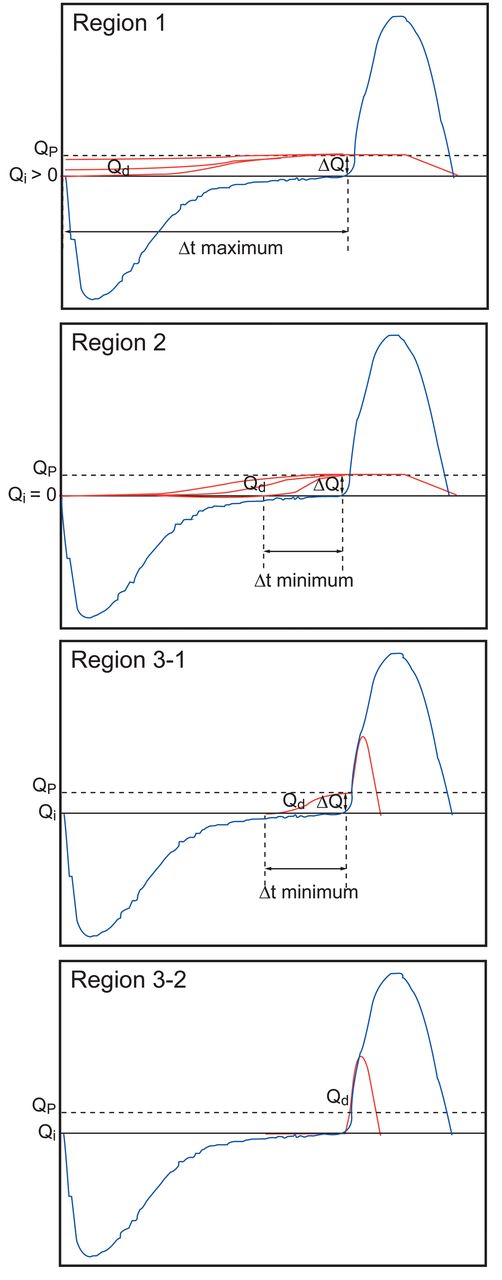
In order to describe the flows of SDOD, several parameters, represented in Figure 1, were defined. By using these parameters, 4 different algorithms of the time-dependent oxygen supply profiles were identified. In addition, these algorithms divided regions in the prescription flow/supply flow plane according to SR, as follows (Fig. 2). Region 1 is characterized by the base flow (Qi) rising to the prescription flow (Qp) during exhalation, Qi being bigger than zero, and the discharged flow (Qd) being increased from a non-zero value of Qi to Qp through an S-shaped curve during exhalation. Region 2 is characterized by the Qd starting at 0 L/min, and increasing from 0 to the Qp through an S-shaped curve during the time from the start of Qi to the point when Qd reaches Qp (Δt). Region 3–1 is characterized by pulse oxygen delivery being used at the beginning of inhalation, after supply of oxygen through an S-shaped curve during Δt. Region 3–2 is characterized by only pulse oxygen delivery being used at the beginning of inhalation. Oxygen discharging begins before inhalation in 3 regions (Region 1, Region 2, and Region 3–1). Thus, the shape of the oxygen supply profile varies with the region. SR is low in Region 1, increases in Region 2, and further increases in Region 3.

Parameters used for dividing regions by saving ratio. The prescribed flow (Qp) is the oxygen flow prescribed by the clinician to maintain minimum Fio2. The supply flow (Qs) is the oxygen flow of the continuous flow oxygen device. The discharged flow (Qd) is the oxygen flow delivered. The base flow (Qi) is the lowest flow. ti = starting point of base flow. tf = time when Qd reaches Qp. Δt = elapsed time from ti to tf(tf − ti).

Shapes of 4 different discharged flow curves for region classification. Region 1 is the synchronized demand oxygen delivery (SDOD) region. The discharged curve starts from (see Fig. 1 for definitions of Q and t terms) Qi > 0, and Qd rises to Qp during exhalation. Region 2: SDOD region. Discharged curve starts from Qi = 0, and Qd rises to Qp before inhalation during Δt. Region 3–1: SDOD region. Pulse oxygen delivery is used at the beginning of inhalation after Qd rises from Qi(Qi = 0) during Δt. Region 3–2: SDOD region. Only pulse oxygen delivery is used at the beginning of inhalation.
Method for Reducing Discomfort Index
Before reducing DI, the response time and rising times of the proportional valve (VSO miniature proportional valve, VSONIC-3S11-Q8, Parker Hannifin, Cleveland, Ohio) under various flows were obtained; the results are summarized in Table 1. The response time was the time delay to valve opening after input current was supplied. The rising time was the time required to reach the prescription flow from valve opening. Thus, the valve should be open before the rising time to supply the prescription flow. After determining the response time and the rising time, oxygen was supplied through an S-shaped oxygen discharging curve before inhalation, by using a proportional valve that controlled the oxygen flow.
Measured Response Time and Rising Time of the Proportional Valve
In order to reduce the DI, an S-shaped curve (a logistic function) was utilized for oxygen supply13:
Using equation 3, the oxygen discharge curve (Qd) was determined when the time and flow change from (ti, Qi) to (tf, Qp):
The maximum absolute value of DI should be calculated while satisfying several constraints. These constraints were determined based upon normal breathing. In normal breathing, exhalation typically takes twice as long as inhalation. For example, if 1 breath is 3 seconds (ie, 20 breaths/min), the inhalation time is likely to be 1 second, and the exhalation time is likely to be 2 seconds. The time constraint was that Δt was bigger than or equal to the rising time (tri) between the valve open time and the time to reach the prescription flow, and less than or equal to the exhalation time. The flow constraint was that the discharged volume during each cycle was less than or equal to the suppliable volume of the device. In addition, the difference between Qp and Qs should not exceed ΔQ(Qp − Qi) because the supply flow (Qs) was more than or equal to base flow (Qi). ΔQ was less than or equal to Qp because Qi is bigger than or equal to 0.
Experimental Method for Drawing Correlation Between Discomfort Index and Actual Discomfort
To determine the correlation between DI and actual discomfort, experiments were designed to observe a subject's response to different levels of DI. Eight healthy volunteers (6 males and 2 females, mean age 37.9 y) without history of respiratory disease were tested. This experimental protocol was approved by the ethics committee of Sogang University, and informed consent was obtained from all subjects.
The experiment consisted of several steps. First, 5 different time-dependent oxygen-supplying profiles were established. These profiles had a corresponding value of logarithmic DI from 1 to 5 (log DI = 1, 2, 3, 4, and 5). Second, each subject was given the instruction that his/her feeling about the oxygen profile corresponding to the lowest value of DI (101) should match a very comfortable feeling, and that his/her feeling about the oxygen profile corresponding to the highest value of DI (105) should match a very uncomfortable feeling. Third, the subjects received air 15 times by randomly selected oxygen-supplying profiles (ie, each of the 5 different profiles was randomly repeated 3 times.) The subjects responded to each oxygen-supplying profile by ranking the degree of his/her actual feeling of discomfort from 1 (very comfortable) to 5 (very uncomfortable). Finally, the Spearman rank correlation test was used for correlation analysis between the subjects' responses and DI.
Experimental Method to Measure Fio2
In LTOT, high-concentration oxygen is supplied to a patient's respiratory system. The success of this therapy is based on the Fio2 that is delivered to the lungs. A higher Fio2 provides better recovery to patients under LTOT. Due to this, the Fio2 of supplied oxygen is an important factor in LTOT. Thus, the Fio2 of SDOD was measured and compared with that of CFO.
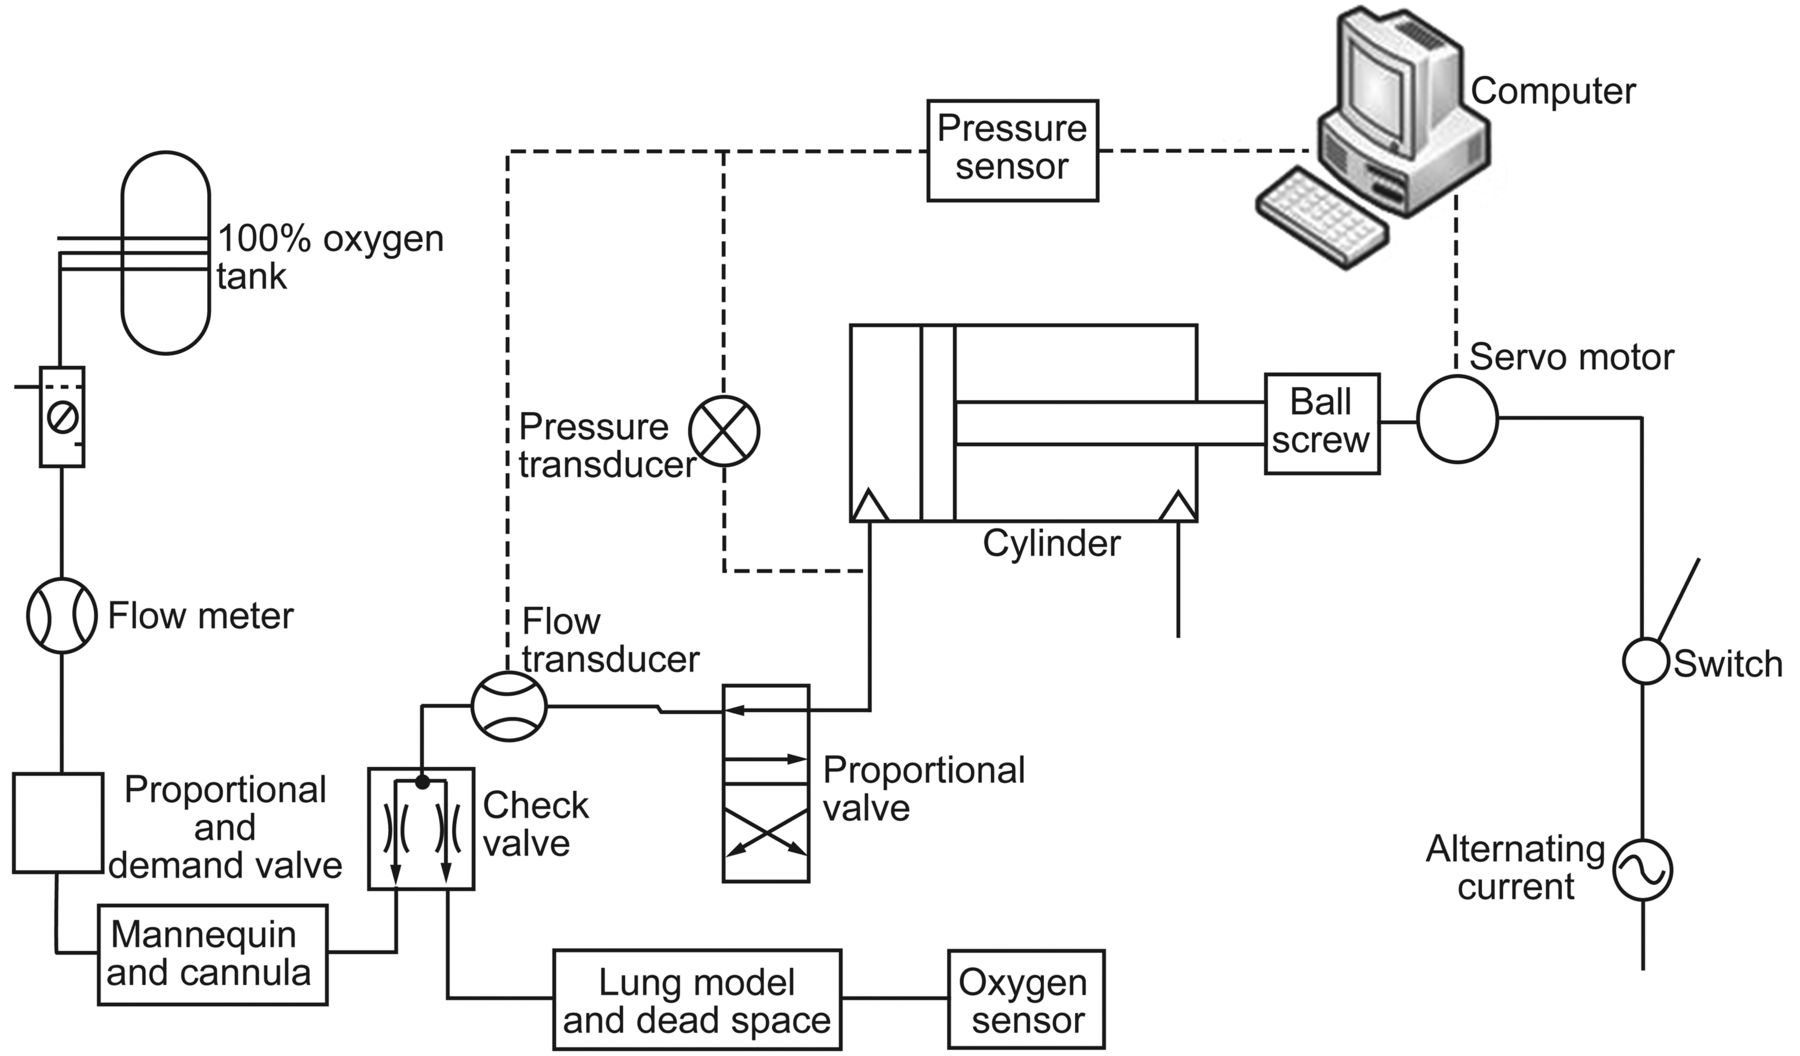
A mechanical respiratory simulator (Fig. 3) was designed to experimentally measure Fio2.14 Human breathing patterns were simulated by piston motion with a cylinder (DNG160-400PPV-A, Festo, Denkendorf, Germany), a servo motor (HC-RFS-130(B), Mitsubishi, Tokyo, Japan), real time control of a proportional valve (MYPE-53/8010B, Festo, Denkendorf, Germany), and a valve that served as the airway.15 In order to measure the pressure and flow, a pressure sensor (TSD160C, Biopac Systems, Goleta, California, operation pressure ± 25 cm H2O, combined linearity and hysteresis error 0.05%) located at the end of the cylinder, and a flow meter (TSD107B, Biopac Systems, Goleta, California, calibrated flow range ± 800 L/min) located at the end of the valve were connected to the mechanical respiratory simulator.14 A lumen cannula was installed at the mannequin head to supply the air-oxygen mixture. A dead space part was equipped at the mannequin head to take into consideration the anatomic dead space. Moreover, the air-oxygen mixture flowed from the lumen cannula to the dead space through a tube like in an airway.16

Experimental equipment to simulate the human respiratory system to measure the Fio2 at the lungs. (From Reference 15, with permission.)
The respiratory simulation system consisted of the respiratory simulator and the SDOD system (Fig. 4). A mixture of pure oxygen and air was supplied to the respiratory simulator through the cannula and a check valve. The supplied mixture was discharged to the atmosphere during exhalation through the check valve, and an oxygen analyzer (Ntron 510002, Neutronics, Exton, Pennsylvania, measurement range 0–100% auto range, intrinsic error ± 2% range at constant temperature) measured Fio2.15,17

Schematic of the respiratory simulator system used to measure Fio2. Pure oxygen from a tank passed into a proportional valve, mannequin, and cannula sequentially. Pure oxygen and 21% oxygen in the air were then mixed. The respiratory simulator mimicked human breathing patterns. The oxygen concentration was measured in the lung and dead space models. (From Reference 15, with permission.)
When using CFO, oxygen was supplied with a prescription flow (1–5 L/min) at 1 bar. The oxygen concentration in the lung model was then measured. When using SDOD and DOD methods, oxygen was also supplied with a prescription flow (1–5 L/min). Moreover, the oxygen concentration in the lung model was measured under various ΔQ and Δt in Regions 1–3.
Each experiment consisted of 3 steps. First, the pressure and flow under 20 breaths/min normal breathing were converted to the motor and valve signals that operate the respiratory simulator.15 Second, oxygen was supplied to the lung model by CFO or SDOD. Third, the Fio2 value in the lung model was measured if it lasted for several minutes (2–5 min). The same experiment was repeated 3 times.
Results
The prescription flow (Qp)/supply flow (Qs) plane was divided into several regions by SR (Fig. 5). Qs was obtained by using a mathematical method that reduced the DI under various Qp, and the corresponding SR are summarized in Table 2. The development of SDOD provided an efficient method that covered the range gap (Region 1, Region 2, Region 3–1, and Region 3–2) between CFO and DOD in the prescription flow/supply flow plane. SR at the boundary varied little, depending on the prescription flows. SR values were about 1.8 for the boundary between Region 1 and Region 2, about 2.8 for the boundary between Region 2 and Region 3, and about 3.8 for the boundary between Region 3 and the insufficient Fio2 region.

Boundary graph for prescription flow (Qp) and supply flow (Qs). The continuous flow oxygen region has a saving ratio (SR) lower than 1. Region 1 has an SR between 1 and 1.8. Region 2 has an SR between 1.8 and 2.7. Region 3–1 has an SR between 2.7 and 3.13. Region 3–2 has an SR between 3.13 and 3.8. The insufficient Fio2 region has an SR greater than 3.8. The synchronized demand oxygen delivery (SDOD) method provided algorithms for the range gap (from Region 1 to Region 3–2).
Region Classification Versus Saving Ratios at 20 Breaths Per Minute
The responses of the subjects to different levels of jerk are shown in Figure 6. The logarithmic DI was positively correlated with the actual feeling of discomfort of the subjects (r = 0.79, P < .001). In other words, the actual feeling of discomfort is strongly proportional to the logarithmic DI.
Box plot of the subjects' responses to different levels of discomfort index (responses: 1 = very comfortable, 2 = comfortable, 3 = slightly uncomfortable, 4 = uncomfortable, and 5 = very uncomfortable). There was a significant positive correlation by Spearman rank correlation analysis in healthy subjects (r = 0.79, P < .001).
The DI was substantially reduced when using SDOD. The maximum DI (fmax) of SDOD was decreased by approximately 85%, when compared with DOD. The maximum DIs of SDOD and DOD obtained mathematically under 20 breaths/min and various Qp values are summarized in Figure 7. DI ranged from 0 to 13,800 L/min/s2. The DI of the SDOD, which adopted a logistic function (Region 2 in Fig. 2) showed a very low value of 190 L/min/s2. The DI of the hybrid method combining SDOD and DOD (Region 3–1 in Fig. 2) was approximately 2,200 L/min/s2. However, DOD illustrated a peak value of DI around 13,800 L/min/s2, which was commensurate with high SR.
Computed discomfort index (jerk) in each region of prescription flow (QP = 1–5 L/min) at 20 breaths/min. When Qp was 1 L/min the jerk range was 2–61 L/min/s2 in Regions 1 and 2. When Qp was 2 L/min the jerk range was 5–83 L/min/s2 in Regions 1 and 2. When Qp was 3 L/min the jerk range was 7–100 L/min/s2 in Regions 1 and 2. When Qp was 4 L/min the jerk range was 12–150 L/min/s2 in Regions 1 and 2. When Qp was 5 L/min the jerk range was 15–190 L/min/s2 in Regions 1 and 2. The discomfort index in regions 3–1 and 3–2 was about 2,200 L/min/s2 and 13,800 L/min/s2, respectively, regardless of Qp.
The Fio2 of SDOD in Region 1 and Region 2 were similar to that of CFO, whereas the difference between the Fio2 of SDOD and CFO was increased in Region 3 (Fig. 8). In Region 1 and Region 2 the Fio2 difference between CFO and SDOD was < 2%. However, the Fio2 in Region 3, which adopted SDOD and DOD, was reduced by 4–5%, when compared to the Fio2 of CFO. In addition, the experimental results for the Fio2 of CFO in all regions were similar to the Fio2 found in previous studies of CFO.18,19
Fio2 of synchronized demand oxygen delivery (SDOD) and continuous flow oxygen (CFO) in each region (error bars represent standard deviation) and reference values for the Fio2 of CFO.18,19 The Fio2 of CFO from the current experiments and previous references agree. The difference in Fio2 between SDOD and CFO is < 2% in Regions 1 and 2. In Region 3, which used a hybrid method combining SDOD and demand oxygen delivery, the difference in Fio2 is up to 5% when compared to CFO.
Discussion
In this study we proposed the use of a DI to quantitatively represent the degree of patient discomfort when using oxygen conserving devices. In order to define DI, the concept of jerk was introduced. The second derivative of the discharged oxygen flow or the third derivative of the discharged oxygen volume (volumetric jerk) was used for DI. DI could be utilized to objectively measure the degree of patient discomfort for any oxygen delivery device in the future. In addition, we found a positive correlation between DI and the actual human feeling of discomfort. In other words, the higher DI an oxygen delivery device produces, the more uncomfortable the user feels. However, when oxygen-supplying profiles have low values for DI, subjects may not be able to distinguish slight differences in DI values between 101 and 102. On the other hand, when the DI of the oxygen-supplying profile is higher than 104, almost all subjects can recognize that the profile is uncomfortable.
We developed a new type of oxygen delivery method: SDOD. To date, the methods available for oxygen delivery have been either CFO or DOD. However, SDOD could be used for a new range of SR that has not been covered previously by CFO or DOD (ie, SDOD can fill the range gap between CFO and DOD). The results of this study show that the new region covered by SDOD can be identified in the prescription flow/supply flow plane. The CFO region in the prescription flow/supply flow plane has an SR ratio between 0 and 1, because oxygen saving does not occur in CFO. The SDOD region includes both the DOD region and the previous range gap between CFO and DOD. When SDOD had a lower DI than the DOD method in a certain region, this region was regarded as the SDOD region. Therefore, SDOD covered the region that has an SR between 1 and 3.8, as shown in Figure 5.
SDOD has 2 advantages over both CFO and DOD, as follows. First, SDOD might be more comfortable for patients than DOD, because SDOD raises oxygen supply through an S-shaped curve before the beginning of inhalation, whereas DOD supplies oxygen during a very short time interval. In addition, the results of this study have shown that SDOD substantially reduces DI, when compared with DOD. It should be noted that the DI of SDOD was far smaller than that of DOD. The maximum DI (fmax) of SDOD was decreased by approximately 85%, when compared with that of DOD under conditions of 20 breaths/min. DI decreased as the prescription flow (Qp) decreased or the supply flow (Qs) increased. Second, when compared to CFO, SDOD saved a large portion of waste oxygen and increased oxygen saving by limiting oxygen discharging during exhalation.
SDOD produced equivalent Fio2 values when compared to CFO in Region 1 and Region 2, whereas the Fio2 difference between SDOD and CFO was magnified in Region 3. These findings were obtained via measurement of the Fio2 of CFO and SDOD under various prescription flows (1–5 L/min) in each region. In Regions 1 and 2 the difference in Fio2 between CFO and SDOD was < 2%. The Fio2 of SDOD in Region 3, which used the hybrid method including DOD, was about 5% less than that of CFO. The increased difference in Fio2 between the 2 methods in Region 3 may be attributed to the fact that the oxygen bolus size of SDOD using pulse patterns was smaller than that of DOD. In addition, the smaller oxygen bolus size of SDOD in Region 3 might result from the oxygen supplied before the beginning of inhalation.
One limitation of the current study is that the efficiency of SDOD and DI could be influenced by the specification of the proportional valve used. In this study, one type of proportional valve was tested during the experiments. Depending on the response and rising times of the valve, SRs corresponding to the SDOD region may vary significantly. Although values of SR used for dividing regions were barely altered, SDOD would still be effective in reducing the DI, as shown in this study. Another limitation of this study stems from the fact that calculations and experiments were conducted for normal breathing at a rate of 20 breaths/min only. In order to verify the effectiveness of SDOD, an extension of this study should be conducted under various breaths/min and breathing patterns. Lastly, the correlation between DI and actual discomfort was drawn from the subjects who had no respiratory disease. Since the response of the COPD patients to the same DI may be different from that of the healthy subjects, the comparison of the response of the healthy subjects to DI with the response of the COPD patients remains to be studied.
Conclusions
DI based on jerk was defined to quantify patient discomfort when using oxygen conserving devices. A significant positive correlation between DI and the actual feeling of discomfort was established. Based on this correlation, a new oxygen delivery method, SDOD, was developed not only to reduce the DI but also to conserve oxygen. SDOD supplies oxygen to patients via an S-shaped curve before inhalation and substantially reduced DI, in comparison to DOD. In addition, the region where SDOD effectively supplied oxygen was identified in the prescription flow/supply flow plane. The SDOD method proposed in this study was shown to produce equivalent Fio2, compared to that of CFO, through a bench test using a mechanical breathing simulator. Therefore, further patient studies are warranted in order to further investigate these results.
Footnotes
- Correspondence: Choongsoo S Shin PhD, Department of Mechanical Engineering, Sogang University, 1 Shinsu-Dong Mapo-Gu, Seoul 121-742 Republic of Korea. E-mail: cshin{at}sogang.ac.kr.
This study was supported by grant A091265-1002-0000100 from the Korea Healthcare Technology Research and Development Project, Ministry for Health, Welfare, and Family Affairs, Republic of Korea, and research grant 200910041.01 from Sogang University. The authors have disclosed no conflicts of interest.
- Copyright © 2013 by Daedalus Enterprises
References
- 1.
- 2.
- 3.
- 4.
- 5.
- 6.
- 7.
- 8.
- 9.
- 10.
- 11.
- 12.
- 13.
- 14.
- 15.
- 16.
- 17.
- 18.
- 19.