


Severe public health emergencies may lead to mass respiratory failure,Reference Rubinson, Branson, Pesik and Talmor1Reference Christian, Devereaux, Dichter, Geiling and Rubinson2Reference Branson and Rubinson3 and survival of patients with severe acute respiratory failure (ARF) depends on timely access to life-sustaining care, including mechanical ventilation. The profound need for respiratory support during these events highlights the importance of ensuring an adequate supply and distribution of medical equipment for mechanical ventilation. Planning for mass respiratory public health emergencies has been hampered by not knowing how many ventilators there are in US hospitals, how they are distributed across the country, and whether, taken together, the numbers and types of ventilators in hospitals will provide sufficient surge capacity to meet anticipated needs.
There was significant consternation during the 2009 influenza pandemic about whether there would be sufficient ventilators in the United States to handle various projections of surges in ARF,4Reference White and Angus5 but existing knowledge of device number and distribution severely limited analyses. Estimates of the number of full-feature ventilators, which are the first-line ventilators used in US hospitals for the vast majority of ARF, range from 54 000 to 105 000, but the full number has never been enumerated.Reference Niska and Burt6Reference Osterholm7 Uncertainty regarding US hospital ventilator capacity is further compounded when considering high-risk subpopulations such as children. One-quarter of the US population is children; not all full-feature ventilators can be used for small children or neonates. The number of full-feature ventilators in the United States that are capable of ventilating small children remains unknown. These uncertainties came to the forefront as the 2009 influenza pandemic unfolded, and there was a compelling need to enhance the accuracy and precision of the estimate of full-feature ventilators in US hospitals for adults and children, because these quantities reflect national ventilation capacity for ARF using usual, standard devices.
Public health emergencies may exceed full-feature ventilator capacity. For these scenarios, surge capacity strategies to repurpose additional positive pressure ventilation (PPV) equipment (eg, portable ventilators), which are owned by hospitals or maintained in public health stockpiles, have been proposed.Reference Rubinson, Branson, Pesik and Talmor1Reference Branson, Johannigman, Daugherty and Rubinson8Reference Rubinson, Hick and Curtis9 Fortunately, hospitals use a number of different ventilators in addition to full-feature devices for daily delivery of care. These additional PPV devices normally have a limited scope of use as compared with full-feature ventilators. They are used for specific subpopulations of patients (obstructive sleep apnea and continuous positive airway pressure [CPAP]–only device users) or limited durations (transport ventilators). It is unfortunate that the number of these additional devices is just as uncertain as full-feature ventilators. Determination of the total number of additional PPV devices, however, is not sufficient for quantifying ventilator surge capacity. Not all PPV categories and devices are equivalent. Some devices are capable of providing ventilatory support across a wide range of respiratory derangements and severity, whereas others are incapable of supporting even mild respiratory failure. Hence, ascertaining the quantity of devices by functional ventilator category is necessary to determine US ventilator surge capacity.
The severity and duration of 2009 pandemic influenza A (H1N1)–associated respiratory failure highlighted the need for a more comprehensive understanding of the capability to provide respiratory support during emergencies in the United States. Because the supply and geographic distribution of different categories of mechanical ventilation capacity are of profound importance for planning and predicting responses to severe public health emergencies throughout the United States, we performed a survey to inventory PPV equipment at all of the US acute care and specialty hospitals.
METHODS
Survey
In collaboration with the American Association for Respiratory Care (AARC), we surveyed hospital-based owners of ventilators in the United States. The purpose of the survey was to inventory ventilators owned by US health care facilities serving patients with ARF. To be inclusive, we surveyed respiratory care managers at all US hospitals cataloged by the American Hospital Association (AHA) in the following categories (including pediatric subcategories when available): general medical and surgical, acute long-term care, cancer, chronic disease, heart, orthopedics, obstetrics and gynecology, rehabilitation, surgical, tuberculosis and other respiratory diseases, and other specialties.10
To ensure a robust response, sampling followed procedures outlined by Dillman et al.Reference Dillman, Smyth and Christian11 First, potential respondents were sent a letter from the AARC executive director and president and one from the US Department of Health and Human Services Assistant Secretary for Preparedness and Response encouraging survey participation. These were accompanied by a worksheet to assist respondents with presurvey response data collection (see Supplementary Appendix at http://www.dmphp.org/misc/rubinson.pdf). Three weeks later, a follow-up request was mailed to nonresponding hospitals. Subsequently, the AARC contacted each nonresponding facility by telephone to promote participation. Through their network of affiliate state respiratory societies, the AARC selected state coordinators who assisted with telephone follow-up. Throughout the survey response period, which began in August 2009 and ended in October 2009, emergency preparedness and critical care organizations assisted with an information campaign encouraging nationwide hospital response.
Survey Instrument
Respondents were asked to report on the number and types of mechanical ventilators owned by their respective medical facilities in the following 10 categories, based on the framework of Rubinson et alReference Rubinson, Branson, Pesik and Talmor1: full featured, high frequency, portable mechanical (pneumatic driven only), portable, basic emergency medical services transport, noninvasive, CPAP only, automatic resuscitators, neonatal-pediatric–specific and standby (no longer used for everyday patient care but maintained and available on site). The survey instrument was updated to include all mechanical ventilators and automatic resuscitators approved by the US Food and Drug Administration up until the date of the initial survey mailing. Manual resuscitators were not included. Also, anesthesia machines were not included, because respiratory care professionals were unlikely to be able to provide accurate information regarding anesthesia machine model, quantities, and functional capabilities.
The survey was pilot tested in 2 large metropolitan cities and field validated at 3 hospitals in advance of the national survey. The primary data collection was Internet based, although e-mail and paper options were available. The US Office of Management and Budget reviewed and approved the instrument with respect to the Paperwork Reduction Act.12
Ventilator Inventory and Statistical Analysis
Positive pressure ventilation devices were tallied by category. There is no established methodology for estimating total ventilator numbers at all US acute care hospitals from partial respondent data. We theorized that the number of ventilators in a hospital would be proportional to 1 or all of the following hospital characteristics: number of staffed beds, adult intensive care unit (ICU) beds, and/or total ICU beds. To estimate the number of ventilators from nonresponding or partially responding hospitals, we calculated ratios of reported ventilators to these characteristics and applied the ratios to estimate the number of devices owned by all US acute care hospitals (see Supplementary Appendix for example of calculations at http://www.dmphp.org/misc/rubinson.pdf). We also accounted for missing or partial data using multiple imputation methods, with staffed hospital beds, adult ICU beds, total ICU beds, AHA hospital type, and critical access hospital status as variables.Reference Rubin13 These methods yielded similar results (Table 1), with estimations based on the reported ventilator-to-total ICU bed ratio giving the most conservative results. The estimates using the ventilator-to-total ICU bed ratio were used for subsequent analyses (Table 2 and Figure 1 and Figure 2). All of the analyses were performed using SAS version 9.2 (SAS Institute Inc, Cary, NC).
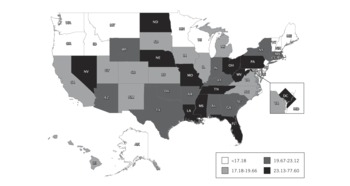
FIGURE 1 Full-feature ventilators per 100 000 population, by state.
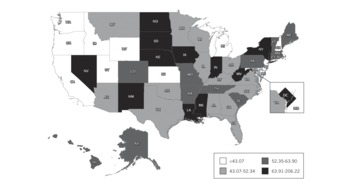
FIGURE 2 Pediatric-capable full-feature ventilators per 100 000 population younger than 14 years old, by state.
TABLE 1 Estimated Number of Full-Featured Mechanical Ventilators in US Acute Care Hospitals Using Various Estimation Methods
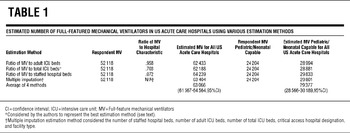
TABLE 2 Facility Type and Bed Type, by National Ventilator Inventory Response Status
United States Census estimates for 2008 were used to determine mechanical ventilators per 100 000 population.14 To calculate the number of devices per pediatric population, the US 2008 Census estimate for people younger than 14 years was used. We separated adult from pediatric ventilators based on the ability to deliver a tidal volume below 300 cm3,Reference MacIntyre and Branson15 the median tidal volume needed to ventilate children aged 13 to 14 with acute respiratory distress syndrome based on 6 cm3/kg body weight using US growth charts.Reference Kuczmarski, Ogden and Guo16
Institutional demographic data including hospital type and state as well as number of ICU beds and staffed hospital beds were ascertained from the 2007 AHA database. χ2 tests were used to compare respondent vs nonrespondent summative characteristics. The Mann-Whitney U test was used to assess differences among institutional characteristics. Two-tailed P values ≤.05 were considered statistically significant. Several hospitals not included in the AHA database (owing to nonparticipation or recent changes in hospital ownership) learned of the survey through publicity efforts. For these few non–AHA database hospitals (ie, those hospitals who responded to our survey did not participate in the 2007 annual AHA survey), hospital demographics except for state location were not available for analysis.
RESULTS
Of the 5752 US acute care hospitals, 4305 (74.8%) responded to the survey and reported ownership of 52 118 full-feature mechanical ventilators. Responding hospitals were significantly larger (staffed hospital beds; median, interquartile range [IQR] 102 [40–230] vs 60 [28–149]; P < .0001; Table 2) and had more ICU beds (8 [0–26] vs 4 [0–13]; P < .0001) than did nonrespondents. Responding hospitals represent 81.1% of the total US staffed hospital beds including 83.5% of adult ICU, 85.1% of pediatric ICU, and 84.6% of neonatal ICU beds. The respondent and nonrespondent groups included similar proportions of facilities with critical access hospital designation (P = .15).
Based on all 4 calculation methods, US hospitals own an estimated 63 066 (95% confidence interval, 61 567–64 564) full-feature mechanical ventilators (Table 3). Using the most conservative estimation method (the reported ventilator-to-total ICU bed ratio), we estimate that there are at least 62 188 of these devices in the United States, or approximately 20.5/100 000 population. The ratios of full-feature intensive care unit ventilators to staffed hospital beds, adult ICU beds, and total ICU beds are 0.072, 0.958, and 0.703, respectively. Quantities of full-feature ventilators per population varied across states (range, 11.9–77.6) with a state median population of 19.7/100 000 (IQR, 17.2–23.1) (Figure 1, Table 4).
TABLE 3 Reported and Estimated Number of Positive Pressure Ventilation Devices, by Category
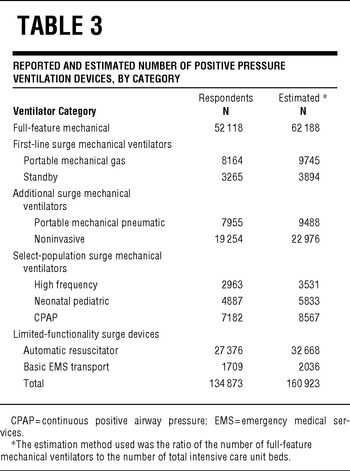
TABLE 4 Quantities of Full-Feature Ventilators per Population, by State

Supplemental digital content available online Quantities of Full-Feature Ventilators per Population, by State

Almost half (46.4%) of these full-feature devices either have baseline capability or were purchased with modification for ventilating pediatric and neonatal patients. This translates to an estimated 28 811 pediatric-capable full-feature ventilators in US hospitals, or 50.7/100 000 population younger than 14 years. Across states, the estimated range of pediatric-neonatal-capable full-feature mechanical ventilators per 100 000 population younger than 14 years was 22.1 to 206.2 per state with a state median of 52.3 (IQR, 43.1–63.9) (Figure 2). Respondents reported an additional 82 755 PPV devices (Table 3). The estimated quantity of these 9 additional categories of PPV devices in all US acute care hospitals is 98 738.
COMMENT
This survey is the first reliable national estimate of mechanical ventilators owned by US acute care hospitals and provides 3 important policy-related findings. First, with an estimated 20.5 full-feature ventilators per 100 000 population, the United States has proportionally more per capita PPV capacity than published available data demonstrates for other developed countries.Reference Hill, Fan and Stewart17Reference Anderson, Hart and Kainer18 For comparison, these numbers are considerably higher than those published for Australia and New Zealand (a mean of 5.4 ICU beds with mechanical ventilation capability per 100 000 population) as well as the Canadian province of Ontario (8.7/100 000).
Emergency planners have lacked a simple and accurate way to predict quantities of mechanical ventilators at hospitals within their jurisdictions and nationwide. This study provides robust ratios to estimate the number of full-feature ventilators based on the number of staffed beds, adult ICU beds, and/or total ICU beds. The strength of the estimates presented here derives from a validated survey instrument that included well-defined PPV device definitions, a sampling frame including all acute care US hospitals, and a high survey response rate. Our estimate of full-feature mechanical ventilators is slightly higher than Niska and Burt's estimateReference Niska and Burt6 and far less than that reported by Osterholm.Reference Osterholm7 Osterholm's methodology has not been published. Niska and Burt's estimate was derived from 739 hospital respondents from a sampling frame of 874 hospitals.
Second, nearly half of all US full-feature ventilators are reported to be able to ventilate small pediatric and neonatal patients. The actual size of the pediatric population that cannot be ventilated by an adult-only ventilator is likely smaller than the conservative cutoff of 14 years old (<50 kg) we used, so the relative ratio of pediatric-capable full-feature ventilators to pediatric and neonatal populations is probably even higher than we report. However, the number of devices owned by US hospitals that are capable of ventilating small children does not ensure that surge mechanical ventilation for pediatric and neonatal populations is no longer a challenge. Pediatric capability of the ventilator does not guarantee that the device will be available and unassigned (eg, to an adult) if, when, and where there is a surge of pediatric ARF. In addition, although hospitals may own pediatric-capable ventilators, they may not stock sufficient supplies of ancillary equipment (eg, pediatric-appropriate ventilator circuits, humidification equipment, closed-circuit suction catheters), rendering the PPV devices less useful for pediatric and neonatal patients. Finally, the presence of the device alone does not guarantee availability of skilled staff.
Third, US hospitals own a significant number of additional PPV devices that can be used to augment ventilator surge capacity beyond the baseline ratio of approximately 0.7 full-feature ventilators per ICU bed. Expert panels such as the Task Force for Mass Critical Care have recommended using sophisticated portable ventilators, which are normally used during patient transport, for augmentation of PPV equipment when there are insufficient full-feature ventilators.Reference Rubinson, Hick and Curtis9 We estimate that nearly 20 000 of these devices are owned by US hospitals. A total of 3894 “standby” ventilators are also owned by US hospitals. These devices are generally older-generation ICU machines that are no longer routinely used but are maintained for use in an emergency. These 3 categories of devices (2 categories of transport ventilators and standby) have many features that are similar to modern full-feature ventilators and represent a reasonable surge option for less-severe ARF without deviating significantly from standard respiratory practice.
Further surge capacity is indicated by the estimated 22 976 noninvasive devices owned by US acute care hospitals that may be used to provide standard noninvasive ventilation for appropriate types of ARFReference Nava and Hill19 as well as repurposed for invasive ventilation. The estimated 8567 CPAP devices and 5833 neonatal-pediatric specific devices have less general surge value but still may be useful for select subpopulations (eg, moderately ill infants). It is important to note, however, that CPAP-only devices have little utility for ARF.
The clinical implications of the relatively high US per capita PPV capacity can be understood in relation to Australia and New Zealand's experience with H1N1. These countries experienced the influenza pandemic during their traditional influenza season, reporting peak critical care needs by patients with 2009 H1N1 of between 0.63 and 1.06 ICU beds per 100 000 population.Reference Webb, Pettilä and Seppelt20 Their ICUs were challenged by the severity of illness, but in light of the fact that fewer than 25% of their total ICU beds were occupied with H1N1-associated critical illness, and 64.6% of these patients required PPV, it is not surprising that there were no widespread reports of ventilator shortages. And since the Northern Hemisphere pandemic influenza disease burden remained similar to the Southern Hemisphere experience, US PPV availability generally met the need, even for states at the lower range of ventilators per capita.
Our finding of considerable variation across states in the number of full-feature devices per adult and pediatric populations is in line with previous findings such as the Fisher et al report regarding wide variation in many aspects of health care supply.Reference Fisher and Wennberg21 Although the cause of this variation is not clarified by the study, its implications for regional preparedness for widespread ARF are important enough to warrant further investigation.
Despite the strengths of the methodology for this study, a number of limitations warrant highlighting. We counted a large number of devices. Still, these numbers are lower than the actual numbers of PPV devices across the United States because they do not include those rented by hospitals, those at facilities not captured within the AHA database and not responding to the survey, and those used at nursing facilities other than long-term ventilator and rehabilitation facilities, or those used by schools for respiratory care. Furthermore, devices owned by intrastate regions, states, and federal agencies such as the Strategic National Stockpile were not captured by this survey because we requested only counts of devices owned by the responding facility. The survey also did not capture PPV devices used in the community. There are an estimated 10 000 individuals using mechanical ventilation at homeReference Lewarski and Gay22; many have a primary ventilator and a back-up device. The features of devices used for home ventilation vary considerably, and these devices are usually assigned to a patient, so their utility for surge mechanical ventilation is difficult to estimate.
Respondents and nonrespondents differed by hospital bed numbers, presence of critical care units, and numbers of ICU beds, as well as by makeup by AHA facility classification. To account for these differences, we used the multiple imputations method to ascribe quantities of ventilators to nonrespondent hospitals based on the known quantities of ventilators at respondent hospitals with matching characteristics. The estimate of total full-feature ventilators in US acute care hospitals derived from the multiple imputations method was reassuringly similar to the results from additional methods, which did not directly account for facility classification differences (Table 1). Still, our study cannot determine whether ventilator numbers at respondent hospitals are inherently different from those at nonrespondent hospitals, even if the facilities are matched for size and facility type; this limitation leaves the possibility of residual inaccuracies in our estimate of devices in all hospitals. The potential influence of response bias is, however, tempered by our high response rate.
We sought PPV data from all US acute care hospitals; the response bias toward larger hospitals with more critical care capacity is not necessarily undesirable. Our goal was to count PPV devices at facilities where patients with ARF would be most likely treated during emergencies, in other words, facilities with ICUs. The vast majority of US hospitals with critical care capability responded to the survey, therefore we have an accurate count of ventilators at those facilities most likely to care for the majority of victims with ARF during an emergency.
Our study does not discern whether the PPV devices counted in our survey were available for use or were already assigned to a patient, so we are not certain how many could actually be used immediately. Moreover, there may be many total devices in the United States, but if the devices are not in the same location as patient demand, then surge mechanical ventilation response activities still may be necessary. Recognizing this vulnerability, contingency planning for worsening of the current influenza pandemic or a future event has led the US Department of Health and Human Services to continue to expand the number of PPV devices in the Strategic National Stockpile and support the development of novel surge mechanical ventilators.23
Positive pressure ventilation devices alone do not ensure mechanical ventilation capability. Expert and experienced staff who know how to care for critically ill patients are essential. Positive pressure ventilation devices are durable medical equipment, but they require ancillary equipment, most of which are consumable, to function. Our study did not assess the quantities of ventilator circuits, humidification equipment, suction equipment, physiologic monitors, medical gas, and airway interfaces. This additional information is important for an accurate determination of mechanical ventilation capability; the complexity of collecting these data for the entire country and our desire to maximize response rate led to our excluding this information for the present study.
In conclusion, the present study provides the first comprehensive snapshot of mechanical ventilators at US acute care hospitals. Compared to published reports from the Southern Hemisphere, this study suggests that the United States has sufficient mechanical ventilators for an event of similar severity to the current influenza pandemic. Counts of devices are necessary but not sufficient, however, for a true determination of mechanical ventilation capability. Future studies should address both the supply and geographic distribution of staff and ancillary equipment, utilization rates, and appropriateness of PPV use, as well as standardization of PPV device functional capabilities and staff training.
Funding Support: Funding was provided by the Office of the Assistant Secretary for Preparedness and Response of the US Department of Health and Human Services.
Authors' Disclosures: The author reports no conflicts of interest.
Acknowledgements The authors thank all of the volunteers in state respiratory societies and all of the respondents who took time from their busy schedules to assist with the data collection. We also thank Robert Shankman, from the Department of Health and Human Service's Office of the Assistant Secretary for Preparedness and Response, for his preparation of the geographic information system mapping of ventilator data. Tracy Agee, ARNP, provided significant editorial assistance.


