Article Text

Abstract
Objective To investigate the frequency and cause of neonatal ventilator alarms. Neonatal ventilators frequently alarm and also disturb babies, parents and nurses. If frequent they may cause alarm fatigue and be ignored. The number, frequency and details of neonatal ventilator alarms are unreported.
Methods We developed programs for retrieving and analysing ventilator data each second on alarms and ventilation parameters from 46 babies ventilated with Dräger Babylog VN500 ventilators using various modes.
Results A mean of 60 hours was recorded per baby. Over 116 days, 27 751 alarms occurred. On average, that was 603 per baby and 10 per hour. Median (IQR) alarm duration was 10 (4–21) s. Type, frequency and duration varied between infants. Some babies had >10% of their time with alarms. Eight alarm types caused ~99% of all alarms. Three alarms, ‘MV <low limit’, ‘MV >high limit’ and ‘respiratory rate >high limit’, caused 46.6%, often due to inappropriate settings. 49.9% were due to a low expired tidal volume during volume guarantee ventilation, often due to the maximum pressure being set too low. 26 106 (94.1%) of all alarms lasted <1 min. However, 86 alarms lasted >10 min and 16 alarms >1 hour. Similar alarms were frequently clustered, sometimes >100/hour.
Conclusions Frequent ventilator alarms are caused by physiological variability in the respiratory rate or minute volume, inappropriate alarm limits or too low maximum peak inflating pressure during volume-targeted ventilation. While most alarms were very short, sometimes alarms were ignored by neonatal intensive care unit staff for long periods.
- respiratory
- neonatology
- data collection
- monitoring
Statistics from Altmetric.com
What is already known on this topic?
Neonatal ventilators have frequent alarms but not all need urgent attention.
Ventilator alarms can disturb babies, parents and nurses and if frequent, they may cause alarm fatigue and be ignored.
Details of neonatal ventilator alarms have not been reported.
What this study adds?
Half of ventilator alarms are due to physiological variability in the respiratory rate or minute volume or inappropriate settings of the relevant alarm limits.
In volume guarantee ventilation, frequent alarms are caused by failure to achieve the set tidal volume due to limitation of the peak inflating pressure limit.
While most alarms last for <1 min, sometimes alarms are tolerated by staff for very long periods.
Introduction
About 1.2% of newborns receive mechanical ventilation.1 For safety, ventilators have multiple alarms. Some alarms report failure of gas supply, disconnection or obstruction of circuit, flow sensor problems, and so on. Others occur when a parameter (eg, tidal or minute volume (MV), peak pressure, or respiratory rate (RR)) is outside a range set by the user. Frequent alarms may occur if the limits are inappropriately set. Ventilation with inappropriate settings may cause long-term morbidities.2 Overventilation and hypocapnia are associated with cerebral white matter injury and poor neurodevelopmental outcome.3–5
Frequent audible alarms may affect developmental care particularly when several ventilated babies are in the same room.6 They cause staff ‘alarm fatigue’.7–9 If some alarms are not responded to immediately that may lead to serious incidents.10 There is a trade-off between setting a narrow target range (too frequent triggering and alarm fatigue) and too wide a range (potentially compromising patient safety). The ECRI Institute (formerly the ‘Emergency Care Research Institute’), a not-for-profit organisation researching approaches to improving patient care, has declared ventilator alarms as one of the top 10 health technology hazards for 2017.11
Recently, large-scale audits of patient monitor alarms have been performed on intensive care units by downloading patient monitor data.7 12 However, auditing ventilator alarms from neonatal units has not been reported. A paediatric intensive care unit study did not report ventilator alarms systematically because of difficulties with obtaining time-stamped data.13 Bergon-Sendin et al included ventilators in their alarm audit on a neonatal intensive care unit (NICU); however, they focused on appropriate equipment use and did not analyse alarm data.14 Manual data collection of ventilator alarms is labour intensive, introduces observational bias, data loss, and is unreliable.
We have investigated the causes, frequency and duration of ventilator alarms in our NICU. We developed a technique of analysing details of neonatal ventilator alarms and associated ventilator parameters.
Methods
Patients
Ventilator alarm data were collected and analysed as part of a registered service evaluation, authorised by the Research and Development Department of Cambridge University Hospitals NHS Trust (registration number: 4572) who agreed no individual parental consent or ethical review was required. Data were collected anonymously from Babylog VN500 ventilators (Dräger, Lübeck, Germany) with a convenience sample of 50 infants between September 2015 and July 2016. The clinical team was aware of the study but not its purpose. No aspect of any infant’s ventilation was affected by the data collection. The median gestational age was 28.5 weeks (range 23–42 weeks). Twenty-one infants were born at 23–27 weeks’ gestation, 10 at 28–32 weeks, 7 at 33–36 weeks and 12 at >36 weeks. The mean weight during the recordings was 1810 g (range: 515–4300 g). Infants were ventilated for various neonatal problems including respiratory distress syndrome, sepsis, meconium aspiration, hypoxic-ischaemic encephalopathy and congenital diaphragmatic hernia. Four had data collected for <12 hours. This was too short for collecting accurate data on alarms and so they were not included in this report.
Data retrieval and analysis
Data on all ventilation parameters and alarms were downloaded from a ventilator communication port to a laptop using data logging software developed by the ‘Technology and Intellectual Property’ department of Dräger Medical. It is not commercially available. Data were retrieved from the ventilator’s Medibus protocol. Alarm data were retrieved with a time stamp accurate to a millisecond when an alarm was triggered and again when the alarm’s value returned to the target range. Alarm limit settings and ventilator parameter settings were recorded automatically when the recording started and when they were changed. Data were collected every second. The pressures shown on the graphs are of the last full inflation applied to the patient before the time stamp. MVs were calculated by the ventilator from the flow data over 20 s windows with appropriate filters. Data were exported as .csv text files.
To analyse this very large data set we used Python (V.3.5.1 https://www.python.org) and its add-on packages. All the software is open source. We used the IPython Notebook (V.4.1.2, http://ipython.org/notebook.html) as a programming interface. Data were analysed using the pandas (V.0.18.0, http://pandas.pydata.org) and NumPy (V.1.10.4, http://www.numpy.org) packages. Graphs were produced using matplotlib (V.1.5.1, http://matplotlib.org). Analysis was done with a MacBook Pro V.2014, 2.6 GHz i5 processor and 8 Gb RAM memory. We have also uploaded our code to the GitHub code repository (https://github.com/belteki/alarms). Readers can follow the analyses or reuse the code to analyse their own data obtained in a similar format.
Results
Data were collected continuously from 46 babies, on average for 2.5 days (range 22–165 hours). Total data collection was 116 days. Thirty-four babies (74%) received assist-control ventilation also called synchronised intermittent positive pressure ventilation (SIPPV), 14 (30%) synchronised intermittent mandatory ventilation (SIMV), 14 (30%) high-frequency oscillatory ventilation (HFOV) and 3 (6%) pressure support ventilation. Volume guarantee (VG) mode was used, at least part of the time, in 45. Many received more than one mode during the recording period.
There were 27 751 alarms recorded, on average, 603/patient, 238/24 hours’ recording, ~10/patient/hour (range: 0.75–57.2). The median (IQR) alarm duration was 10 (4–21) s, defined as when alarm was active, irrespective of whether it was silenced or not. Cumulative statistics about number and duration of the frequent alarms are shown in table 1. The type, frequency and duration of alarms varied between infants. Alarms of a similar kind were frequently clustered, sometimes >100/hour (figure 1A). Some babies had over 10% of their recording time with one or more alarms active (figure 1B). Similar graphs for all recordings can be found in online supplementary file 1 and2. Alarm definitions are found in online supplementary table 1.
Supplementary file 1
Supplementary file 2
Supplementary table 1

(A) Individual alarm events from one baby recording (DG032-2) over ~90 hours. Each small vertical line represents one alarm event. The horizontal labels on the left show the type of alarm. Some alarms occurred much more commonly than others and tended to cluster. (B) This shows the proportion of the recording when different alarms were active. Alarm definitions are given in online supplementary table 1.
Number and duration of the eight most frequent ventilator alarms during the whole study, ordered by frequency. They represent over 99% of all alarm events. Alarm definitions are given in online supplementary table 1
Frequently occurring alarms
We investigated which alarms occurred frequently. There were 22 different alarms, of which 8 caused ~99% of all alarm events (table 1). We therefore focused on these. Three alarms where the user sets the alarm limits accounted for 46.5%: ‘minute volume < low limit’ (7792 (28%) events), ‘minute volume > high limit’ (2376 (8.6%) events)’ and ‘respiratory rate > high limit’ (2760 (9.9%) events). To investigate why these alarms were so frequent, we plotted the MV and RR over the course of recordings, together with the respective set alarm limits (figure 2 illustrates these from two recordings). It can be seen there were many occasions when the MV was above the upper alarm limit. Similar graphs for all recordings can be found in online supplementary file 3 and 4.
Supplementary file 3
Supplementary file 4
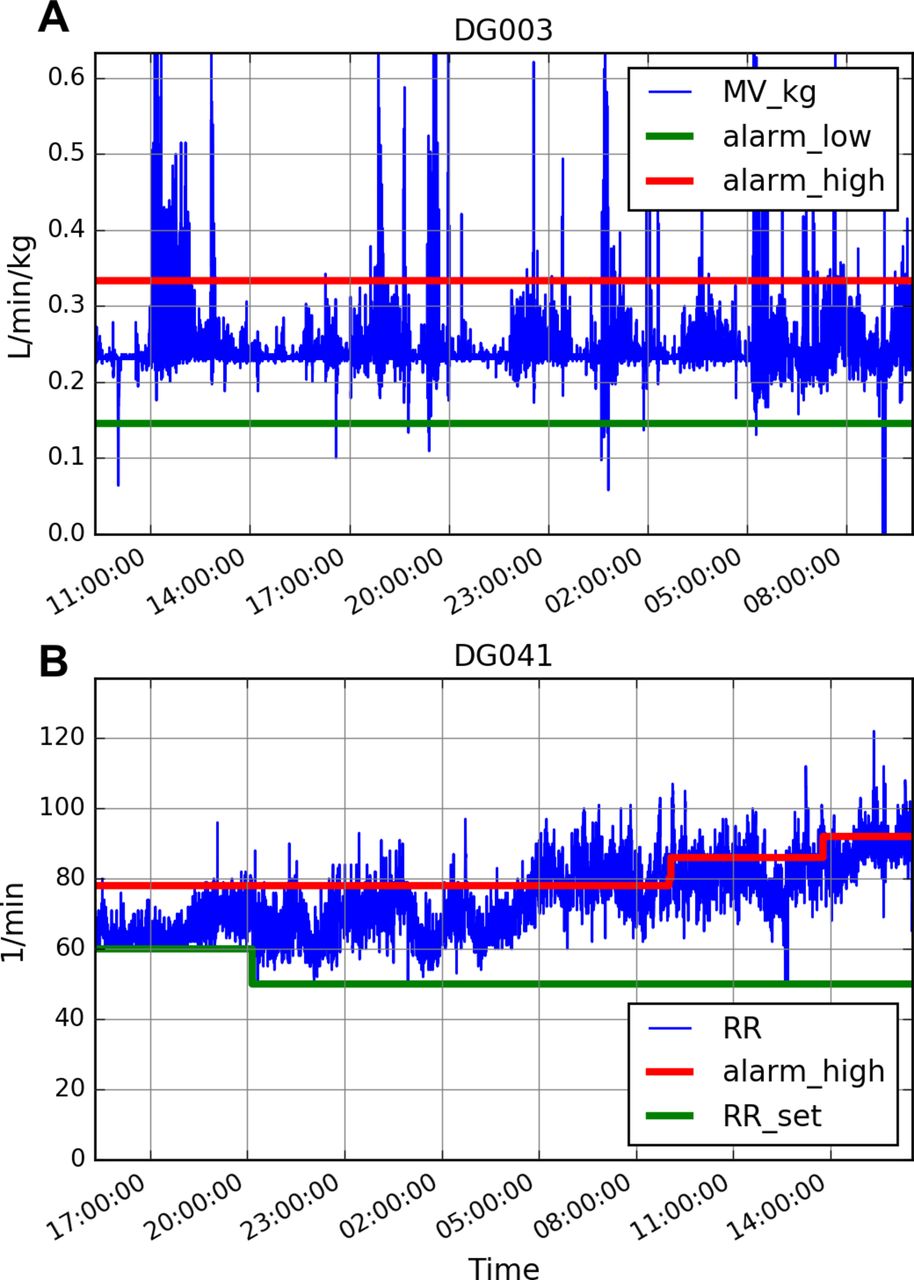
(A) Recording of the minute volume (MV) for baby DG003 for ~24 hours. It also shows the upper and lower alarm limits set by the clinical team. When the MV went above or below those limits the alarm sounded. It can be seen there were many occasions when the MV was above the upper alarm limit. (B) Variability of the respiratory rate (RR) for baby (DG041) ventilated with assist-control (synchronised intermittent positive pressure ventilation) mode over ~24 hours. It also shows the upper RR alarm limit and the set minimum (back-up) RR, and how these were changed by the clinical team. When the RR went above or below those limits the alarm occurred. It can be seen the RR was frequently higher than the upper alarm limit.
High MV alarms
The number of ‘minute volume > high limit’ (‘MV high’) alarm events varied widely for different babies, even when normalised for 24-hour periods. In some it was uncommon, either because the MV hardly varied due to deep sedation or muscle relaxation, or because the alarm limit was set inappropriately high, sometimes even >1 L/kg/min in conventionally ventilated babies. In other cases, when the MV high alarm was set at an apparently physiologically meaningful level and there was significant variability in the MV, the alarm was triggered hundreds of times (figure 2A). Interestingly, arterial blood gases during the two recordings with the highest number of high MV alarms (DG003 and DG023) did not show hypocapnia (lowest PaCO2 was 4.8 kPa (36 mm Hg) and 4.7 kPa (35 mm Hg), respectively), but the blood gas measurements may not have coincided exactly with the high MV periods. The alarm triggering sometimes prompted staff to increase the alarm limit to very high levels (eg, DG045 in online supplementary file 3). HFOV has a higher measured MV than conventional ventilation but occasionally the high alarm limit was not changed when the mode changed to conventional (DG016).
Low MV alarms
There were cases when the ‘MV low’ alarm was triggered over a hundred times. Sometimes, this was due to inappropriately high settings, for example, set at >0.2 L/min/kg (eg, DG011). In other cases, the MV variability was high (eg, DG045), or fell below 0.2 L/min/kg (eg, DG013). As many recordings were with VG mode and appropriate back-up rates, the expired tidal volume (VTe) must have been reduced during these periods. The ‘tidal volume < low limit’ alarm often coincided with the MV low alarm (see figure 1A).
High RR alarms
The ‘respiratory rate >high limit’ (‘RR high’) alarm was frequently triggered when an infant’s breathing was over the set RR (figure 2B). This occurred during both SIPPV and SIMV modes, even when the RR high alarm limit was >100/min. Some may have been triggered by condensed water moving in the circuit imitating spontaneous breathing.
Tidal volume <low limit alarms
Three frequent alarms were related to the set VTe not being achieved. The ‘tidal volume < low limit’ (7734 (27.9%) events) occurred if the VTe was <90% of the set VTe for eight consecutive inflations. The ‘volume not constant’ (3676 (13.2%) events) and the ‘tube obstructed’ (2437 (8.8%) events) alarms also refer to the VTe not being achieved (for definition see online supplementary table 1) and may sometimes refer to the same clinical event. These three alarms accounted for 49.9% of all alarm events and sometimes dominated the recording, or part of it. Failure to achieve the targeted VTe occurs with the VG mode and may be due to: (1) excessive leak around the endotracheal tube, (2) a low set maximum inflation pressure (Pmax) so the pressure cannot increase enough to deliver the set VTe, and (3) the baby splinting the abdominal muscles against an inflation and obstructing gas flow.
The other two frequent alarms were: ‘disconnection ventilator’ (476 (1.7%) events) and ‘check neonatal flow sensor’ (195 (0.7%) events). While the disconnection alarm may signal accidental disconnection, in most cases it was triggered by ventilator circuit disconnection during endotracheal tube suctioning. The ‘check neonatal flow sensor’ alarm can mean any flow sensor malfunction but it is usually caused by either corrupted calibration data that can be remedied by sensor recalibration, or the sensor is contaminated.
The duration of alarms
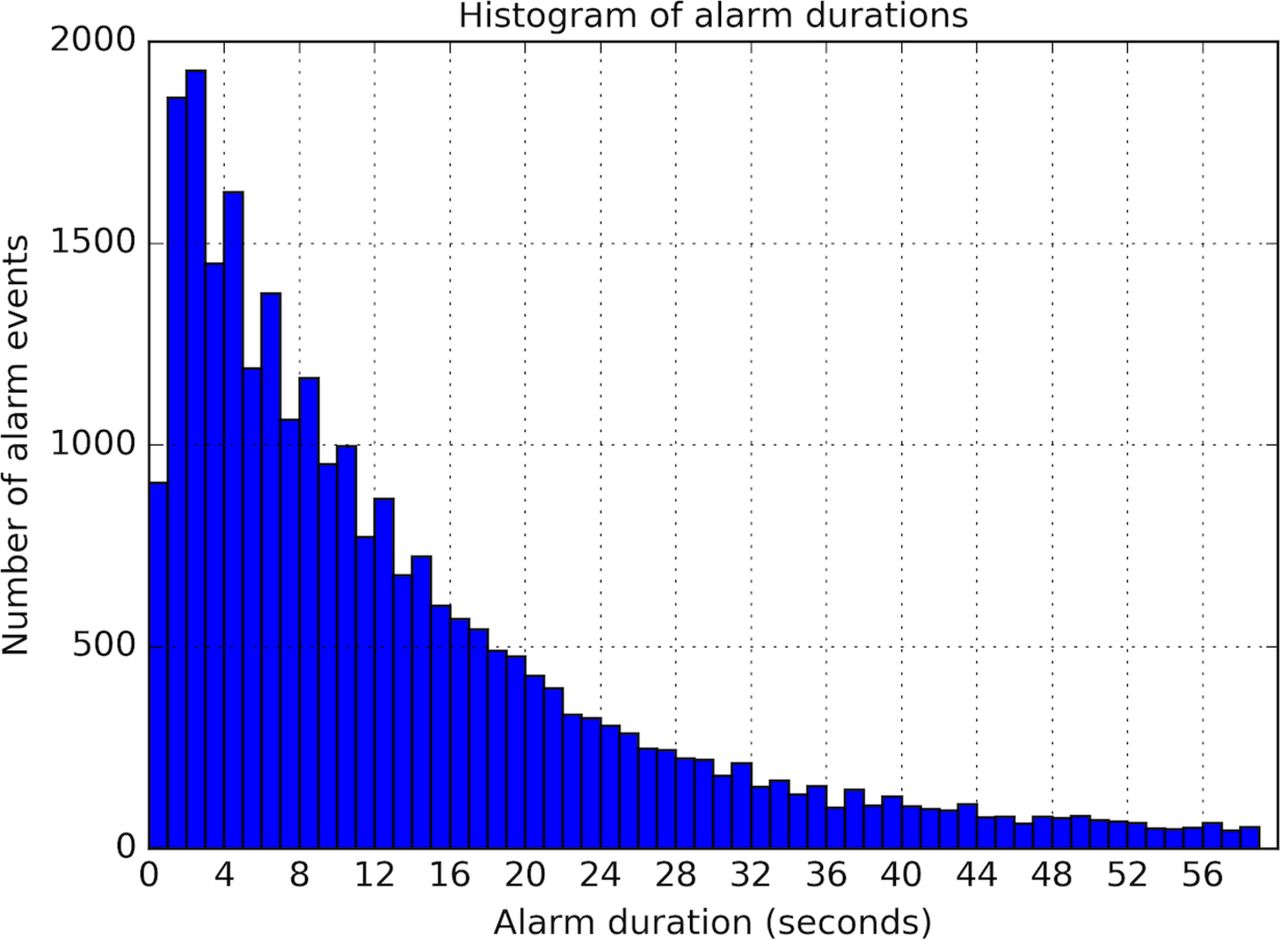
The median duration of individual alarms was 10.0 (IQR 4.0–21.0) s; 26 106 (94.1%) alarms lasted <1 min and 13 516 (48.7%) lasted <10 s (figure 3). The median duration was very different for different alarms ranging from 1 to 277 s (table 1 and not shown). Of the seven frequent alarms, only the ‘Check neonatal flow sensor’ alarm had a median time >30 s. The MV, ventilator rate and tidal volume alarms were typically frequent and short and activated and inactivated usually before a clinician intervened.

Histogram of alarm durations. Most alarms were short, lasting for less than 20 s. Alarms were considered active when the event triggering the alarm was present even if the alarm sound was silenced. Alarms longer than 1 min are not shown on this graph but they are discussed in the text (see online supplementary tables).
Very prolonged alarms
The duration of 86 alarm events was >10 min and 17 lasted >1 hour (online supplementary table 2). For example, the ‘minute volume > high limit’ alarm of recording DG032_2 was continuously active for ~4 hours and 20 min between 03:13:33 and 07:33:12 (see relevant graph in online supplementary file 3). This was when the ventilator was changed to HFOV mode but the high MV alarm limit stayed at 0.45 L/min/kg, the level used for conventional ventilation. This was much less than the >1 L/min/kg MV during HFOV. Staff responded about 4 hours later by increasing the MV high alarm limit to 1.7 L/min/kg. This showed that NICU staff can ‘adapt’ to persistent alarms, with a potential risk to patient safety.
Supplementary table 2
Ten out of the 16 alarms lasting >1 hour were flow sensor alarms. These were also common with alarms lasting between 10 min and 1 hour. This is a problem as an accurate flow sensor is essential for correct VTe measurement during VG ventilation. It is therefore important to educate staff to respond promptly to these alarms.
Discussion
Although ventilator alarms are frequent and known to disturb babies, parents and staff, this is the first report, using downloaded digital data and programmatic analysis, to investigate neonatal ventilator alarms. The open-source Python language is an ideal tool to process and analyse such data. Using Python and its add-on packages we created a data analysis workflow that ensured transparency and reproducibility of the analyses. We share our code and the readers can inspect it or reuse it to analyse their own data.
This study has shown neonatal ventilator alarms are very frequent at about 10/hour/baby. What was most surprising was that half were from just three alarms. Often this was because the alarm limits were set inappropriately.
We identified alarms that caused frequent or long-duration events. These results can be used to educate staff how to set alarm limits and respond to different alarms. It should also help ventilator manufacturers and regulators by informing them about the usefulness of various alarms in clinical practice. We hope such data will be routinely available from future neonatal ventilators.
Some frequent alarms, such as high and low MV and RR alarms, are rarely important for clinical surveillance, which is probably why they get ignored. We suggest that in ventilated breathing babies there is considerable variability in the RR and MV and therefore the alarms cannot be set at physiologically appropriate levels without causing significant alarm activity. Therefore, the value of these alarms, in their current format, is questionable. As many of the MV and RR alarms only lasting a couple of seconds (see figure 3) their frequency could be reduced by delaying them for a time which would not compromise patient safety, for example, 10 s. This is possible with the Dräger Babylog VN500. In the longer term, ‘intelligent alarms’ considering changes rather than absolute values in several parameters consecutively may be possible.
There were many low tidal volume alarms where the Pmax limited the peak pressure and stopped the ventilator delivering sufficient pressure to ensure the set VTe was delivered. We suggest the Pmax should be set at a high level where it is unlikely to trigger alarms frequently but where clinicians need to know the ventilator is using a high peak pressure so they can assess what is happening to the ventilator and the baby and whether any clinical intervention or changes in ventilation are needed.
Our study’s strengths are the wide range of the subjects’ gestational age, weight and indications for ventilation, the long duration of each recording and very detailed computerised data collection and analyses. A weakness is that only one type of ventilator was studied. Flow sensor accuracies and the way alarms are set up and triggered will vary with manufacturer. We hope similar reports from other units with other ventilators will clarify the generalisability of these data.
Conclusions
Neonatal ventilator alarms occur very frequently. Some are appropriate and lead to clinical interventions or changes in ventilator settings. However, almost half of them are caused by physiological variability in the RR or MV, or inappropriate setting of relevant alarm limits. During VG ventilation, frequent alarms are also caused by failure to achieve the set tidal volume due to the peak inflating pressure being limited. While most alarms last for <1 min, sometimes alarms were accepted by staff for very long periods. If more rigorous attention is paid to the frequency and duration of ventilator alarms they could be substantially reduced.
Acknowledgments
We thank Thomas Krueger, Kreske Brunckhorst and the engineers of Dräger Medical for help with data exported from the ventilator and checking our interpretation of the ventilator alarms. We thank Dr Amanda Ogilvy-Stuart for her advice and comments on the manuscript.
Footnotes
Contributors GB conceptualised and designed the study, collected the data, written the computer code for data analysis and performed the computational data analysis. CJM assisted in data analysis and interpretation of the different alarm events. GB and CJM wrote the manuscript together and approved the final manuscript as submitted.
Competing interests None declared.
Provenance and peer review Not commissioned; externally peer reviewed.
Linked Articles
- Editorial