Article Text

Abstract
AIMS To examine the haemodynamic effects of brief alteration in arterial oxygenation in preterm infants with respiratory failure.
METHODS Eighteen preterm infants with respiratory failure, aged 9–76 hours, underwent detailed Doppler echocardiographic assessment at 86%, 96%, and 100% SaO2, achieved by altering the FIO2. Sixteen were receiving intermittent positive pressure ventilation, median FIO2 0.45 (0.20–0.65), median mean airway pressure 12 cm H2O (0–20). SaO2 was stable for 15 minutes at each stage. Four parameters of pulmonary arterial pressure were measured: peak velocity of tricuspid regurgitation and peak velocity of left to right ductal flow, TPV:RVET ratio and PEP:RVET ratio, measured at the pulmonary valve, along with flow velocity integrals at the aortic and pulmonary valves, and systemic arterial pressure. Ductal size was graded into closed, small, moderate, large with imaging, pulsed and continuous wave Doppler.
RESULTS Between 86% and 96% SaO2, there were no consistent changes, but in three of the 12 with a patent ductus arteriosus (PDA) there was ductal constriction, with complete closure in one. Between 96% and 100% SaO2, peak ductal flow velocity rose significantly in four of eight with a PDA. Ductal constriction occurred in four infants; in three this was associated with a significant fall in aortic flow integral and a rise in aortic pressure (4–6 mm Hg). Overall, 11 infants went from 86% to 100% SaO2 and pulmonary arterial pressure fell significantly in seven.
CONCLUSION A brief rise in SaO2 within the range maintained by most neonatal units can cause significant ductal constriction. The fall in pulmonary arterial pressure with 100% SaO2 seen in most infants was associated with a fall in pulmonary blood flow (or no change), rather than a rise, indicating that the dominant haemodynamic effect was ductal constriction rather than pulmonary vasodilation.
- echocardiography
- pulmonary artery pressure
- patent ductus arteriosus
- oxygen saturation
Statistics from Altmetric.com
Careful control of arterial oxygenation is crucial to the management of babies with neonatal respiratory failure. Hyperoxia is associated with retinal damage1-3 and so most units try to avoid high blood oxygen concentrations, particularly in extreme prematurity. It is now well established that hyaline membrane disease is associated with pulmonary hypertension, systemic hypotension, and prolonged ductal patency.4-6 From physiological studies in both animals and humans7-11 it can be predicted that, in the presence of respiratory disease, the attainment of higher oxygen concentrations by the adjustment of supplemental oxygen could lead to a beneficial reduction in pulmonary arterial pressure, an increase in systemic pressure, and ductal constriction or closure. Thus increasing inspired oxygen concentrations might improve some of the major haemodynamic features of neonatal respiratory failure. Healthy preterm infants normally have arterial oxygen saturation concentrations above 95%, as assessed by a pulse oximeter validated against arterial line measurements.12
Doppler echocardiographic techniques now permit detailed non-invasive assessment of the haemodynamic effects of different concentrations of inspired oxygen. This study uses four Doppler echocardiographic methods of pulmonary arterial pressure estimation combined with Doppler indices of right and left ventricular stroke volume and measurement of systemic arterial pressure.
This study aimed to examine the haemodynamic effects of a temporary increase in arterial oxygen saturation (SaO2) from 86% (84–88%), to 96% (95–97%) for 10–15 minutes and from 96% to 100% for 10–15 minutes in preterm infants with respiratory failure.
Methods
Eighteen preterm infants with respiratory failure secondary to hyaline membrane disease and undergoing intensive care were studied. Clinical details are summarised in table 1. Infants were not receiving inotropic support and none had received indomethacin. In three subjects the arterial duct was closed; the other 15 had a patent duct and are listed in order of gestational age from 28 to 36 weeks (mean 31.2 weeks) (table 1). Birthweight was 800–2990 g (mean 1721 g). The infants were aged between 9 and 76 hours. All but two were receiving intermittent positive pressure ventilation (IPPV) (cases 17 and 18). One baby receiving IPPV was breathing air (case 15), and another 24% oxygen (case 14). The rest were breathing between 40 and 65% oxygen.
Clinical details at start of study
Ethical approval was obtained from the district ethics committee. All echocardiographic examinations were performed using a Hewlett-Packard ultrasound machine with imaging, pulsed and continuous wave Doppler facilities by the same observer (JRS) and recorded on tape for subsequent analysis. The examinations at different SaO2concentrations were recorded with coded identification labels on different tapes and analysed later to avoid subjective bias in interpretation of the Doppler signals. Patients were selected only if they were clinically stable. None had undergone any other therapeutic intervention over the previous hour, such as administration of inotropes or surfactant, or alteration of ventilator settings. Each baby had already been placed in a supine position after their last period of nursing care. No additional sedation was given for the examination. Before echocardiography, the SaO2concentration was controlled by a Nellcor N200 (Hayward, CA) pulse oximeter, calibrated against arterial line measurement for use in the neonate12-14 in the beat to beat mode, and, when necessary, the FIO2 was adjusted to achieve an SaO2 concentration between 84 and 88%. The SaO2 was stable for at least 15 minutes before the start of the investigation.
After the first echocardiographic examination, the FIO2 was increased to achieve 95–97% saturation, and the level was maintained for 10 to 15 minutes before the second examination. The final measurement was done after increasing the FIO2 to 100%, to achieve 100% SaO2 (or as high as possible when unventilated) for 10 to 15 minutes.
It was planned to study the phase of hyperoxia (FIO2 and SaO2 100%) in babies over 30 weeks of gestation only. However, on applying the Nellcor N200 pulse oximeter, some babies being monitored by other techniques were found to have 100% arterial saturation at the beginning of the study. In these cases, the procedure was performed in reverse, allowing the inclusion of some babies of less than 30 weeks gestation in the hyperoxia stage, although these infants were not breathing 100% oxygen (table 1). Due to a technical problem studies at 96% SaO2 were not recorded in cases 2 and 11. Fig 1 summarises the examinations performed at each level, and the order in which they were done in each baby.

Direction of SaO2 change in 18 preterm infants with respiratory failure showing direction in which SaO2 was altered during the study; cases 3, 9, 10 and 13 were studied in reverse because SaO2 was 100% with the Nellcor oximiter on application.
DOPPLER INDICES OF PULMONARY ARTERIAL PRESSURE
The most reliable methods involve measuring peak velocity of tricuspid regurgitation (tricuspid regurgitation) and peak velocity of ductal flow. However tricuspid regurgitation and a patent duct are not always present, so two systolic time interval ratios were also used: TPV:RVET and PEP:RVET, respectively.
The PEP:RVET ratio15 16 is the ratio of the right ventricular pre-ejection period divided by the right ventricular ejection time, and was measured by pulsed Doppler at the pulmonary valve. It is directly related to mean pulmonary arterial pressure and is largely independent of heart rate. The ratio also increases with right ventricular dysfunction.
The TPV:RVET ratio17 18 is the ratio of the time to peak velocity at the pulmonary valve divided by the right ventricular ejection time and was measured by pulsed Doppler at the pulmonary valve. It is inversely related to mean pulmonary arterial pressure.
Peak left to right ductal flow velocity (m/s)5 19 20 is determined by the pressure gradient between the aorta and pulmonary artery, and is therefore influenced both by systemic and pulmonary arterial pressure. If systemic pressure is stable and pulmonary arterial pressure falls, peak left to right ductal flow velocity will increase.
The peak velocity of tricuspid regurgitation (m/s)5 18 21 22 is dictated by the pressure gradient from right ventricle to right atrium in systole. The modified Bernoulli equation (Δp=4v2, where p= pressure drop (mm Hg) and v= velocity (m/s) can be applied to the peak velocity to produce the peak right ventricle to right atrial pressure drop. As right atrial pressure changes relatively little, changes in the velocity directly reflect changes in systolic pulmonary arterial pressure. It can only be measured if there is sufficient tricuspid regurgitation to generate a measurable signal. Studies of repeatability23 suggest that it is better to use the measured velocity rather than the derived pressure drop, as this avoids squaring and multiplying error.
INDICES OF PULMONARY AND SYSTEMIC BLOOD FLOW
Aortic stroke distance24 25 is the aortic flow integral in centimetres, measured using stand-alone continuous wave Doppler from the suprasternal notch. In serial measurement (where the aortic cross sectional area is assumed to remain constant between measurements), it is directly related to left ventricular stroke volume, and therefore to pulmonary venous return. The average (SD) value in healthy preterm infants21 at 12–72 hours old is 9.6 (1.6) cm.
Pulmonary stroke distance23 25 26 is the flow integral at the pulmonary valve, measured using pulsed wave Doppler. In serial measurement (where cross sectional area of the pulmonary valve is assumed to remain constant) it is directly related to right ventricular stroke volume, and therefore to systemic venous return. The average value is 7.8 (2.2) cm.
Ductal size was graded using a combination of cross sectional imaging, pulsed and continuous wave Doppler as closed, small (with very narrow Doppler signal on pulsed wave sampling in the main pulmonary artery), moderate (broad signal but clear evidence of constriction), or large (no constriction). A change from one grade to another was considered significant.
Also recorded were heart rate and systolic and mean arterial blood pressure by indwelling arterial line or by oscillometry (Dynamap).
STATISTICAL ANALYSIS
Limits of within observer repeatability for the Doppler measurements were established before,23 and were used in the analysis of results in this section. The repeatability coefficients (95% confidence limits for repeatability) were: PEP:RVET, 0.12:1; TPV:RVET, 0.10:1; peak left to right ductal flow velocity 0.48 m/s; tricuspid regurgitation, 0.26 m/s; aortic stroke distance 1.1 cm, and pulmonary stroke distance 1.9 cm.
Each of the Doppler measurements is in different units, so to allow meaningful comparison of the results from all of the babies and all of the techniques, the values have been expressed as changes from the initial value in “confidence steps”.23 One confidence step is equal to the within observer repeatability coefficient (95% confidence limits of repeatability) of that measurement. Taking tricuspid regurgitation as an example, the repeatability coefficient is 0.26 m/s. A change of 0.26 m/s from the initial value indicates a genuine change, larger than the potential error due to the measurement technique and to random variability about 95% of the time, and represents one confidence step. A change of 0.52 m/s is two confidence steps, etc. Changes in each Doppler index are presented as confidence steps from the baseline value. Changes were viewed as significant when one confidence step was reached.
Results
The baseline values for the Doppler measurements are shown in table 2. In some babies some indices of pulmonary arterial pressure were not measurable. The first three subjects had closed arterial ducts, and cases 3 and 6 did not have tricuspid regurgitation. In cases 3, 8, and 16, there was interference on the ECG signal, so that the pre-ejection period (PEP)could not be accurately determined.
Haemodynamic measurements at 84-88% oximetry values
Fig 2 summarises the changes in each index of pulmonary arterial pressure between different saturations. Leftward deflection from zero indicates a fall in pulmonary arterial pressure (a decrease in tricuspid regurgitation and PEP:RVET, and an increase in TPV:RVET and ductal flow velocity (labelled as “PDAmax”)), and rightward deflection indicates a rise. Fig 3 shows an example of the change in the flow pattern through the arterial duct between SaO286% and 100% as pulmonary arterial pressure fell. Fig 4 shows serial measurements of the peak left to right velocity across the arterial duct for each infant.
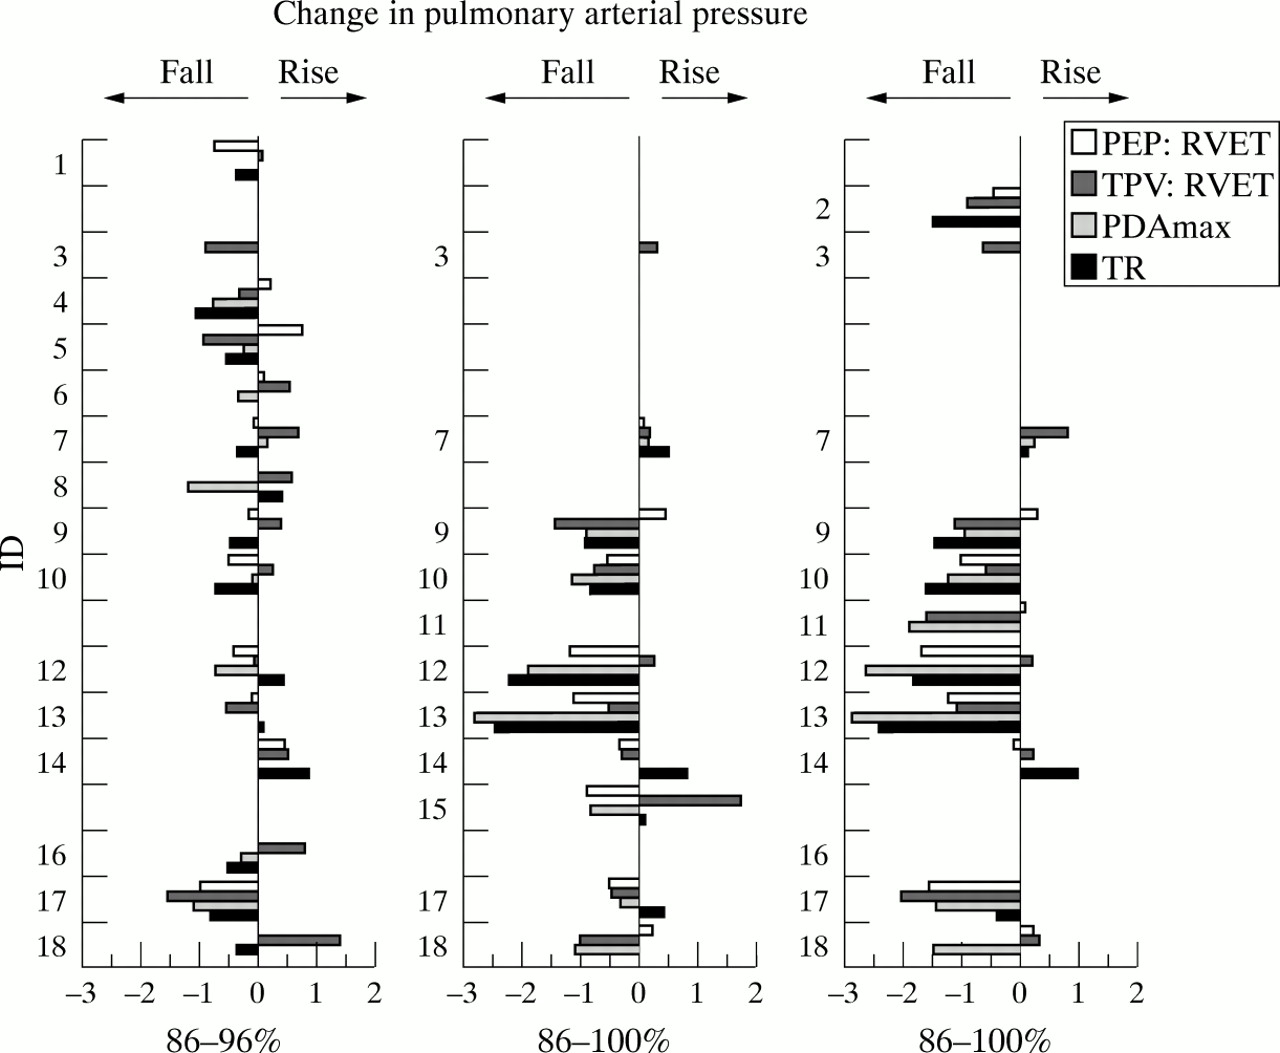
Changes in four Doppler indices of pulmonary arterial pressure during alteration in SaO2 in 10 to 15 minute stages from 86% to 96% SaO2, 96% to 100% SaO2, and the overall change from 86% to 100% SaO2. Values are presented as change from zero as multiples of the repeatability coefficient for each measurement (confidence steps). Leftward deflection indicates a fall in pulmonary arterial pressure (fall in PEP:RVET or peak velocity of tricuspid regurgitation (TR) and a rise in TPV:RVET or peak left to right ductal flow velocity (PDAmax)), and rightward deflection indicates a rise.
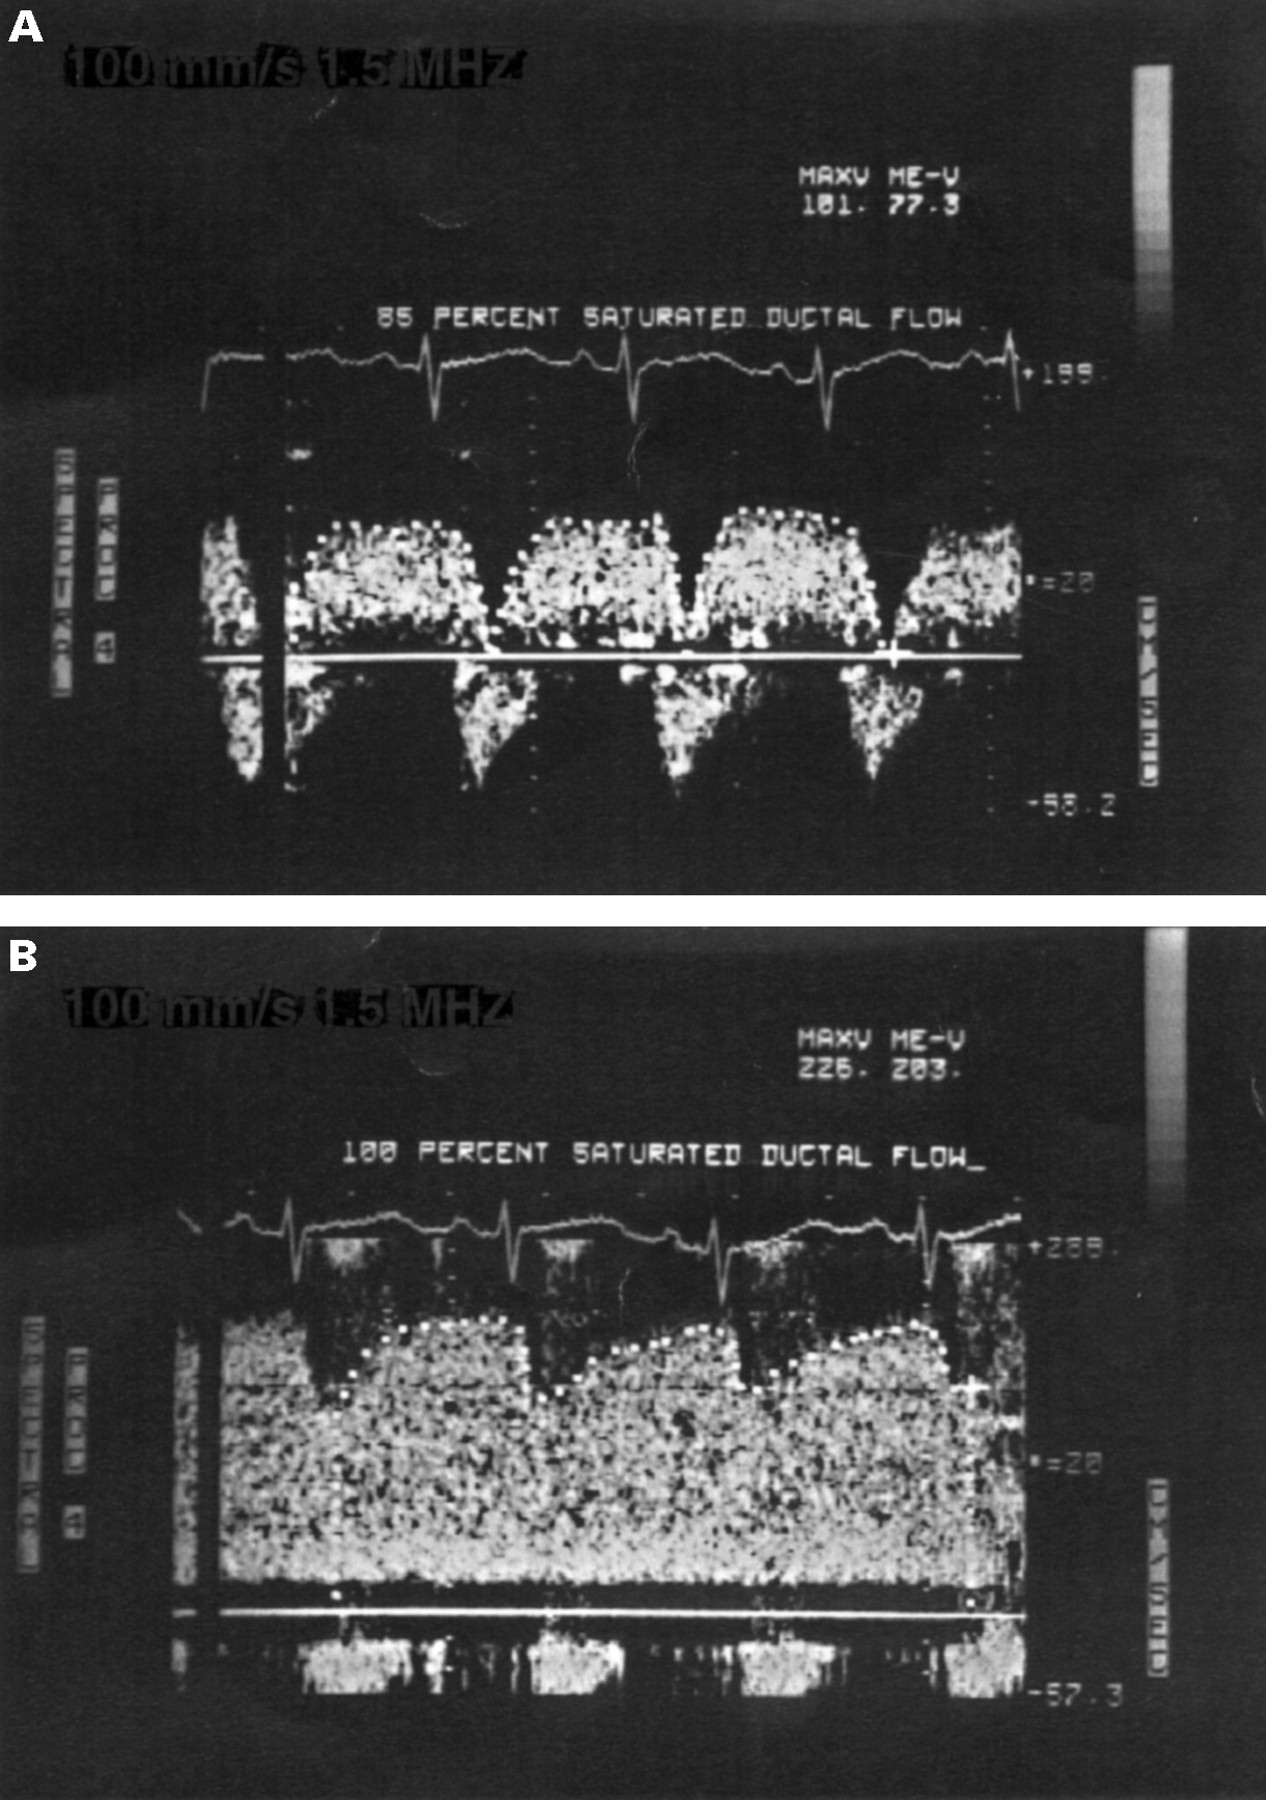
Change in ductal flow pattern in a 32 week gestational age infant with repiratory failure accompanying a rise in arterial oxygen saturation from 85% SaO2 to 100% SaO2 . Doppler traces are taken from case 13 (see tables 1 and2)t2. Left to right velocity is zero in systole at 85% SaO2 and peak left to right velocity (PDAmax) is 1.0 m/s. At 100% SaO2, the velocity in systole is over 1m/s and peak left to right velocity is 2.3 m/s, showing that pulmonary arterial pressure has fallen in relation to aortic pressure.

Serial changes in maximal left to right ductal flow velocity at each three stages of arterial oxygen saturation in preterm infants with respiratory failure and a patent arterial duct. Between 86% and 96% SaO2 the velocity increases marginally or stays the same in most subjects. Between 96% and 100% SaO2 rises in all but one subject (who already had a very high velocity), indicating a fall in pulmonary arterial pressure in relation to aortic pressure.
CHANGE BETWEEN 84–88% AND 95–97% SaO2
Three of the 15 babies (20%) included in this stage showed clear evidence of falling pulmonary arterial pressure (cases 4, 8, and 17). There were no significant changes in aortic or pulmonary stroke distance.
Fig 4 shows the small rise in peak left to right velocity of ductal flow seen in most of the infants, resulting in a small overall increase in paired values of 0.2m/s (1.20 to 1.40 m/s; p=0.007 by paired t test). However, the increase was only greater than one confidence step in two infants. The duct closed completely in one baby (case 14) and constricted one grade in another two (cases 8 and 12) associated with an increase in ductal flow velocity, and in case 12, with a rise in mean blood pressure (7 mm Hg).
CHANGE BETWEEN 95–97% AND 100% SaO2
Five of the 10 babies included in this stage showed evidence of a fall in pulmonary arterial pressure, and in two this fall was large (cases 12 and 13). When the modified Bernoulli equation was applied to the velocity of tricuspid regurgitation, the fall in right ventricle to right atrium pressure drop (and therefore the fall in systolic pulmonary arterial pressure) in these two babies was 12 mm Hg and 17 mm Hg, respectively. Left to right ductal flow velocity increased overall from a mean of 1.7 to 2.2m/s (p=0.01), but only four of the eight changed significantly (by more than one confidence step). One infant already had a high velocity (3.0 m/sec), signifying a low pulmonary arterial pressure, which did not fall further.
In one infant (15) TPV:RVET alone suggested a rise in pulmonary arterial pressure.
Ductal constriction was seen in four babies (cases 12,13,15,17), and this was associated with a marginal rise in mean blood pressure (4–6 mm Hg) in three and a significant fall in aortic stroke distance (2.2–3.1 cm) in three. Cases 7 and 18 also had a rise in blood pressure (5 and 8 mm Hg, respectively) without obvious ductal constriction.
CHANGE BETWEEN 84-88% AND 100% SaO2
Of the 11 babies who passed from the lowest saturation to the highest, eight experienced a fall in pulmonary arterial pressure. In general, all of the Doppler techniques were in agreement. The change in pattern and velocity of ductal flow was sometimes very striking (fig3). Case 18 had an increase in ductal flow velocity only which was associated with an increase in mean blood pressure of 7 mm Hg while both systolic time intervals were unchanged. This suggests that pulmonary arterial pressure was unchanged and the increased ductal flow velocity was due to increased blood pressure only. Pulmonary arterial pressure did not fall at all in two babies (cases 7 and 14); case 7 had very poor ventricular function (reflected in the low aortic and pulmonary stroke distances) and hyaline membrane disease complicated by pneumonia, while case 14 was the only baby not to have pulmonary hypertension at the beginning (the initial right ventricle to right atrium pressure drop was only 14 mm Hg).
Pulmonary stroke distance rose in only one baby (case 18) by one confident step, coinciding with a rise in blood pressure; effective systemic cardiac output had risen despite there being no evidence of ductal constriction.
Aortic stroke distance fell significantly in only one baby (case 12), by 3.7 cm (30%) associated with a significant rise in blood pressure (9 mmHg systolic and 13 mm Hg mean), again indicating a rise in effective systemic cardiac output. Between 96 and 100% SaO2, the aortic stroke distance had risen marginally in cases 15 and 17, but these babies had had a significant fall in stroke distance during ductal constriction between 86% and 96% saturation. Taking all of the studies together, an increase in SaO2caused unequivocal ductal constriction in six of the 15 infants with a patent arterial duct (40%), with complete closure in one of these.
Discussion
Most non-invasive studies of pulmonary arterial pressure in hyaline membrane disease have concentrated on only one echocardiographic technique. However, there may be merits in combining a number of techniques because each has its own advantages and disadvantages. The peak velocity of tricuspid regurgitation reflects systolic pulmonary arterial pressure,21 22 whereas flow velocity through the arterial duct is related to the balance of pulmonary and systemic arterial pressures throughout the cardiac cycle.19 21 27 The PEP:RVET ratio is probably most closely related to pulmonary vascular resistance or diastolic pulmonary arterial pressure, and also to right ventricular performance,15 16 while the TPV:RVET ratio is probably most closely related to systolic or mean pulmonary arterial pressure.17 18 The changes in ductal flow velocity were sometimes dramatic (fig 3 shows the change in ductal flow in a baby with alteration in SaO2 from 85% to 100%), and were qualitatively the most convincing evidence of haemodynamic change.
This study shows that these various techniques can be combined usefully in a serial study with the more reproducible measurement of tricuspid regurgitation, when the units of measurement are expressed in terms of confidence steps. Each step represents the coefficient of repeatability for that technique, or the change in measurement reaching the limits of observer, random, and temporal variability. There are other advantages to using confidence step analysis. Absolute values of systolic time intervals do not accurately reflect the same pulmonary arterial pressure in different children28 and several studies have shown that they cannot reliably differentiate children with pulmonary hypertension from those without.17 29 30Nevertheless, they may be useful in serial analysis within the same baby.4 31 The confidence steps of change can be used regardless of the particular relation of pulmonary arterial pressure to the time interval ratio in each baby.
The TPV:RVET ratio can be insensitive in the detection of oxygen induced pulmonary vasodilation in children with congenital heart disease and intracardiac shunts, but this does not necessarily imply that the ratio is of no value in children with structurally normal hearts, provided limits of repeatability are observed. However, in this study, two observed changes in the TPV:RVET ratio were against the trend of the other observations, suggesting observer error (case 15 at 96–100% and case 18 at 86–96%). Combining these two pieces of evidence, it would seem prudent not to rely on the TPV:RVET ratio alone in following changes in pulmonary arterial pressure in the individual—at least in those with a patent duct and therefore variable shunting, as in children with congenital heart disease.
Between 86% and 96% SaO2, pulmonary arterial pressure did not change significantly in most babies but ductal constriction occurred in three infants, one with an associated rise in blood pressure. Haemodynamic changes were more universal and more significant when oxygen saturations rose from 96 to 100%, and the overall effect of a change from 86 to 100% SaO2 was a fall in pulmonary arterial pressure in eight of the 11 babies studied. In this latter group some of the variation in response between babies will have been in part be due to differences in arterial pO2 at 100% SaO2, which can vary enormously. It would have been better to record arterial pO2 as well as SaO2. Nevertheless, the effect on pulmonary arterial pressure is clear, but what of the effect on pulmonary blood flow?
Oxygen can theoretically increase or decrease pulmonary blood flow in the presence of an arterial duct with a left to right shunt together with a moderately raised pulmonary vascular resistance, because ductal constriction decreases pulmonary flow, and increases it in pulmonary vasodilation increases it. The index of pulmonary blood flow in this study, aortic stroke distance, was therefore influenced by the net effect of these two opposing factors. The only detectable change in the present study was a fall in association with ductal constriction; increasing SaO2 had caused a decrease rather than an increase pulmonary blood flow. This suggests that ductal patency was a more important determinant of pulmonary flow than pulmonary vascular resistance in these babies. The reason for this may lie in the patient selection; all of the babies were clinically stable, did not have severe disease, and were receiving less than 65% inspired oxygen. The babies in whom aortic stroke distance fell also had relatively high starting values, suggesting that pulmonary arterial flow was not low in these babies, despite high pulmonary arterial pressures—a feature consistent with other echocardiographic studies of hyaline membrane disease.26 32
The haemodynamic changes were particularly striking given the short time periods over which SaO2 was altered. Further studies could examine the effect of altering arterial oxygenation over longer periods. Further studies would also be interesting in babies with more severe disease, but high pulmonary blood flow is usual in hyaline membrane disease and it is important to note that in three babies pulmonary arterial pressure fell significantly at the same time as pulmonary blood flow due to coincident ductal constriction reducing left to right shunting. In babies with severe hypoxaemia and raised pulmonary vascular resistance, we would expect a fall in pulmonary arterial pressure to be associated with a rise in pulmonary blood flow. An important message is that pulmonary arterial pressure (however it is measured) is not a reliable index of pulmonary blood flow in the presence of a patent duct.
An important variable not fully evaluated in this study is interatrial shunting. A patent foramen ovale is the norm in preterm infants and the pattern of interatrial flow is known to be influenced by changes in pulmonary vascular resistance. High SaO2 should reduce pulmonary vascular resistance and thereby encourage left to right interatrial flow. Visualisation of the septum involves subcostal scanning which tends to irritate preterm infants, which can lead to haemodynamic disturbance of itself. We therefore elected not to do this. However, the lack of change in pulmonary artery stroke distance in all but one infant during a rise in SaO2 indicates that right ventricular stroke volume did not increase as it would be expected to with increased left to right interatrial shunting. In those infants in whom there was a fall in left to right ductal flow due to ductal constriction (as testified by a fall in aortic stroke distance), pulmonary artery stroke distance did not rise. Therefore, total pulmonary blood flow fell in these infants during ductal constriction secondary to improved oxygenation and there was no apparent increase in left to right interatrial flow. This surprising observation may be related to the fact that the infants were recovering from their lung disease and were relatively mature. The picture may well be different in the first hours of life when pulmonary vascular resistance is especially high and in extreme prematurity where the foramen ovale tends to be very large.
There is continuing debate about the most appropriate arterial blood oxygen concentrations at which to nurse sick premature neonates, because of the potential complications of hyperoxia and hypoxia. However, the haemodynamic effects have received relatively little attention.
Longitudinal studies during hyaline membrane disease5 6failed to show a convincing link between pulmonary arterial pressure and arterial oxygenation. This is surprising because studies using direct measurement of pulmonary arterial pressure in healthy human infants have demonstrated that oxygen is a potent pulmonary vasodilator.8 11 Abman et al 33 measured pulmonary arterial pressure directly and Halliday et al 34 and Benetar et al 31 used serial systolic time interval ratios with increasing SaO2 in babies with bronchopulmonary dysplasia. They all showed a fall in pulmonary arterial pressure with increasing SaO2. It may be that it is only by such serial measurements within the same baby, rather than cross sectional studies, that the influence of SaO2 and FIO2 on vascular tone can be studied effectively. However, it is also important that in these babies with bronchopulmonary dysplasia the arterial duct was closed, so a fall in pulmonary vascular resistance will tend to be accompanied by a fall in pulmonary arterial pressure. The duct is usually open during the acute phase of hyaline membrane disease, such that pulmonary arterial pressure can remain unchanged with large changes in pulmonary vascular resistance due to a concomitant rise in pulmonary blood flow.
Roberton and Dahlenburg showed in 1969 that increasing inhaled ambient oxygen in infants with RDS could reduce right to left ductal shunting in some babies.35 On the other hand, a more recent study altered SaO2 from 91–94% to 95–98% in ventilated infants of 25 to 33 weeks gestation at a mean age of 42 hours36 and showed no change in left ventricular output or tissue oxygen delivery. We also found no change in left or right ventricular output between 86% and 96% SaO2 but did observe ductal constriction and a fall in pulmonary arterial pressure in some infants. Whether these effects may last over a longer period, or even be beneficial, remains unknown.
There is currently a good deal of interest in the haemodynamic effects of administering artificial surfactant.37 The results of this study remind researchers in this area to consider carefully the effects of SaO2 and FIO2 in each baby because observed haemodynamic changes resulting from surfactant instillation could be the result of altered oxygenation or ventilation rather than surfactant itself. Many units also adopt a protocol of hyperoxygenation before the administration of surfactant, for a similar period to that reported in this study. Furthermore, pulmonary blood flow must be assessed at the same time as pulmonary arterial pressure; in the presence of interatrial and ductal shunts a fall in pulmonary arterial pressure may not indicate a rise in pulmonary blood flow.
In summary, this study shows the important influence of inspired and arterial blood oxygen concentrations in sick premature neonates on ductal patency and pulmonary and systemic arterial pressure and flow, and has shown the potential use of “confidence steps”23 in haemodynamic assessment. It may be important that noticeable ductal constriction occurred in three of 12 infants with a patent arterial duct when SaO2 was changed within the relatively narrow limits of 86% and 96%, even though the saturation was changed for only 10 to 15 minutes. It is tempting to speculate that maintaining saturations at this level might reduce the number of preterm babies developing a large left to right shunt. However, the study has not established an “optimal” arterial oxygen saturation, because this is a complex issue involving more than just haemodynamics and ductal patency, and studies are needed over longer periods, and in babies with more severe lung disease. It is also important to remember that different oximeters vary in their relation to PaO2; an SaO2 value of 96% with the Nellcor corresponds to lower values (roughly 92%) with other commercially available machines.36 38 Moreover, most neonatal units would rely on both PaO2 and SaO2 concentrations to guide blood oxygenation, and infants less than 28 weeks gestation who are at greater risk of retinopathy39 were not included in this study. It is probably only through the process of a randomised controlled trial that the optimal levels of oxygenation can be established. However, most of the concepts surrounding “adequacy” of oxygenation revolve around providing sufficient oxygen delivery to the tissues and the shape of the oxygen dissociation curves. This study shows that airway and blood oxygen concentration may also have major haemodynamic effects which themselves influence oxygen uptake in the lungs and oxygen delivery to the tissues.
Acknowledgments
Dr Skinner was supported by the National Heart Research Fund (UK). Doppler machinery was in part funded by Children in Need (BBC, UK).