Article Text

Abstract
Objective The authors previously showed that 48% of infants <800 g were ventilated with tidal volume (VT) < dead space (DS) using volume guarantee (VG) ventilation. Here, The authors sought to confirm those findings under the rigorous conditions of a bench study.
Design and methods The authors measured the time to wash out CO2 from a 45-ml test lung using end-tidal CO2 monitor (ETCO2). The test lung was filled with 100% CO2, then ventilated using VG at VT ranging from DS+2 ml to DS–1.5 ml. With ventilation, ETCO2 declined exponentially as CO2 was washed out, the rate being proportional to VT – effective instrumental DS. The time from initiation of ventilation to threshold of accurate detection was determined in triplicate.
Results Halving the theoretical ‘alveolar ventilation’ (DS+2 ml to DS+1 ml) only increased the elimination time by 26%, not the 100%, as predicted by conventional physiology. CO2 washout was less efficient, but still occurred even at VT=DS and VT=DS–1.5 ml. Halving the theoretical ‘alveolar ventilation’ by decreasing respiratory rate from 80 to 40 breaths/min only increased elimination time by 35%, not 100%, as predicted by conventional physiology. Twenty minutes of continuous positive airway pressure prior to ventilation did not alter the elimination time, verifying that CO2 did not diffuse or leak out of the test lung. Size of the endotracheal tube (ETT; 2.5, 3.0 and 3.5 mm) flow rate (4, 6 and 10 l/min) and inspiratory time (0.25 vs 0.35 s) did not affect the results.
Conclusions Contrary to conventional physiology, effective CO2 elimination appears to be possible with VT<DS even at conventional rates. With small ETT a spike of fresh gas likely penetrates through the DS, rather than pushing it ahead.
Statistics from Altmetric.com
Volume-targeted ventilation (VTV) is increasingly used in extremely low birth weight (ELBW infants because of the potential for reducing volutrauma and avoiding hypocapnia. Volume guarantee (VG) is the most extensively studied of all the VTV modalities and has been shown to result in more stable tidal volume (VT), decreased hypocapnia and airleak, and lead to shorter duration of mechanical ventilation.1,–,6 With VG, the inspiratory pressure is automatically regulated by the ventilator microprocessor to deliver a target-exhaled VT despite changing lung mechanics and variable patient respiratory effort.7
Effective use of all forms of VTV requires knowledge of the appropriate tidal volume (VT) requirements for infants of different birth weights and with different lung diseases. In newborn infants, accurate VT measurement can only be achieved with a flow sensor placed at the proximal airway opening.8 ELBW infants, because of their small size, require very small tidal volumes, which are as low as 2–3 ml. This has led to concerns about the adverse effect of added instrumental dead space (IDS) of the flow sensor, which is about 0.9 ml and becomes proportionally larger in the smallest infants. Some clinicians elect to remove the flow sensor to avoid this problem, which will improve the effectiveness of CO2 elimination, but deprive the smallest, most vulnerable infants of the presumed and demonstrated benefits of synchronisation, VT measurement and VG.6 9,–,11
What is already known on this topic
▶ Anatomical dead space must be overcome before fresh gas enters the terminal air exchanging units.
▶ High-frequency ventilation produces alveolar ventilation with tidal volume near or below dead space.
▶ Empirical clinical observations suggest that effective alveolar ventilation may occur at or below the anatomical dead space even at conventional rates in small preterm infants.
What this study adds
▶ Effective ventilation of a test lung is possible with tidal volume below dead space at conventional respiratory rates.
▶ Conventional respiratory physiology does not adequately explain the clinical observations or experimental evidence when ventilating with small tidal volume and high flow velocity.
We recently have shown that normocapnic ELBW infants were often ventilated with VT at or below the estimated total (instrumental + anatomical) dead space (DS).12 A retrospective review of 344 paired observations of tidal volumes and arterial blood gases in 38 ELBW infants ventilated with VG during the first 48 h of life (mean birth weight 625±115 g) revealed that when Pco2 was within the target range (35–55 mm Hg), the mean VT was 3.11±0.64 ml and was ≤DS (estimated as 3.01 ml) in 48% of the observations. There was an inverse relationship between VT and birth weight, indicating that there was a significant impact of IDS, but its effect appeared to be modest and not sufficiently large to preclude the use of synchronised VTV.
This study was undertaken to seek substantiating evidence generated under carefully controlled circumstances of a bench study for our observational clinical findings, which suggested that effective alveolar ventilation can occur at conventional rates with VT close to or below DS volume when ventilating through narrow endotracheal tubes (ETT) with VT that is clinically relevant for ELBW infants.
Methods
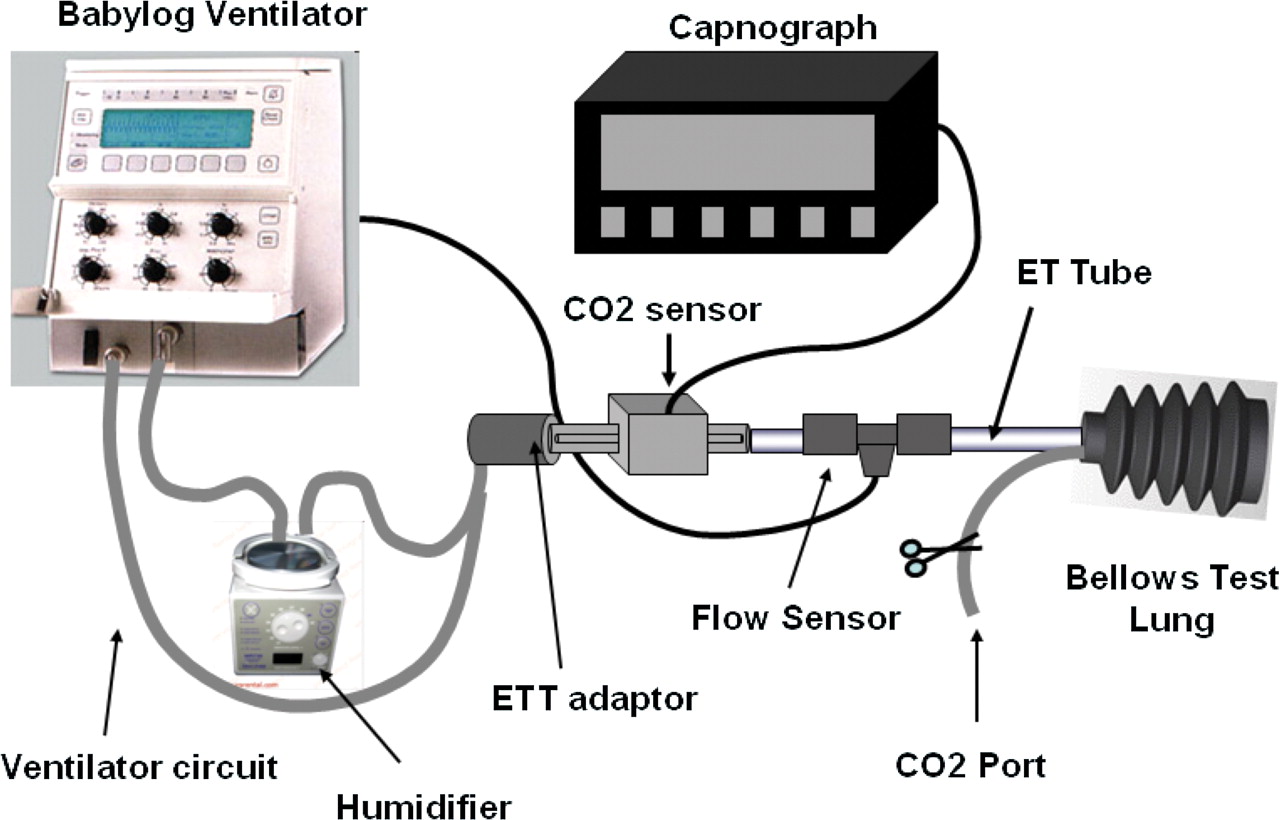
We used a Draeger Babylog 8000 plus continuous flow neonatal ventilator (Draeger Medical, Lubeck, Germany) with a standard Fisher Paykel ventilator circuit and humidifier (Fisher & Paykel, Auckland, New Zealand), a 45-ml silicone rubber bellows test lung (Ingmar Medical, Pittsburgh, Pennsylvania, USA) and a capnograph (CO2SMO Plus mainstream end tidal carbon dioxide (ETCO2) and Respiratory Monitor, Novametrix Medical Systems, Wallingford, Connecticut, USA) to detect the rate at which CO2 was eliminated from a test lung (figure 1). We devised a modification of a technique used previously to evaluate the effect of various configurations of flow sensors on the effectiveness of CO2 removal.13 The simple premise of our approach is that if the VT is insufficient to clear the DS, then no CO2 is washed out from the test lung and none is detected by the ETCO2 sensor. If the set VT clears the total DS of the apparatus, then CO2 will be detected by the ETCO2 monitor at the airway opening, initially at high concentration when the test lung is filled with pure CO2. Subsequently, the ETCO2 should decline in an exponential fashion as the CO2 concentration in the test lung decreases, and therefore less CO2 is cleared from the test lung with each inflation/deflation cycle. The time needed for the ETCO2 to drop below the threshold of detection reflects the amount of fresh gas that clears the DS and enters the test lung with each inflation at each of the VT settings. This would be the equivalent of effective alveolar minute ventilation in the clinical setting (figure 2).

Experimental setup.
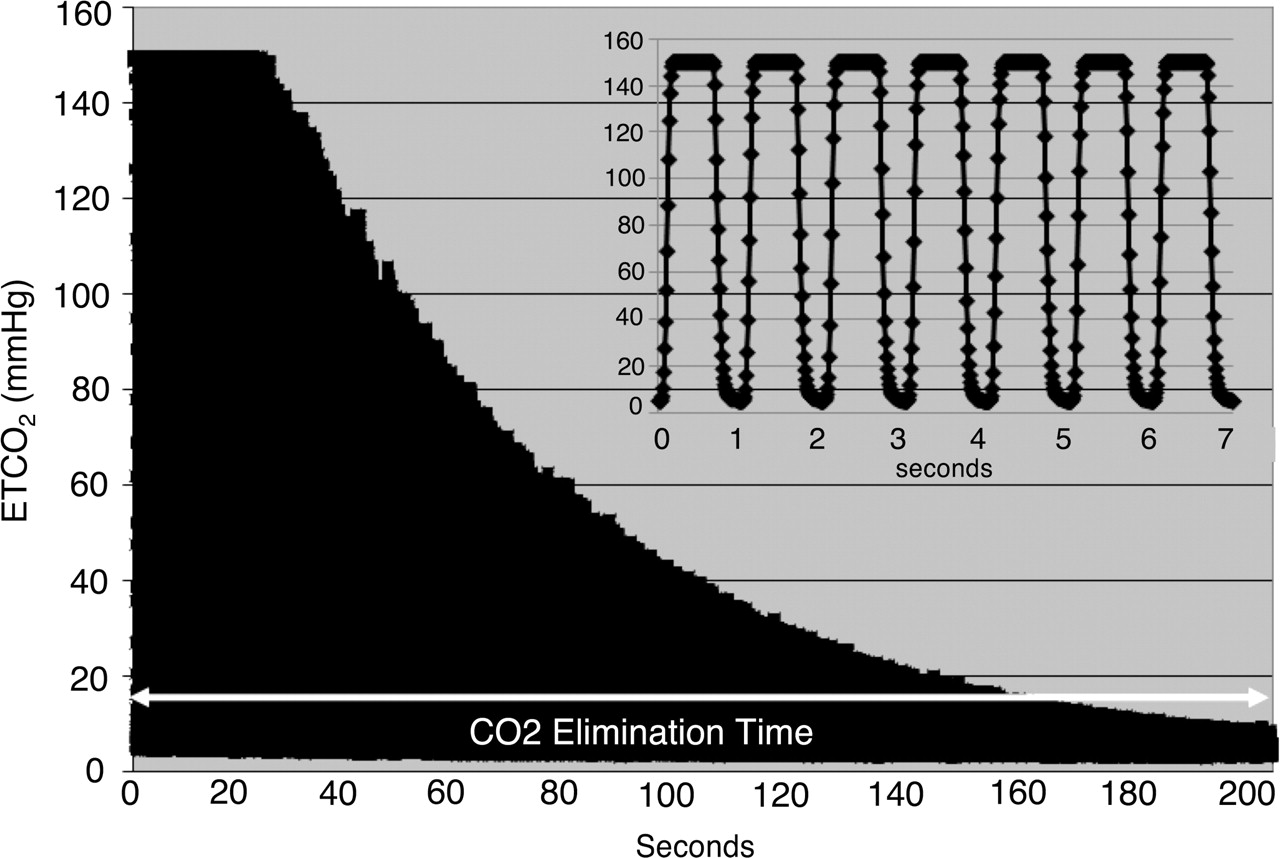
The insert in the figure shows the individual end tidal carbon dioxide (ETCO2) waveforms generated with each inflation. The larger panel represents a compressed waveform of a single trial (note the difference in time scale). The peak appears flattened as the upper limit of detection of the capnograph was 150 mm Hg, while the actual ETCO2 value should be close to 760 mm Hg at the onset of ventilation. An exponential drop in the CO2 was seen in all trials. Initially, at high CO2 concentrations, a larger amount of CO2 was eliminated with each breath and as the level of CO2 dropped, a progressively smaller quantity was removed, indicated by progressively lower end-tidal CO2 value. The elimination time is a reflection of the effective ‘alveolar ventilation’, as the initial CO2 concentration was the same.
The ventilator circuit was connected to the ETCO2 sensor which in turn was attached to one end of the Babylog flow sensor connected to a 2.5 mm-ETT cut to 10 cm length and inserted tightly into the opening of the test lung. The test lung connection had a side port that allowed filling of the test lung with pure CO2 prior to each test. Prior to each set of experiments, the flow sensor and ETCO2 monitor were calibrated according to manufacturers' instructions, and all connections were checked for leaks. The test lung was flushed with 100% CO2 for 2 min just prior to each trial to ensure that all other gases were washed out, and it was completely filled with pure CO2; the CO2 port was then clamped, and the test lung was carefully attached to the ventilator circuit taking care to minimise movement that might agitate the gas. The test lung was enclosed in an airtight plastic container to avoid inadvertent change in volume. The ETCO2 monitor was switched on and ventilation started with VG at a specific VT. Each set of experiments consisted of a series of trials at different tidal volume settings in random order with pressure limit set at 20 cm H2O, PEEP (positive end-expiratory pressure) of 5 cm H2O inflation time (TI) of 0.35 s, rate of 60 inflations/min and circuit flow rate of 6 l/min. We made sure that the target VT was delivered and increased the pressure limit as needed to deliver the set VT. The ETCO2 measurement was stopped when the ETCO2 reading was below 5 mm Hg or when the device stopped displaying values (typically below 6 mm Hg). The elimination time was determined from the digital data exported from the capnograph as the time from onset of ventilation to the point when the ETCO2 value dropped below 8 mm Hg for three consecutive breaths. This was an arbitrary cut-off point made necessary by the exponential decline nature of the CO2 elimination curve and the fact that the instrument begins to lose accuracy at very low CO2 levels and stops reporting values below about 6 mm Hg.
Each series was repeated in triplicate and with an ETT of 2.5-, 3.0- and 3.5-mm size. The total DS of the setup was measured in triplicate by filling the entire apparatus (CO2 sensor, flow sensor, connectors and ETT) with water from a 5-ml syringe and found to be 3.5 ml with the 2.5-mm ETT cut to 10 cm. The DS for 3.0-mm ETT cut to 10.5 cm was 3.7 ml, and for a 3.5 mm ETT cut to 11 cm it was 4 ml. The VT settings ranged from VT=DS+2 ml to DS–1.5 ml in 0.5- to 1-ml increments; for the 2.5-mm ETT, this corresponded to VT of 5.5, 4.5, 3.5, 3.0, 2.5 and 2 ml. To explore the possible role of variables other than VT on CO2 elimination, all studies were also repeated with inflation rate of 40, 60 and 80/min, circuit flow rate of 4, 6 or 8 l/min and TI of 0.25 and 0.35 s. Finally, to ensure that CO2 was not simply diffusing or leaking from the test lung, we connected the test lung to ET continuous positive airway pressure (CPAP) for 0, 5, 10 and 20 min prior to commencing ventilation at VT=DS–0.5 ml. The premise here is that with fixed minute ventilation, the time for CO2 removal would reflect the starting concentration of CO2 in the test lung. If substantial amount of CO2 escaped or diffused from the lung over time, the starting CO2 concentration would be lower as indicated by a shorter CO2 elimination time once ventilation was started. We used a VT below DS to have a longer elimination time and thus magnify any difference in starting CO2 concentration.
Statistical analysis
The digital data were exported from the capnograph using proprietary software (Analysis Plus for Windows, Novametrics Medical Systems, Wallingford, Connecticut, USA) to an Excel spreadsheet, graphed and visually inspected for consistency and to ensure that there were no evident distortions to the expected exponential decline. The start of ventilation and the end point of three consecutive ETCO2 values below 8 mm Hg were identified. The time difference between the two points was recorded and entered into a spreadsheet for subsequent analysis.
Data were analysed using Stat view version 4.5 and SuperAnova 1.11 (Abacus Concepts Inc, Berkeley, California, USA). Two-way analysis of variance for repeated measures and Bonferroni post-hoc testing were used to evaluate effect of different VT, ETT size and other ventilator variables. Curve-fitting regression was also applied to examine more closely the effect of DS on CO2 elimination time. Significance was accepted at p<0.05.
Results
The triplicate measurement of elimination times derived from the capnograph readings showed excellent reproducibility, being within 15% of each other in the vast majority of cases. As expected, the elimination time varied inversely with the tidal volume for each experimental condition, but the impact of IDS was less than that predicted by traditional physiology (figure 3). Reducing the VT from DS+2 ml to DS+1 ml should theoretically cut in half the amount of fresh gas reaching the test lung. However, we found that halving the theoretical ‘alveolar ventilation’ only increased the elimination time by 26%, not the 100%, as predicted by the standard alveolar ventilation equation. Effective CO2 elimination occurred even at VT below DS, albeit more slowly. These findings were not affected by inspiratory flow rate or TI (table 1). ETT size had a small but significant effect on elimination time with the 2.5 mm ETT having slightly longer elimination time. Curve-fitting revealed a quadratic relationship between VT and CO2 elimination time (2.5 mm ETT: r=0.99; p<0.001; 3.0 mm ETT: r=0.99; p<0.001: 3.5 mm ETT: r=0.98; p<0.001; figure 3).

Relationship between tidal volume and elimination time. The x-axis represents the volume above or below DS volume and the y-axis represents elimination time in seconds. The expected exponential relationship between decreasing tidal volume and decreased effective alveolar ventilation is evident (p<0.001), but alveolar ventilation is clearly occurring at tidal volume below DS. There was a small effect of endotracheal tube (ETT) size on effective alveolar ventilation as reflected by CO2 elimination time, but the curves paralleled each other, suggesting there is no fundamental difference between the ETT sizes tested.
Impact of inflation time (panel A) and circuit flow rate during inspiration (panel B) on the CO2 elimination time (in seconds)
The CO2 elimination time increased with decreasing inflation rate, but by a smaller amount than expected (figure 4). Halving the theoretical alveolar ventilation by decreasing rate from 80 to 40 inflations/min only increased the elimination time by 35%, not the 100%, as predicted by conventional physiology. The elimination time after 5, 10 and 20 min of CPAP were not significantly different from the baseline (no CPAP), indicating that there was minimal loss of CO2 from the test lung over up to 20 min of CPAP.

Effect of ventilator rate on CO2 elimination time. The increase in elimination time with halving of the ventilator rate is statistically significant (p<0.01), but is far less than the 100% predicted by traditional respiratory physiology. Please see text for suggested mechanism.
Discussion
Traditional physiology teaches that alveolar minute ventilation (MVAlv)=RR*alveolar VT (VTAlv). In turn, VTAlv=VT–DS. According to this formula, MVAlv is 0 when VT≤DS. It has been long recognised that high-frequency ventilation is capable of effective gas exchange at VT below anatomical DS,14 but this concept has not been extended to conventional ventilation. In this study, we have shown that, though less effective, ventilation with VT as much as 1.5 mL below DS still resulted in substantial CO2 elimination, indicating that there was a reasonable amount of effective ventilation of the test lung. This is a finding contrary to the teachings of traditional physiology, but entirely consistent with our previously published clinical data.12 Furthermore, the VT of 4.5–6 ml/kg documented in our clinical study was at least as large as that used in several other studies examining the effective VT during VTV,4 15,–,17 indicating that our clinical observations were accurate. This bench study confirms the validity of the empirically derived VT values from these publications and challenges the dogma of conventional respiratory physiology as applied to ELBW infants.
The traditional concept of DS assumes that there is little or no mixing of fresh and exhaled gas during the respiratory cycle. According to this theory, the CO2-rich exhaled gas present in the airways at the end of exhalation must re-enter the lungs before any fresh gas can enter the alveoli. This appears to be a good approximation of reality in large-framed subjects with relatively large diameter of upper airways and low gas-velocity profiles. However, there is some viscous drag along the periphery of the airway, resulting in a slightly parabolic shape of the boundary between fresh and exhaled gas.18 This parabolic shape becomes more pronounced at higher velocities. We speculate that this effect is greatly increased within the narrow ETT/airways and high gas-flow velocity in small preterm infants, resulting in the formation of a spike that penetrates through the DS gas, rather than pushing it ahead of itself (figure 5). We are not the first investigators to challenge the concept of fixed anatomical DS. Henderson et al. observed in 1915 that panting dogs appeared to be breathing effectively with VT substantially below their anatomical DS and conducted simple experiments to demonstrate that at high velocities fresh gas penetrates through the DS gas as a sharp spike down the centre of a glass tube.19 Comroe et al. showed in 1954 using a helium inhalation technique that with rapid shallow breathing, adult subjects could achieve some degree of alveolar ventilation with VT as small as 60 ml, a fraction of an adult anatomical DS.20

Postulated mechanism of alveolar ventilation at tidal volumes below DS volume.
Alternately, the increased mixing implied by our observations could be explained by very turbulent flow in the large airways, as suggested by Eriksson to explain similar observations made regarding high-frequency positive-pressure ventilation in adult patients.21 Both mechanisms are consistent with the observed effect of respiratory rate on CO2 elimination time. As noted above, the impact of ventilator rate on the CO2 elimination time was also less than the predicted from the standard equation for minute ventilation: MV=RR*VT. We speculate that the longer expiratory time with the slower rate allows for more radial diffusion either alone or mixing, thereby mitigating the effect of the lower total minute ventilation.
Our study has some important limitations. We used a novel approach to determining the alveolar minute ventilation, which relies on ETCO2 measurement. Although this exact technique has not been previously validated, it is based on simple physical principles, the readings showed excellent reproducibility and were generally consistent with the known laws of physics. We used a test lung which is inherently different from a biological lung. There is no CO2 produced in the test lung, although this is not an issue with the experimental procedure we developed. The biological lung is subject to heterogeneity of gas distribution, which can result in wasted ventilation and increase the physiological DS. Arguably, the absence of alterations in physiological DS is an advantage, rather than a limitation. The test lung is a passive container, not engaged in gas exchange or the variable breathing patterns that are seen in preterm infants. Although this can be considered a limitation, it also represents strength by eliminating these variables that may obscure the effect of VT on CO2 removal. We did not examine a wide range of ETT sizes to determine whether there is an important effect of airway diameter as with substantially larger conduits. We chose to limit our studies to sizes that are relevant to neonates. Thus, we are not able to directly compare our findings with some of the earlier studies that challenged the concept of fixed DS in large subjects or to determine if this phenomenon occurs with larger ETT sizes.
Conclusion
We have demonstrated in a laboratory study with a test lung that adequate ventilation may be achieved with VT substantially below the total DS volume under a range of ETT sizes, circuit gas flows and inflation times. These findings have important implications for guiding appropriate selection of tidal volumes. Although these bench study values cannot necessarily be directly extrapolated to the clinical setting, the findings are consistent with our previously published clinical data.11 This information supports the feasibility and continued use of tidal volume measurement, targeting and synchronisation with a proximal airway flow sensor even in ELBW infants.
Acknowledgments
The authors thank Ms Cynthia Cox for performing the statistical analysis.
References
Footnotes
-
Competing interests Dr M. Keszler has been a consultant to Draeger Medical, the manufacturer of the device used in these studies. The device is not the focus of the study. Dr Keszler does not have any equity interest in the company and no one related to the company has had any input into the design, execution or reporting of the study. No financial or in-kind support was provided by Draeger Medical for this study.
-
Contributors The authors are responsible for the reported research and have participated in the concept, design; analysis and interpretation of data; drafting of the manuscript and have approved the manuscript as submitted.
-
Provenance and peer review Not commissioned; externally peer reviewed.