

Abstract
BACKGROUND: The arterial partial pressure of CO2 (PaCO2) can be grossly estimated by the end-tidal partial pressure of CO2 (PETCO2). This principle is used in SmartCare (Dräger, Lübeck, Germany), which is an automated closed-loop system that uses PETCO2 to estimate alveolar ventilation during mechanical ventilation.
OBJECTIVE: To assess whether the maximum PETCO2 value (instead of the averaged PETCO2 value) over 2-min or 5-min periods improves PaCO2 estimation, and determine the consequences for the SmartCare system.
METHODS: We continuously monitored breath-by-breath PETCO2 during ventilation with SmartCare in 36 patients mechanically ventilated for various disorders, including 14 patients with COPD. Data were collected simultaneously from SmartCare recordings, every 2 min or 5 min, and through a dedicated software that recorded ventilation data every 10 s. We compared the maximum and averaged PETCO2 values over 2-min and 5-min periods to the PaCO2 measured from 80 arterial blood samples clinically indicated in 26 patients. We also compared SmartCare's classifications of patient ventilatory status based on averaged PETCO2 values to what the classifications would have been with the maximum PETCO2 values.
RESULTS: Mean PaCO2 was 44 ± 11 mm Hg. PaCO2 was higher than averaged PETCO2 by 10 ± 6 mm Hg, and this difference was reduced to 6 ± 6 mm Hg with maximum PETCO2. The results were similar whether patients had COPD or not. Very few aberrant values (< 0.01%) needed to be discarded. Among the 3,137 classifications made by the SmartCare system, 1.6% were changed by using the maximum PETCO2 value instead of the averaged PETCO2 value.
CONCLUSIONS: Use of maximum PETCO2 reduces the difference between PaCO2 and PETCO2 and improves SmartCare's classification of patient ventilatory status.
Introduction
Monitoring of end-tidal partial pressure of CO2 (PETCO2) has applications in emergency medicine, anesthesia, and intensive care.1,2 Although PETCO2 does not perfectly reflect arterial CO2 measured from an arterial blood sample (PaCO2),3,4 capnometry allows continuous monitoring of alveolar ventilation in intubated patients. The SmartCare automated ventilation and weaning system (Dräger, Lübeck, Germany) uses PETCO2 as a safety parameter, in addition to respiratory rate and tidal volume (VT), to automatically control the pressure-support level.5,6 SmartCare averages PETCO2, respiratory rate, and VT over 2-min or 5-min periods, classifies the patient's ventilatory status, and adjusts the pressure-support level accordingly. PETCO2 is not a main control parameter in SmartCare, but can be used in situations such as a low respiratory rate to help differentiate between, for instance, central hypoventilation leading to hypercapnia versus hyperventilation with hypocapnia. PETCO2 is known to frequently underestimate PaCO2 because of ventilation-perfusion mismatching and dead-space effect.7,8 A spontaneously breathing patient may intermittently have higher PETCO2 values than the averaged value during prolonged exhalations.9 Such a value may better reflect alveolar PCO2 and may thus be closer to PaCO2. We assessed the use of the maximum PETCO2 value instead of the averaged PETCO2 value over 2 min or 5 min. On the one hand, this could improve the accuracy of PETCO2 as a proxy for PaCO2, and on the other hand it could improve SmartCare's classifications of the patient's ventilatory status by using a more reliable PETCO2 value.
Methods
This study was purely observational, and the protocol was approved by the ethics committee of Erasme Hospital, Brussels, Belgium. The study was performed in the Erasme Hospital and Henri Mondor Hospital intensive care units.
Patients
The main inclusion criteria were hemodynamic stability, acceptable neurological status (Glasgow coma score ≥ 8), PEEP not higher than 10 cm H2O, and pressure-support ventilation with pressure support of ≤ 20 cm H2O. Patients were excluded if a clinical procedure was going to be performed within the next few hours.
Data Collection
Arterial blood samples were drawn for clinical indications and analyzed (ABL700, Radiometer, Copenhagen, Denmark, and GEM Premier 4000, Instrumentation Laboratory, Lexington, Kentucky) within a few minutes. Patients were ventilated with an Evita XL ventilator (Dräger, Lübeck, Germany) provided with the SmartCare system and an infrared PETCO2 mainstream sensor (product number 6871500, Dräger, Lübeck, Germany) connected to a CO2 cuvette for measurement. During pressure-support ventilation with SmartCare, a dedicated software (VentView, Dräger, Lübeck, Germany) recorded ventilatory data, including PETCO2, every 10 s. SmartCare averages PETCO2 values over 2 min or 5 min to classify the patient's ventilatory status, and we downloaded these data from the ventilator to the computer.
Procedure
SmartCare averages respiratory rate, VT, and PETCO2 over 2 min or 5 min, from values taken at a sampling period of 10 s. The VentView software records the respiratory data at the same sampling period. Recorded data correspond to the last breath of each 10-s data period. In a preliminary study, we compared VentView's PETCO2 data averaged along SmartCare periods to SmartCare's own data, and the difference between VentView and SmartCare's averaged data was always less than 0.5 mm Hg. For each considered period, the averaged and maximum PETCO2 were thus determined from the VentView data. Our study of PaCO2, PETCO2, and SmartCare concerned 80 SmartCare periods of 2 min or 5 min, during which we took arterial blood samples. We compared SmartCare's classifications to the maximum PETCO2 values instead of the averaged PETCO2 values.
Statistics
We analyzed the relationship between PaCO2 and the averaged and maximum PETCO2 with linear regression. We used the Pearson test to evaluate the correlation. Quantitative data are expressed as mean ± SD or median and interquartile range.
Results
The sample consisted of 36 mechanically ventilated patients, between March 2006 and July 2007. There were 14 females and 22 males, with a mean age of 63 ± 14 y. The patients' respiratory mechanics, as determined by the ventilator, were: dynamic compliance 44 mL/cm H2O (IQR 31–63 mL/cm H2O) and resistance 10 cm H2O/L/s (IQR 7–13 cm H2O/L/s). At inclusion, the mean PEEP was 5 (IQR 5–8) cm H2O, the mean pressure-support level was 14 cm H2O (IQR 12–16 cm H2O), and the mean FIO2 was 0.40 (IQR 0.31–0.4). Fourteen patients had COPD. Three patients were tracheotomized; the others were orotracheally intubated. All ventilation was with a heated humidifier.
The mean duration of ventilation recordings with SmartCare was 3 hours 36 min per patient (IQR 3 hours 9 min to 4 hours 57 min). Of the 36 subjects, 26 had arterial blood gas measurements contemporaneous with the VentView and SmartCare data.
Relationship Between PETCO2 and PaCO2
We analyzed 80 pairs of PETCO2 and PaCO2 values from 26 patients. The mean ± SD number of arterial blood gas measurements was 3 ± 1 per patient. Mean PaCO2 was 44 ± 11 mm Hg.
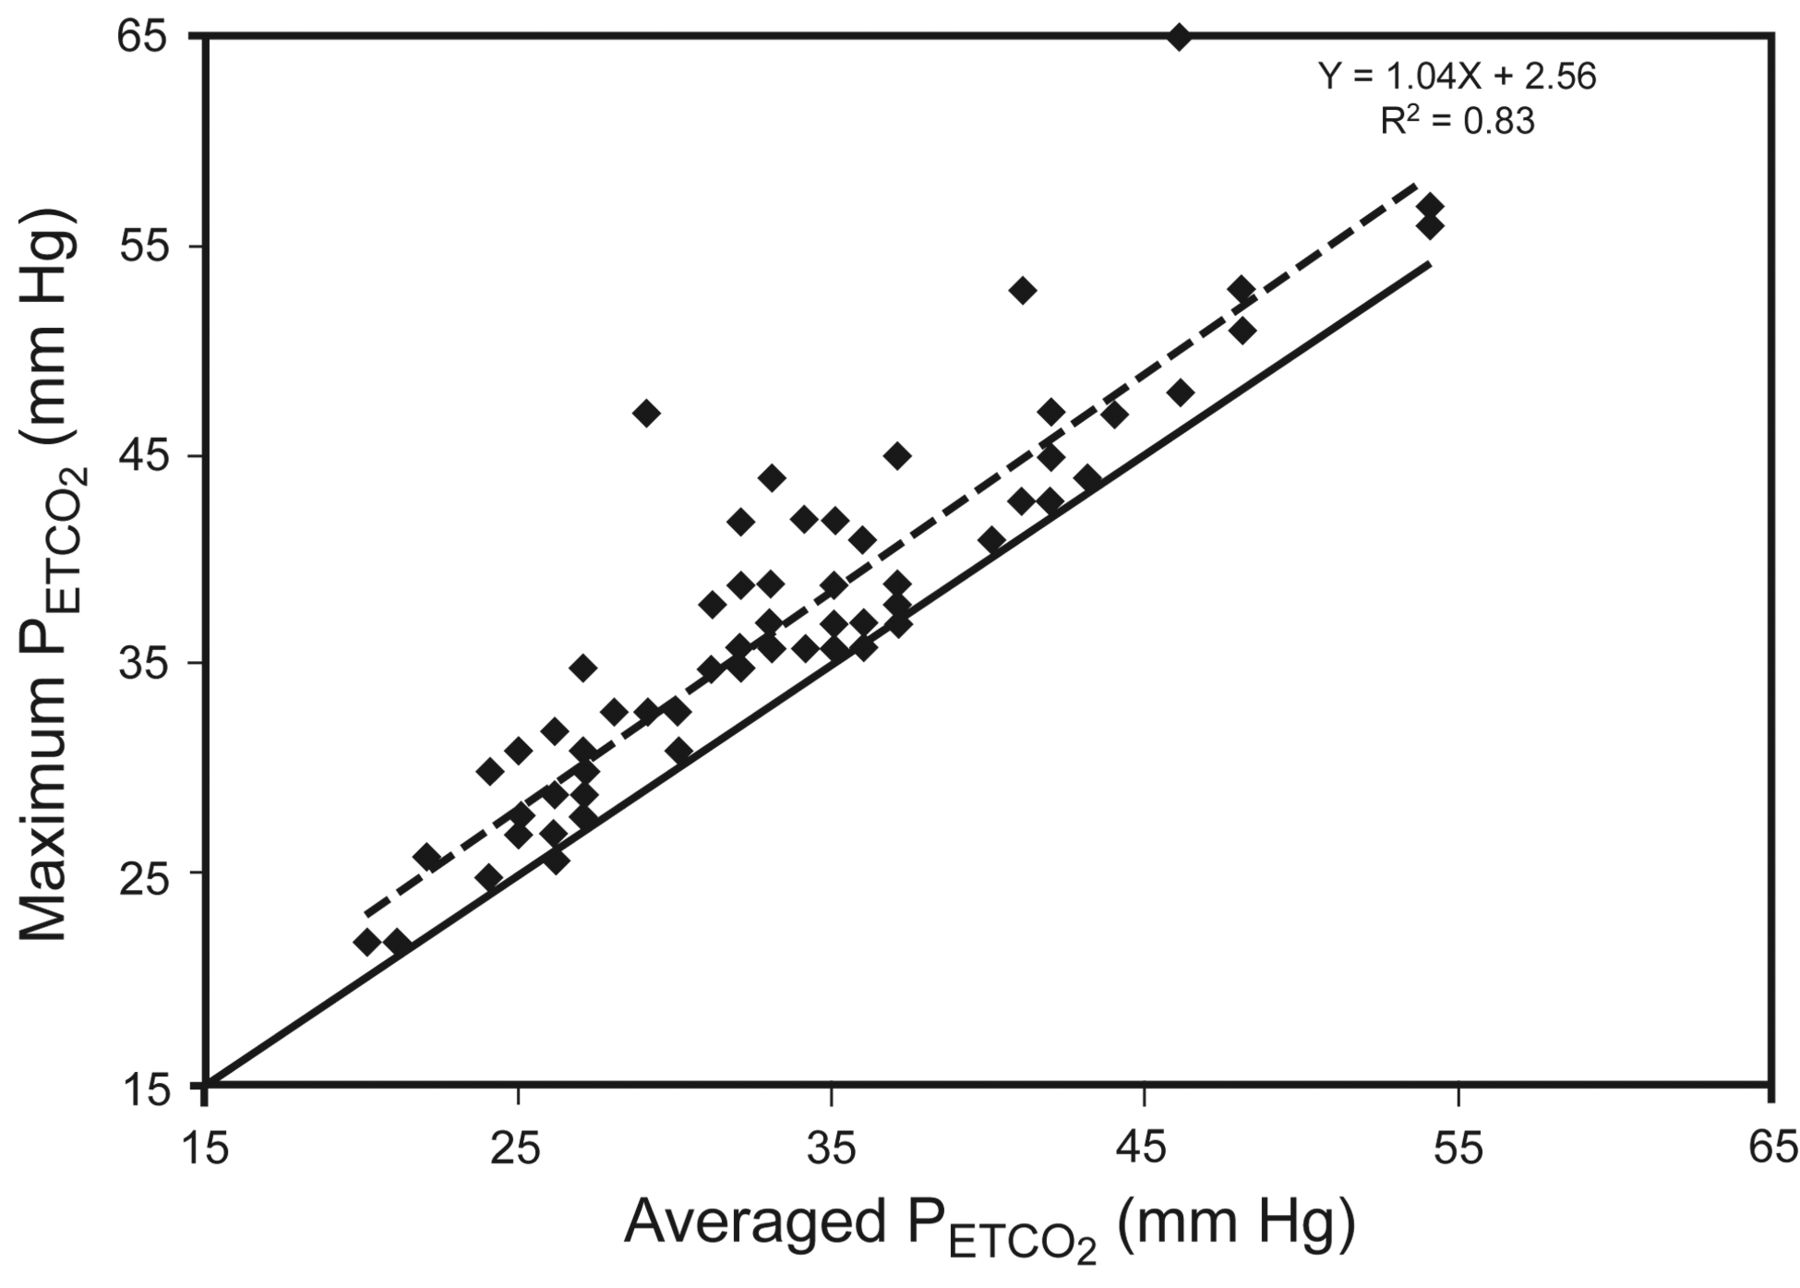
Table 1 shows the differences between the averaged and maximum PETCO2 and PaCO2 values. The pairs of values were obtained during 49 2-min SmartCare periods and 31 5-min SmartCare periods. PaCO2 was higher than averaged PETCO2 by 10 ± 6 mm Hg. Taking the maximum instead of the averaged PETCO2 value reduced the difference with PaCO2 by 4 mm Hg. Figure 1 shows the linear regression of the averaged and the maximum PETCO2 against the PaCO2 values. The coefficient of regression was closer to identity with the maximum PETCO2 values. Figure 2 plots the maximum PETCO2 against the averaged PETCO2.
Difference Between Averaged and Maximum PETCO2 and PaCO2 During Ventilation With SmartCare*

Linear regression analysis of 80 pairs of maximum (dashed line) and averaged (solid line) end-tidal partial pressure of carbon dioxide (PETCO2) and PaCO2 values, from 26 patients.

Linear regression analysis of maximum end-tidal partial pressure of carbon dioxide (PETCO2) versus averaged PETCO2. The solid line is the identity line. The dashed line is the regression line.
Relationship Between PETCO2 and PaCO2 Relative to COPD
There were 44 values from the 14 COPD patients and 36 values from 12 the non-COPD patients (Table 2). The results were similar whether patients had COPD or not.
PETCO2 and PaCO2 in COPD Versus Non-COPD Patients During Ventilation With SmartCare
Exclusion of PETCO2 Aberrant Values
We defined an aberrant value as a contextually non-physiologic high PETCO2 value. Aberrant values, measured via CO2 infrared sensor, may be due to moisture, water, or dirt on the sensor. Because using one single maximum PETCO2 value instead of averaged PETCO2 values ran the risk of using aberrant values, when the difference between 2 consecutive values (separated by 10 s) was more than 40 mm Hg, the latter value was considered aberrant. We found 32 aberrant values (in the 74,777 total measurements), which came from 6 patients. Four patients had only one aberrant value, one patient had 21 aberrant values, and one patient had 7 aberrant values. The rate of aberrant values was 0.04%. We discarded all aberrant values.
SmartCare Classification
The classification of ventilation made by SmartCare for every recording using the averaged PETCO2 and the maximum PETCO2 values among the 3,137 SmartCare classifications for the 36 patients differed only for 49 classifications (1.6%), in 9 patients. For the pairs of data related to these classifications, the difference between maximum and averaged PETCO2 was 16 ± 9 mm Hg, with a median of 13 mm Hg (IQR 13–20 mm Hg).
Discussion
The maximum PETCO2 value was on average 4 mm Hg closer to PaCO2 than the averaged PETCO2. Linear regression between PETCO2 and PaCO2 was closer to the identity line with maximum PETCO2. The use of maximum PETCO2 infrequently changed the classification determined by SmartCare.
Relationship Between PETCO2 and PaCO2
PETCO2 is supposed to represent alveolar PCO2 (PACO2), which is determined by the speeds at which CO2 is filling alveoli and being emptied from alveoli. The PACO2 depends on CO2 production by tissues and venous blood flow content. CO2 exhalation from alveoli depends on alveolar ventilation. If the alveolar ventilation-perfusion ratio (V̇/Q̇) is low, the PACO2 will be close to venous pressure. If this ratio is normal, the PACO2 will be close to PaCO2. If V̇/Q̇ is high, the PACO2 will be closer to the inspired CO2.7 So PaCO2 tends to be higher than PACO2, mainly because of ventilation-perfusion discrepancies. PACO2 and PETCO2 can thus be different, owing to the patient's ventilation and pulmonary condition (eg, restrictive or obstructive lung disease). Allowing a prolonged or complete exhalation (compared to a normal breath) could increase PETCO2.10 A longer exhalation may therefore better reflect PACO2 among spontaneous breaths. We inferred that the use of maximum PETCO2 during periods of 2 min or 5 min, as determined by the SmartCare system for averaging its parameters, could be a better indicator of alveolar ventilation than the averaged PETCO2 during the same period.
We measured averaged PETCO2, maximum PETCO2, and PaCO2 contemporaneously. Table 1 shows that the difference between averaged PETCO2 and PaCO2 was around 10 mm Hg, a value reported in several previous studies.11–14 Our maximum PETCO2 values were closer to PaCO2 by about 4 mm Hg, compared to the averaged PETCO2. The maximum PETCO2 had a higher correlation coefficient (r = 0.65 vs 0.57) in all periods (see Fig. 1), which indicates that maximum PETCO2 better approximates PaCO2 than does averaged PETCO2.
Maximum PETCO2 was also found more accurate by Weinger et al.9 They recorded PaCO2 and PETCO2 in 25 patients after cardiotomy and being weaned with intermittent mandatory ventilation. PETCO2 varied widely from breath to breath, and two thirds of the time the PETCO2 of spontaneous breaths was greater than that of ventilator breaths. Maximum PETCO2 was the most accurate indicator of PaCO2 (r = 0.77, P < .001), and the arterial-to-end-tidal difference was 4 ± 4 mm Hg (P < .01).
Chopin et al10 also found a larger difference between maximum PETCO2 and PaCO2 in patients with pulmonary embolism (12 mm Hg) versus patients without (1 mm Hg). They used a prolonged passive exhalation until maximum PETCO2 was reached and found those values much closer to PaCO2.
Lujan et al14 studied 120 non-ventilated patients and control subjects, classified in 4 equal groups according to COPD severity. With each subject, arterial blood was sampled, then the subject was asked to breath normally through a mouthpiece attached to a sidestream capnograph, and then to produce 3 maximal exhalations of at least 5 s each. For the entire cohort they found a better Pearson correlation between PaCO2 and PETCO2 with maximal exhalation (r = 0.88, P < .001) than with PETCO2 during normal tidal breathing (r = 0.72, P < .01). However, they also found that PETCO2 during maximal expiration tended to overestimate PaCO2. In our study we found a similar alveolar-versus-end-tidal CO2 difference (−2 mm Hg, interquartile range–3 to −1 mm Hg) in only 6 of the 80 pairs of maximum PETCO2 and PaCO2 values. However, for the whole data the mean difference was positive (6 ± 6 mm Hg). The difference with Lujan's study,14 which often found an overestimation of PaCO2, may be due to the long duration of maximal exhalation maneuvers (at least 5 s), while it was only spontaneous exhalations in our study.
PETCO2 and PaCO2 Relative to COPD
PETCO2 can be a poor proxy for PaCO2 in patients with parenchymal lung disease or emphysema undergoing weaning from mechanical ventilation.15 In our clinical study we observed (see Table 2) a similar difference (4 mm Hg) between the maximum and averaged PETCO2 in COPD and non-COPD patients. In the non-COPD patients, however, there was a higher correlation coefficient between PaCO2 and maximum PETCO2 (r = 0.77 versus r = 0.81), whereas the correlation coefficient was not different (r = 0.8) in the COPD patients. In both the COPD and non-COPD patients the difference between PETCO2 and PaCO2 was similarly smaller with the maximum PETCO2.
We did not measure intrinsic PEEP, which can influence the difference between PaCO2 and PETCO2. Blanch et al16 addressed this issue in 24 paralyzed and sedated patients on volume-controlled ventilation. They partitioned their population into 2 groups, according to the presence of intrinsic PEEP (13 patients) or not (11 patients). They found a higher PaCO2-PETCO2 difference in the intrinsic PEEP group and a better correlation of PETCO2 with PaCO2 in patients without intrinsic PEEP.
SmartCare and PETCO2
SmartCare uses PETCO2 as a security threshold to delimit the zone of respiratory comfort (Table 3) and in the algorithm by which it classifies the patient's ventilatory status.17–19 High PETCO2 (> 65 mm Hg for COPD, > 55 mm Hg for non-COPD), respiratory rate, and VT cause SmartCare to classify the ventilation period into a diagnosis such as central hypoventilation, hyperventilation, or insufficient ventilation. Low PETCO2 (< 20 mm Hg) is also used to classify unexplained hyperventilation, defined by a high respiratory rate and normal VT unresponsive to changes in pressure level.19 In SmartCare the use of maximum PETCO2 would better classify the patient's ventilatory status in a very small but potentially important number of cases. Indeed, SmartCare uses different safety thresholds (depending on the presence of chronic CO2 retention, as indicated by the user) to detect central hypoventilation, defined as a low respiratory rate and a high PETCO2, or insufficient ventilation, as a low VT and a high PETCO2. These are rare situations but need to be recognized. If PETCO2 markedly underestimates PaCO2, the diagnosis will occur late (ie, with a very high PaCO2 value). If at least one PETCO2 value during a 2-min or 5-min period is above a PETCO2 threshold, it would change SmartCare's ventilatory status classification. Using the maximum PETCO2 would make SmartCare more sensitive to higher CO2 values, which might result in better classification. It could also offer more stability in situations where there is alternation between pathological and non-pathological classifications, because abnormal ventilation would be diagnosed earlier. The use of maximum PETCO2 would increase the classifications of hypoventilation and insufficient ventilation, leading SmartCare to increase pressure support or to alarm. The use of maximum PETCO2 would have changed 1.6% of the classifications in our patients. There were 28 changes from normal ventilation to insufficient ventilation, which represents 57% of the overall changes in classification. In this study, however, the classification changes were retrospective and did not affect our care decisions.
SmartCare's Classification of Ventilation Periods*
Conclusions
Currently, PETCO2 measurement via infrared sensor usually underestimates PaCO2. Maximum PETCO2 seems to be closer to alveolar CO2 than averaged PETCO2. Use of maximum PETCO2 could improve the accuracy and efficiency of SmartCare without being harmful to the patient.
Footnotes
- Correspondence: Laurent J Brochard MD, Intensive Care Unit, Geneva University Hospital, 1211 Geneva 14, Switzerland. E-mail: laurent.brochard{at}hcuge.ch.
-
Dr Brochard has disclosed a relationship with Dräger. Fabrice Galia was partly supported by a grant from Conventions Industrielles de Formation par la Recherche (CIFRE), which is supported by the French Ministry of Industry and Dräger.
-
Fabrice Galia presented a version of this paper at the 21st Congress of the European Society of Intensive Care Medicine, held September 21–24, 2008, in Lisbon, Portugal.
-
See the Related Editorial on Page 362
- Copyright © 2011 by Daedalus Enterprises Inc.


