

Abstract
BACKGROUND: A recent trial showed that setting PEEP according to end-expiratory transpulmonary pressure (Ppl,ee) in acute lung injury/acute respiratory distress syndrome (ALI/ARDS) might improve patient outcome. Ppl,ee was obtained by subtracting the absolute value of esophageal pressure (Pes) from airway pressure an invariant value of 5 cm H2O. The goal of the present study was to compare 2 methods for correcting absolute Pes values in terms of resulting Ppl,ee and recommended PEEP.
METHODS: Measurements collected prospectively from 42 subjects with various forms of acute hypoxemic respiratory failure receiving mechanical ventilation in ICU were analyzed. Pes was measured at PEEP (Pes,ee) and at relaxation volume of the respiratory system Vr (Pes,Vr), obtained by allowing the subject to exhale into the atmosphere (zero PEEP). Two methods for correcting Pes were compared: Talmor method (Ppl,ee,Talmor = Pes,ee – 5 cm H2O), and Vr method (Pes,ee,Vr = Pes,ee – Pes,Vr). The rationale was that Pes,Vr was a more physiologically based correction factor than an invariant value of 5 cm H2O applied to all subjects.
RESULTS: Over the 42 subjects, median and interquartile range of Pes,ee and Pes,Vr were 11 (7–14) cm H2O and 8 (4–11) cm H2O, respectively. Ppl,ee,Talmor was 6 (1–8) cm H2O, and Pes,ee,Vr was 2 (1–5) cm H2O (P = .008). Two groups of subjects were defined, based on the difference between the 2 corrected values. In 28 subjects Ppl,ee,Talmor was ≥ Pes,ee,Vr (7 [5–9] cm H2O vs 2 [1–5] cm H2O, respectively), while in 14 subjects Pes,ee,Vr was > Ppl,ee,Talmor (2 [0–4] cm H2O vs −1 [−3 to 2] cm H2O, respectively). Ppl,ee,Vr was significantly greater than Ppl,ee,Talmor (7 [5–11] cm H2O vs 5 [2–7] cm H2O) in the former, and significantly lower in the latter (1 [−2 to 6] cm H2O vs 6 [4–9] cm H2O).
CONCLUSIONS: Referring absolute Pes values to Vr rather than to an invariant value would be better adapted to a patient's physiological background. Further studies are required to determine whether this correction method might improve patient outcome.
Introduction
Loring et al1 assessed transpulmonary pressure (PL) using absolute values of esophageal pressure (Pes) minored by an invariant value of 5 cm H2O, in order to take into account the ventral-to-dorsal pleural pressure gradient across the thorax height, the weight of the mediastinum, and the pressure within the balloon.2 Indeed, in patients with acute lung injury (ALI)/acute respiratory distress syndrome (ARDS) receiving invasive mechanical ventilation in the supine position in the ICU, the absolute values of Pes at end-expiration (Pes,ee) are high.2 Since PL is computed as the difference between the pressure at the airway opening (Pao) and Pes, some marked negative PL values are obtained. In this context, a trial was carried out3 comparing PEEP set in order to reach at least 0 cm H2O end-expiratory PL (PL,ee) to PEEP set according to a PEEP-FIO2 table.4 This trial found some beneficial physiological effects and a trend toward improved patient survival. This approach for PEEP selection is clever, pragmatic, and feasible for bedside implementation. However, several assumptions need to be validated.5 In particular, the assumption that the systematic subtraction of an invariant value of 5 cm H2O bias can be used for all patients. Furthermore, other factors for correcting absolute Pes values have previously been used in mechanically ventilated acutely ill patients, such as an invariant value of 2.5 cm H2O,6 or the Pes value obtained at the relaxation volume of the respiratory system (Vr).7,8 These latter studies used Pes at Vr due to intrinsic PEEP concern, whereas it is a less important factor in ALI/ARDS. However, reports indicated that intrinsic PEEP is frequent in this setting9 for physiological reasons and also as a result from high breathing rate set at the ventilator to maintain minute-ventilation facing low tidal volume.10 The goal of the present study was to compare 2 methods for correcting absolute Pes,ee values: the subtraction of an invariant 5 cm H2O value (Talmor method), and the subtraction of Pes measured at Vr (Pes,Vr) (Vr method). Our aim was to compare these 2 methods in terms of resulting PL,ee and recommended PEEP. Our hypothesis was that the Vr method allows for a more physiological correction regarding absolute Pes and copes better with the individual mechanical properties of the respiratory system than the Talmor method. If this is true, then the Pes,ee to which an invariant value of 5 cm H2O is subtracted to compute the average pleural pressure (Ppl,ee,Talmor) and the Pes,ee from which Pes,Vr was subtracted (Pes,ee,Vr) should be different across all patients. The null hypothesis of the present study was that there is no difference between Ppl,ee,Talmor and Pes,ee,Vr. We therefore analyzed prospectively collected but not previously reported data from an investigation into patients with various forms of acute hypoxemic respiratory failure (ARF).11
QUICK LOOK
Current knowledge
The use of transpulmonary pressure, as determined using airway pressure and esophageal pressure, may have utility in setting PEEP in acute respiratory failure. However, there are a multitude of confounding factors that can affect the accuracy of esophageal pressure measurement.
What this paper contributes to our knowledge
Correcting esophageal pressure measurements obtained at relaxation volume of the respiratory system is more accurate than using the 5 cm H2O offset to account for the ventral-to-dorsal pressure gradient. This method could improve the individualization of setting PEEP in ARDS.
Methods
The methods have been partially described elsewhere11 and are summarized below.
Subjects
A prospective multicenter physiological investigation was carried out in consecutive intubated and mechanically ventilated patients with ARF in 6 ICUs in Lyon, France, between November 2001 and September 2002. The study was approved by the local ethics committee, Comité Consultatif Pour la Protection des Personnes se Prêtant à la Recherche Biomédicale Lyon-B. Patients were included if they met all of the following criteria: age over 18 years; tracheal intubation and mechanical ventilation; unilateral or bilateral infiltrates on frontal chest radiograph; PaO2/FIO2 < 300 mm Hg; patient examined within the first 5 days following ICU admission; onset of ARF within the last 3 days; continuous intravenous sedation and/or analgesia; and written, informed consent provided by next of kin. Patients were excluded if any of the following criteria were present: chronic interstitial lung disease; thoracic drainage; hemodynamic instability; pregnancy; impossibility to stop administration of inhaled nitric oxide; or informed consent denied.
Clinical Data Collection
At the time of investigation, the following clinical variables were recorded: age, sex, ideal body weight,4 and Simplified Acute Physiology Score II. ALI and ARDS were defined according to the European-American consensus conference criteria.12 Unilateral pneumonia was defined as unilateral radiographic infiltrates associated with PaO2/FIO2 < 300 mm Hg and no echocardiographic argument for elevated left atrial pressure. Cardiogenic pulmonary edema was defined as bilateral radiographic lung infiltrates associated with PaO2/FIO2 < 300 mm Hg and increased left atrial pressure assessed by echocardiography. The ARF subjects were therefore classified under 4 groups: namely, ALI, ARDS, unilateral pneumonia, and cardiogenic pulmonary edema.
Equipment
Air flow was measured using a heated pneumotachograph (Fleisch 2, Fleisch, Lausanne, Switzerland) inserted between the endotracheal tube and the Y-piece of the ventilator. The pressure drop across the 2 ports of the pneumotachograph was measured using a differential piezoresistive transducer (TSD160A, ± 2 cm H2O, Biopac Systems, Santa Barbara, California). Changes in lung volume were obtained through the numeric integration of the air flow signal. Pao was measured proximal to the endotracheal tube using a piezoresistive pressure transducer (Gabarith 682002, Becton Dickinson, Franklin Lakes, New Jersey). Changes in pleural pressure were estimated based on changes in Pes, using a thin-walled latex balloon (80 mm length, 1.9 cm external diameter, 0.1 mm thickness), attached to a 80 cm long catheter with 1.9 mm external diameter and 1.4 mm internal diameter (Marquat Génie Biomédical, Boissy-Saint-Léger, France), positioned in the mid-esophagus and inflated with 1 mL of air.
The validity of the Pes measurement was assessed in 2 ways. In subjects with occasional spontaneous breaths the airways were occluded at the end of expiration and subjects were asked to make inspiratory efforts. The correct position of the esophageal balloon was ascertained from the correlation between swings in Pao and Pes during this maximal effort.13 In subjects without spontaneous breathing, the esophageal balloon was inserted into the stomach, as shown by substantial positive changes in pressure on the gentle manual compression of the abdominal left upper quadrant. The esophageal balloon was then withdrawn up to the point at which there was no change in Pes tracing during the aforementioned maneuver. The esophageal balloon was connected to a differential pressure transducer (Gabarith 682002, Becton Dickinson, Franklin Lakes, New Jersey). The equipment was calibrated just before each experiment.
The same ventilator (Horus, Taema/Air Liquide Medical Systems, Antony, France) was provided by the Taema company to each participating ICU for the purposes of this study. During measurement, the humidifier was bypassed, and a single-use low-compliance ventilator tube, 60 cm long and with an internal diameter of 2 cm, was used. V̇, Pao, and Pes signals were recorded on a laptop computer equipped with data-acquisition software (MP 100, Biopac Systems, Goleta, California). The records were stored and subsequently analyzed using software (Acknowledge 3.7.1, Biopac Systems, Goleta, California).
Protocol
Measurements were taken with the subjects in the semi-recumbent position. The subjects were sedated with midazolam (0.2–0.4 mg/kg) and fentanyl (1–3 μg/kg) and paralyzed with atracurium (0.3–0.5 mg/kg) for the purposes of the study. The patient was connected to the study ventilator at the ventilatory settings (volume-controlled mode under constant air flow inflation) established by the physician in charge, which were kept constant for each patient throughout the experiment. While at the PEEP set by the clinician, the subjects first underwent a 3-second end-expiratory occlusion, followed by a 5-second end-inspiratory occlusion. Then, baseline ventilation was resumed, and after 5–15 breaths, PEEP was removed and the patient was manually disconnected from the ventilator to exhale passively to Vr (Fig. 1). Vr was achieved whenever expiratory flow became nil and end-expiratory occlusion did not result in any further increase in Pao (see Fig. 1). The difference between the end-expiratory lung volume during mechanical ventilation in the breath preceding disconnection to Vr was termed the change in functional residual capacity (ΔFRC).

From top to bottom, records of pressure at the airway opening (Pao), flow, and absolute esophageal pressure (Pes) over time in a representative patient. Pes was taken at 2 levels of end-expiratory pressure: on PEEP (Pao,ee), during baseline ventilation (Pes,ee), and on zero end-expiratory pressure at the relaxation volume of the respiratory system (Vr) (Pes,Vr). Each value was averaged between the 2 respective pairs of broken vertical lines.
Data Analysis
Three Pes measurements were taken. Pes,ee was recorded at the end of expiration during baseline ventilation, Pes,ee,o at the end of the expiratory occlusion, and Pes,Vr at the end of ventilator disconnection. The values of Pes,ee, Pes,ee,o, and Pes,Vr were averaged over 2 cardiac artifacts in the corresponding frames of the records (see Fig. 1). Ppl,ee,Talmor and Ppl,ee,o,Talmor were computed as Pes,ee or Pes,ee,o minus 5 cm H2O. Pes,ee,Vr and Pes,ee,oVr were computed as Pes,ee or Pes,ee,o minus Pes,Vr. PL,ee was computed as Pao measured at the end of expiration during baseline ventilation (Pao,ee) minus Pes,ee. PL,ee,Talmor was computed as Pao,ee minus Ppl,ee,Talmor, and PL,ee,Vr as Pao,ee minus Pes,ee,Vr. Total PL (PL,ee,o) was computed as Pao measured at the end of the expiratory occlusion (Pao,ee,o) minus Pes,ee,o. PL,ee,o,Talmor was equal to Pao,ee,o minus Ppl,ee,o,Talmor, and PL,ee,oVr to Pao,ee,o minus Pes,ee,oVr. The plateau pressure of the respiratory system (Pplat,rs) was measured from the Pao tracing 5 seconds after the onset of the end-inspiratory occlusion.
Finally, the following 2 groups were defined according to the differences in Pes,ee and Pes,ee,o between the 2 methods for Pes correction (corrected groups): corrected group Vr > Talmor, in which Pes,ee,Vr or Pes,ee,oVr were ≥ Ppl,ee,Talmor or Ppl,ee,o,Talmor, and corrected group Talmor > Vr where the opposite was true. That means that Pes,Vr was ≤ 5 cm H2O in the first corrected group, and > 5 cm H2O in the second corrected group.
Statistical Analysis
The normal distribution of the variables across the 42 subjects was verified using the Shapiro-Wilk test. The quantitative values are expressed as median and interquartile range. Values were compared using nonparametric tests or parametric tests, depending on the distribution of the variable. P value of < .05 was set as the threshold of statistical significance. The statistical analyses were performed using statistics software (SPSS 17.0, SPSS, Chicago, Illinois).
Results
The present study included 6 subjects not included in the original study due to negative values for the point of maximal compliance increase, obtained by fitting the volume-pressure curve of the respiratory system data points to a sigmoidal equation.11 Therefore, the present study reported on 42 subjects, whose main characteristics are shown in the Table. The median (IQR) time required to reach Vr was 5 (4–6) seconds beyond the baseline expiratory time, whose median (IQR) value was 2.2 (1.9–2.8) seconds. The uncorrected values of the variables were normally distributed. The same was true for the corrected values, except for Pes,ee,Vr, Pes,ee,oVr, PL,ee,Talmor and PL,ee,o,Talmor.
Characteristics of the 42 Subjects at Entry
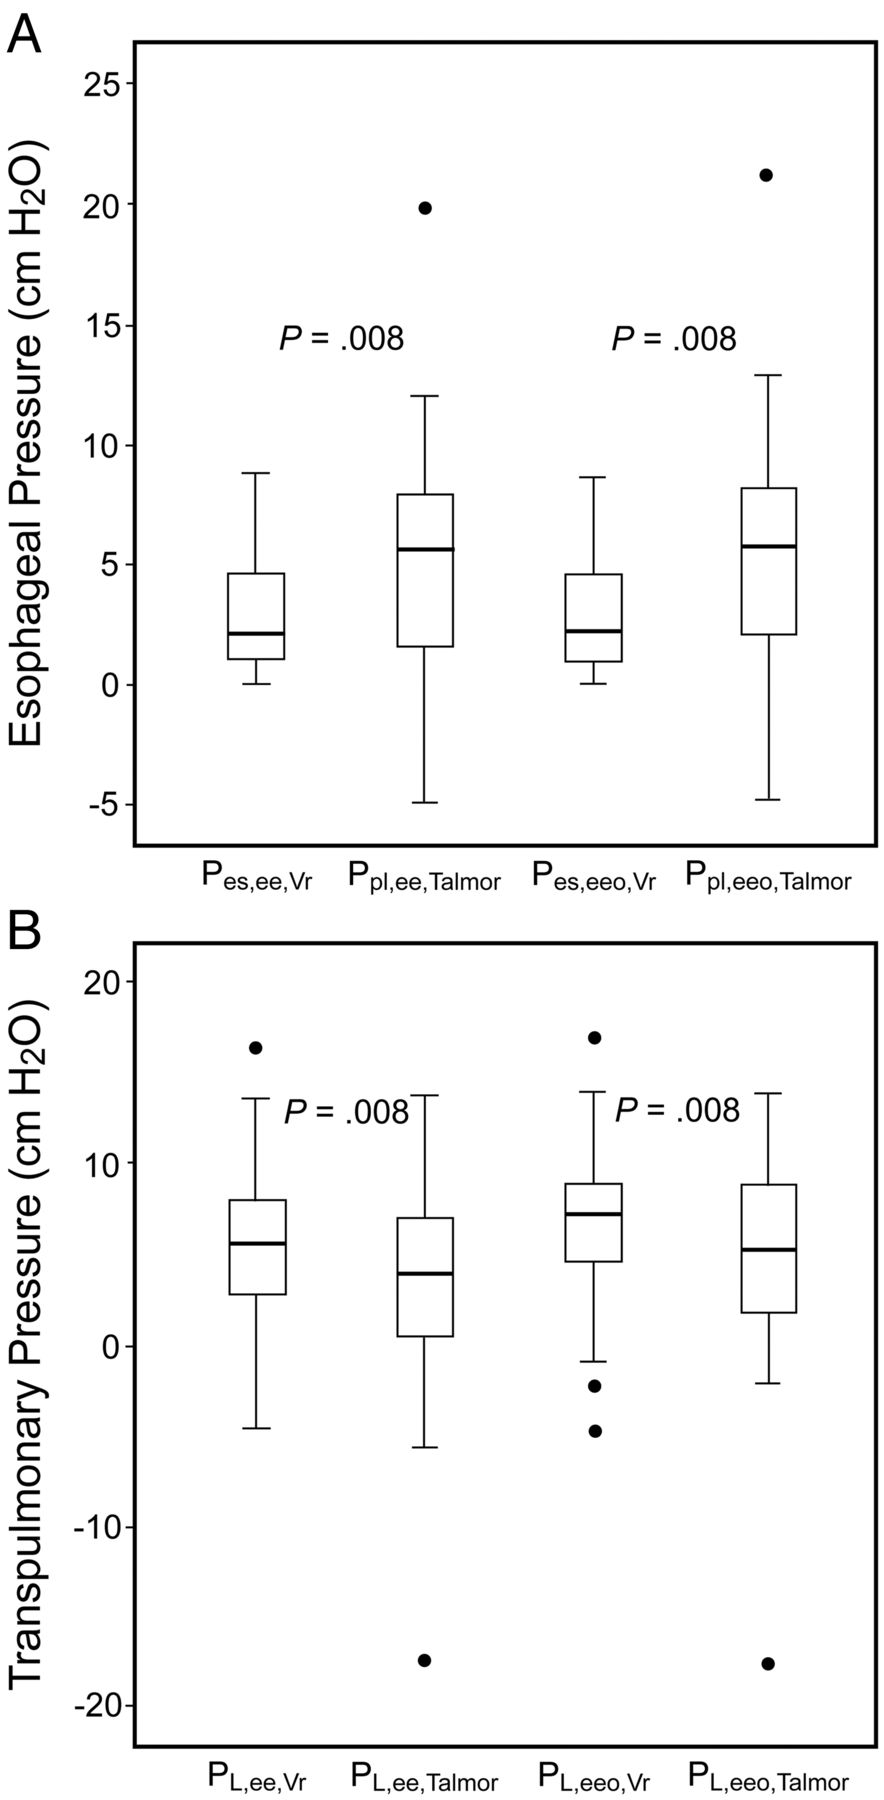
Across the 42 subjects, the raw values of Pes,ee, Pes,ee,o, and Pes,Vr amounted to 11 (7–14) cm H2O, 11 (7–14) cm H2O, and 8 (4–11) cm H2O, respectively (Fig. 2). They were not significantly different between the 4 ARF groups (one-way analysis of variance). The values for Pes,ee,Vr and Pes,ee,oVr were significantly lower than for their Talmor counterparts, 2 (1–5) cm H2O versus 6 (1–8) cm H2O, and 2 (1–5) cm H2O versus 6 (2–8) cm H2O, respectively (Fig. 3A, Wilcoxon signed-rank test on matched pairs). As a result, the values of PL,ee,Vr and PL,ee,oVr were significantly higher than those pertaining to Talmor correction (see Fig. 3B, Wilcoxon signed-rank test on matched pairs).

Box and whisker plot of PEEP applied at the airway opening (Pao,ee) and at the chest wall (Pes,ee), esophageal pressure recorded at the relaxation volume of the respiratory system (Pes,Vr) on zero end-expiratory pressure and across the lung (PL,ee), computed as Pao,ee minus Pes,ee. Black dots are outliers.

A. Box and whisker plots of esophageal pressure recorded at end-expiration (Pes,ee) or at the end of end-expiratory occlusion (Pes,ee,o), corrected according to the relaxation volume of the respiratory system (Vr) or by subtracting 5 cm H2O (Talmor method). B. Box and whisker plots of transpulmonary pressure recorded at end-expiration (PL,ee) or at the end of end-expiratory occlusion (PL,ee,o) corrected according to the relaxation volume of the respiratory system (Vr) or by subtracting 5 cm H2O (Talmor). * P = .008 between groups (Wilcoxon signed-rank test on matched pairs). Black dots are outliers.
The corrected values for Pes were not homogeneous across the 42 subjects. Indeed, in 28 subjects (two thirds of the total) Ppl,ee,Talmor was equal (3 tie) to, or greater than Pes,ee,Vr (7 [5–9] cm H2O vs 2 [1–5] cm H2O, respectively), while in 14 subjects (one third of the total) Pes,ee,Vr was greater than Ppl,ee,Talmor (2 [0–4] cm H2O vs −1 (−3 to 2) cm H2O, respectively) (Fig. 4). The same was true for Pes,ee,o (not shown). The 2 corrected groups were similar for all variables recorded at entry (see Table), and their rate of occurrence was the same across the ARF groups. Accordingly, the values for PL,ee,Vr were significantly greater than PL,ee,Talmor, amounting to 7 (5–11) cm H2O versus 5 (2–7) cm H2O (P < .001) in the corrected group Ppl,ee,Talmor > Pes,ee,Vr (Fig. 5), and the values for PL,ee,Talmor were significantly greater than PL,ee,Vr in the other corrected group, amounting to 6 (4–9) cm H2O versus 1 (−2 to 6) cm H2O (P < .001) (see Fig. 5). The same was true for PL,ee,o (not shown).
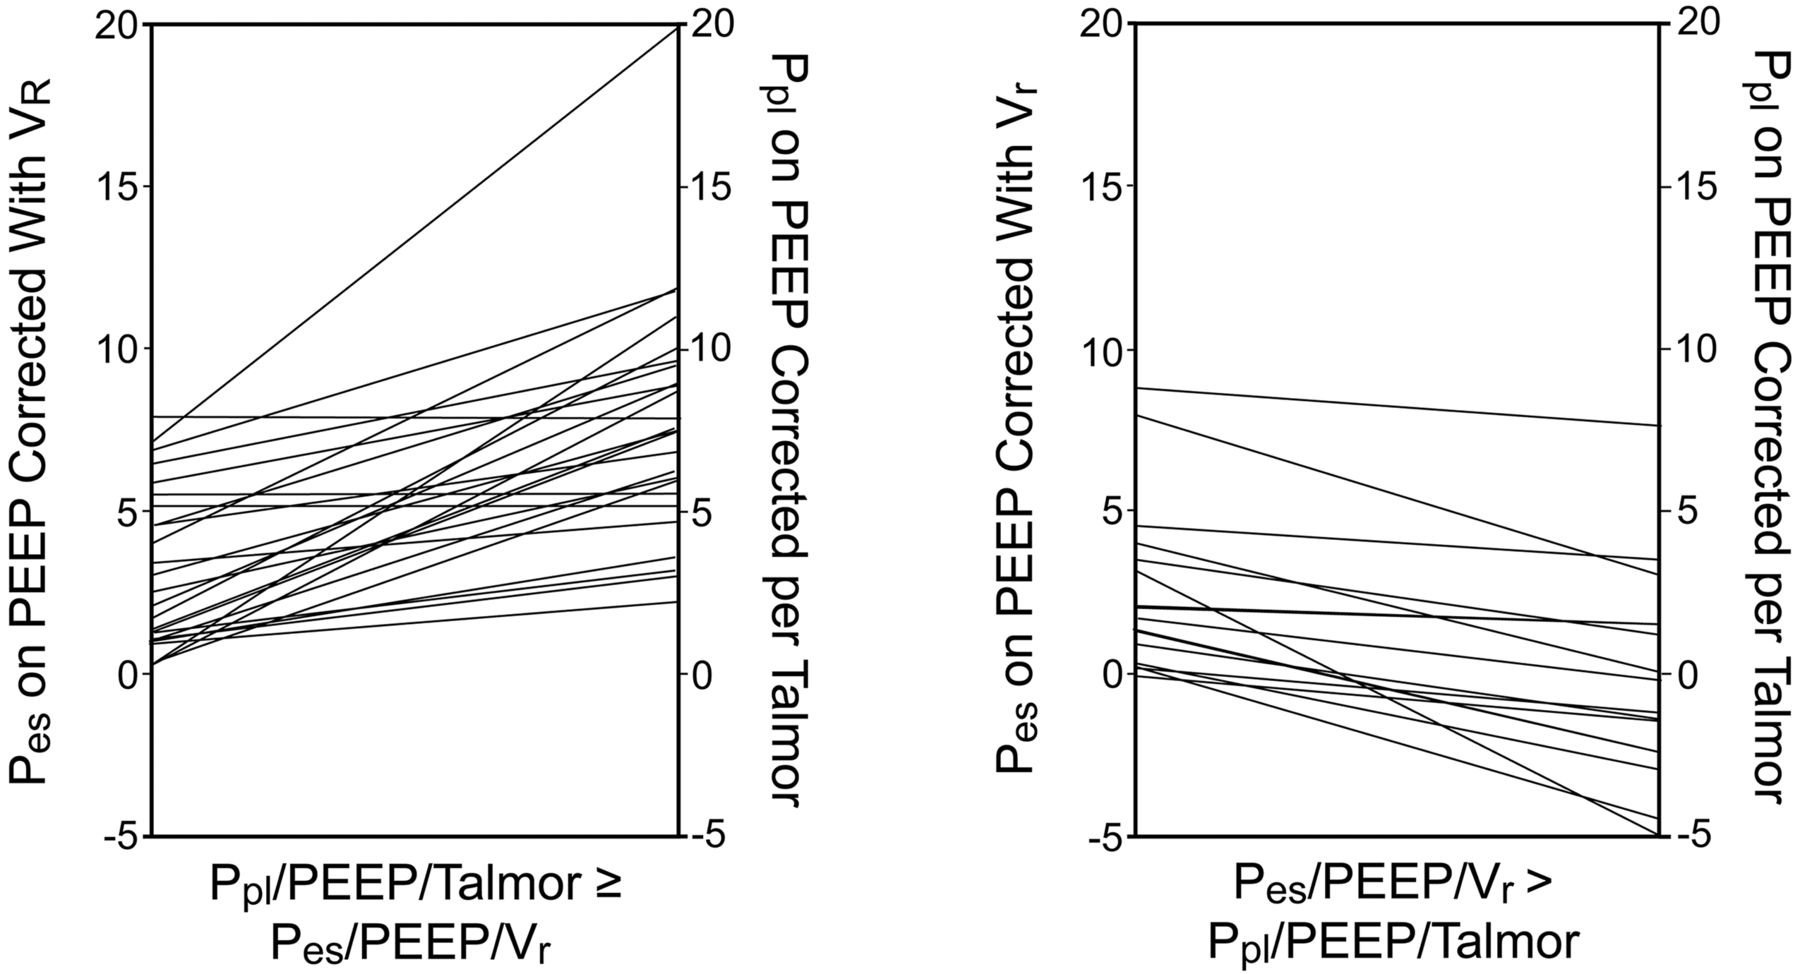
Individual values of esophageal pressure recorded at end-expiration (Pes,ee) and corrected either according to relaxation volume of the respiratory system (Vr) or by subtracting 5 cm H2O from the absolute values (Talmor method) in each group of subjects, depending on the Pes correction. P was < .001 for Vr versus Talmor method in each subset (Wilcoxon signed-rank test on matched pairs).
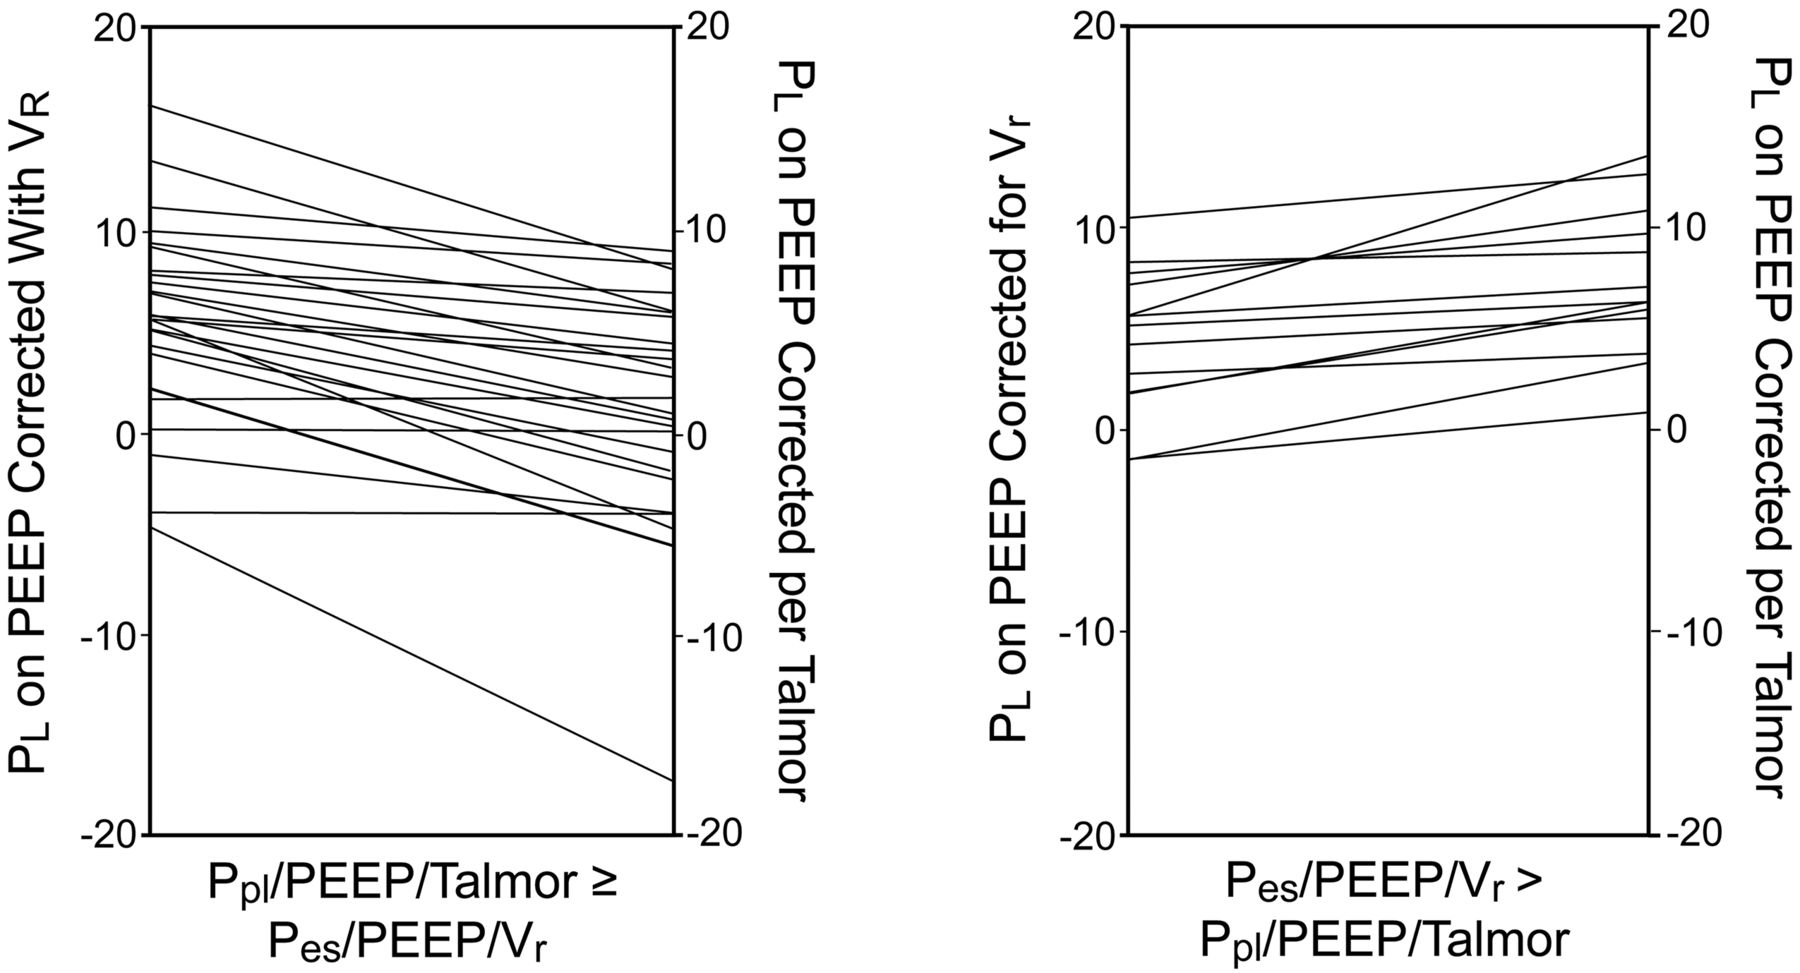
Individual values of transpulmonary end-expiratory pressure corrected for Vr (PL,ee,Vr) or using the Talmor method (PL,ee,Talmor) in each group of subjects depending on the Pes correction. P was < .001 for Vr versus Talmor method in each group (Wilcoxon signed-rank test on matched pairs).
The value for ΔFRC (301 (309–494) mL) was not statistically significantly different, either between the 2 corrected groups or across the 4 ARF groups.
The value of Pplat,rs was 23 (20–27) cm H2O in the 42 subjects. There were no significant differences in Pplat,rs between the corrected groups across ARF categories (not shown).
Discussion
In the present study we found that the difference in Pes,ee between the 2 methods for Pes correction was different across the subjects, and the 2 methods for Pes correction led to significant differences in terms of PL,ee and, hence, in recommended PEEP.
Vr is the static elastic equilibrium volume of the respiratory system. At that point, the elastic properties of the chest wall are equal in magnitude and act in opposition to those of the lung. This position was taken as the reference for Pes values in the present study. For the purposes of the present study, this is an appropriate reference point because it takes into account the physiological characteristics of the respiratory system on an individual basis. It has already been used by other investigators for the same purpose7,8 in patients with COPD, in whom the end-expiratory lung volume on zero end-expiratory pressure is higher than Vr. This method for dealing with absolute values of Pes has not been used in patients with ALI/ARDS. In the present study, unselected patients with various forms of hypoxemic ARF receiving invasive mechanical ventilation in 6 different ICUs were investigated. Therefore, this sample of patients can be seen as representative of the various impaired mechanical conditions under which both correction methods can be tested. The 2 methods for correcting absolute values of Pes both produced different results on average. This means that, on average, Vr was statistically significantly different from 5 cm H2O.
The corrected values for Pes differed across subjects, with 2 subsets being identified (see Fig. 4). In 3 subjects only Pes,Vr was equal to 5 cm H2O. This distinction was not dependent on their ARF category. Furthermore, the values for ΔFRC were the same in both subsets of subjects and also across the ARF categories. Therefore, the results for the 2 correction methods cannot be explained by differences in end-expiratory lung volume or the nature of the ARF. The difference between the 2 methods of correction is specific to each patient's individual circumstances. Since Vr is more physiologically relevant than an invariant value of 5 cm H2O, the present results suggest referring absolute Pes to its value at Vr. This method is patient-centered and would correct absolute Pes values according to the physiological context. However, this strategy requires a specific maneuver that may induce lung derecruitment, since PEEP has to be removed and time allowed before zero flow is reached (see Fig. 1). The median time required to reach Vr was 5 seconds in the present study, which may not be a major issue. To mitigate this potential problem, one would perform a recruitment maneuver after prolongation of expiration. It can be argued that the reproducibility of Vr was not ascertained, since an invariant value was used. The same, however, is true when subtracting the single value of 5 cm H2O.
The values for PL,ee,Vr were significantly greater than PL,ee,Talmor. Therefore, using the Vr correction method would result in setting higher PEEP values. The question of high versus low PEEP in ALI/ARDS is not fully resolved. Indeed, the meta-analysis of individual data showed no difference in mortality between higher and lower PEEP in ALI/ARDS.14 However, the subgroup of ARDS patients had a significantly lower mortality when receiving higher rather than lower PEEP.14 The results obtained by Talmor et al3 support this finding. In the present study, Vr correction would have generated a PEEP level greater than 1.7 cm H2O (median) above the actual level set by the clinician, with no significant change in Pplat,rs, regardless of ARF category. It should be stressed that the present study did not address the issue of patient outcome. Therefore, further studies should be done to explore whether the Vr correction method for Pes would impact on patient outcome.
Conclusions
In conclusion, referring absolute Pes values to Vr would better improve the customization of the correction of Pes based on the physiological and individual context, rather than an invariant value of 5 cm H2O.
Footnotes
- Correspondence: Claude Guérin MD PhD, Service de Réanimation Médicale, Hôpital de la Croix Rousse, 103 Grande Rue de la Croix Rousse, 69004 Lyon, France. E-mail: claude.guerin{at}chu-lyon.fr.
The authors have disclosed a relationship with Taema/Air Liquide Medical Systems, Antony, France, which provided the study ventilators.
- Copyright © 2012 by Daedalus Enterprises Inc.


