

Abstract
BACKGROUND: Current published guidelines on spirometry interpretation suggest an elevated FVC and FEV1 > 100% of predicted with an obstructive ratio may represent a physiological variant. There is minimal evidence whether this finding can be indicative of symptomatic airways obstruction.
METHODS: Pulmonary function testing databases for a 4-year period were retrospectively reviewed. All technically adequate spirometry studies were included, based on these criteria: FEV1 > 90% of predicted, and FEV1/FVC below the lower limit of normal, based on 95th percentile confidence intervals. Clinical indications for testing were noted. Testing for post-bronchodilator response, lung volumes, and methacholine challenge tests were reviewed for evidence of airway hyper-responsiveness (AHR). Comparisons were made between symptomatic versus asymptomatic individuals and FEV1 values less than or greater than 100% of predicted.
RESULTS: A total of 280 studies were analyzed. During their clinical evaluation, 192 patients (69%) had post-bronchodilator spirometry recorded, 63 patients (23%) had lung volumes, and 36 patients (11%) completed methacholine challenge testing. Indications for spirometry included 193 symptomatic patients and 87 asymptomatic patients. Nearly 28% of patients with post-bronchodilator testing met criteria for AHR. No differences in AHR were found between the symptomatic and asymptomatic groups. The majority of patients (77%) with AHR had an FEV1 < 100%, when compared to patients with an FEV1 ≥ 100%.
CONCLUSIONS: A normal FEV1 > 90% of predicted with obstructive indices may not represent a normal physiological variant, as 28% of patients were found to have underlying AHR. These findings suggest that clinicians should evaluate for AHR, especially in symptomatic patients, even if the FEV1 is > 90% of predicted.
Introduction
The American Thoracic Society (ATS) and European Respiratory Society (ERS) published updated guidelines in 2005 on the interpretation of standard pulmonary function testing (PFT).1 These guidelines included new reference values that incorporated the National Health and Nutrition Examination Survey (NHANES) III data and specifically included reference values for minority populations. These new values replaced previously used reference values and defined a 95% CI to establish ranges for obstructive and restrictive disease.2
One area addressed by these guidelines was the evaluation of patients with a high normal FEV1 and FVC, as defined as > 100% of predicted, with an FEV1/FVC indicative of airways obstruction. The 1991 guidelines suggested these patients were normal based on an FEV1 and FVC > 100%, and described the finding as a “physiologic variant.”3 The 2005 guidelines make the following statement:
For healthy subjects, the meaning of a low FEV1/FVC accompanied by an FEV1 within the normal range is unclear. This pattern is probably due to “dysanaptic” or unequal growth of the airways and lung parenchyma (referred to in a previous ATS document as a possible physiological variant when FEV1 was > 100% of predicted). Whether this pattern represents air-flow obstruction will depend on the prior probability of obstructive disease and possibly on the results of additional tests, such as bronchodilator (BD) response, DLCO [diffusing capacity of the lung for carbon monoxide], gas exchange evaluation, and measurement of muscle strength or exercise testing.1
There is a lack of evidence supporting this hypothesis. Only one recent evaluation of 40 patients with this finding examined whether it represented a physiologic variant, and noted increased airway hyper-responsiveness (AHR) in symptomatic patients.4 A commentary by Enright suggested that interpretation of a low FEV1/FVC with a normal FEV1 will lead to an increase in the number of patients defined as mild obstruction.5 The commentary correctly identifies that, despite recommendations by the several societies, there is no evidence supporting such interpretation as either normal or abnormal.6,7 As a preliminary step in answering this question, this paper retrospectively examines the prevalence of AHR in patients, both asymptomatic and symptomatic, with obstructive spirometric indices and an FEV1 > 90% of predicted.
QUICK LOOK
Current knowledge
Current published guidelines on spirometry interpretation suggest that an elevated FVC and FEV1 greater than 100% of predicted with an obstructive ratio may represent a physiological variant. There is little evidence whether this finding represents symptomatic airways obstruction.
What this paper contributes to our knowledge
A normal FEV1 > 90% predicted with obstructive indices may not represent a normal physiological variant. These findings suggest that clinicians should evaluate for airway hyper-responsiveness in symptomatic patients, even if the FEV1 is > 90% predicted.
Methods
The PFT databases at 2 institutions were retrospectively reviewed for the period from January 2006 to June 2010. This study was reviewed and approved by the local institutional review board. All spirometry studies for patients between the ages of 18 and 75 that were technically adequate based on ATS standards were initially included if they met the following criteria1: FEV1 > 90% of predicted (based on NHANES III reference values), and FEV1/FVC below the lower limit of normal (outside the 95th percentile CI, based on NHANES III).2 In the case of duplicate studies, only the first study performed was used in the analysis. Out-patient records were reviewed to determine the indication for the study (if available) and existing pulmonary diagnoses and active medications. Specific notation was made for those patients with active pulmonary symptoms or known underlying lung disease, and those patients without symptoms (occupational screening, asymptomatic solitary pulmonary nodule). Those patients using oral or inhaled corticosteroids, long-acting inhaled β agonists, or anticholinergics at the time of the spirometry were further analyzed as a separate symptomatic group.
Specific values recorded from spirometry included FEV1, FVC, FEV1/FVC, forced expiratory flow during the middle half of the FVC maneuver (FEF25–75%), and post-BD FEV1 (if performed). Results of methacholine challenge testing (MCT) and measurement of lung volumes and diffusing capacity of carbon monoxide were also recorded if obtained during the clinical evaluation. Specific values recorded included the total lung capacity (TLC), residual volume (RV), and diffusing capacity of the lung for carbon monoxide (DLCO). Values recorded for those patients with an MCT were the baseline and final FEV1, highest dose of methacholine, and the presence of airway responsiveness based on 20% decrease in FEV1 at dose ≤ 4 mg/mL.
Initial comparisons were made between symptomatic and asymptomatic patients. Statistical analysis was performed using commercially available software (SPSS version 19.0, SPSS, Chicago, Illinois). Normality was tested for the demographic and PFT variables, and the Student t test or Mann-Whitney U test was used, as appropriate, between the 2 groups. Specific comparisons were made for age, body mass index, percent-of-predicted FEV1, post-BD percent-of-predicted and percent change in FEV1, percent-of-predicted FVC, FEV1/FVC, percent-of-predicted FEF25–75%, TLC, RV, and DLCO. Subgroup analysis of the symptomatic group was performed utilizing the appropriate test after subdivision of the patients into 2 groups based on use of pulmonary medications. Further analysis was performed to analyze differences within the entire group for an FEV1 > 90% of predicted and < 100% of predicted; and an FEV1 ≥ 100% of predicted.
Results
A total of 22,000 spirometry exams were retrospectively reviewed for a period from January 2006 to June 2010. From this database, 341 (1.5%) studies met the inclusion criteria based on both FEV1 > 90% of predicted and FEV1/FVC values consistent with obstructive indices; 61 studies were duplicates from the same patients and excluded from further analysis. A total of 280 studies were analyzed. There was an even distribution for sex, with 141 males and 139 females, an average age of 35.1 ± 15.9 years old, and body mass index of 25.8 ± 4.1 kg/m2. Delineation was made between symptomatic and asymptomatic patients on the basis of written indications for spirometry. The total number of symptomatic patients was 193 (69%); of these, 62 (32%) were prescribed daily inhaled pulmonary medications. The symptomatic group on medications included 49 asthma patients and 13 COPD patients. Indications for spirometry in the symptomatic non-medication group included dyspnea (no. = 55), cough (no. = 14), diagnosed COPD and asthma (no. = 39) on no daily medications, and other active pulmonary conditions, to include chest pain, wheezing, and hemoptysis (no. = 23). The remainder of patients (no. = 87, 31%), were considered asymptomatic and referred for employment screening (no. = 66), asymptomatic pulmonary nodules (no. = 18), and no indication given (no. = 3). Demographics for these groups are shown in Table 1. No statistical differences were noted between groups.
Patient Demographics
PFT values for the groups are shown in Table 2. Notable findings include an elevated percent-of-predicted FVC of 114.8 ± 9.6% and corresponding percent-of-predicted TLC of 115.2 ± 16.5%, without a concomitant increase in the percent-of-predicted RV at 100.7 ± 32.7%. As expected based on the inclusion criteria, the percent-of-predicted FEV1 was within normal range, and both the FEV1/FVC and FEF25–75% were < 70% of predicted values. Fifty patients (35%) with symptoms and 26 patients (43%) who were asymptomatic had an FEV1 > 100%. There were no significant differences for the PFT values between the symptomatic and asymptomatic groups.
Comparison of PFT Values for Symptomatic Versus Asymptomatic Groups (n = 280)
During the clinical evaluation of some patients for evidence of AHR, 192 patients (69%) underwent post-BD testing, and 36 patients (13%) completed an MCT. There were no differences in baseline PFT values for patients undergoing post-BD testing, when compared to the overall group (FEV1 = 97.4 ± 6.7%, FVC = 115.2 ± 9.3%). As shown in Table 2, no statistical differences were found between symptomatic and asymptomatic patients for post-BD FEV1 or percent change in FEV1. Figure 1 shows the overall AHR and different BD responses noted. The majority of patients tested (77%) did not demonstrate a significant BD response to short-acting β agonists. The lack of any BD response (either 12% or 8%) ranged from 79% in symptomatic patients to 70% in the asymptomatic group. MCT was performed in only 36 patients (13% of all patients); the symptomatic group had 13 positive studies of 34 MCTs performed, while the asymptomatic group had 2 negative MCTs. Combining both the post-BD testing (either 12% or 8% decrease) and MCT results, overall positive AHR was noted in only 54 of the 192 (28%) patients tested. There was no significant difference in the proportion of patients with AHR in the symptomatic group (27%), compared to the asymptomatic group (30%). An additional finding suggestive of AHR was an additional 58 patients (30%) who also had a 20% increase in FEF25–75% post-BD, with even distribution (30% to 32%) between groups (see Fig. 1).
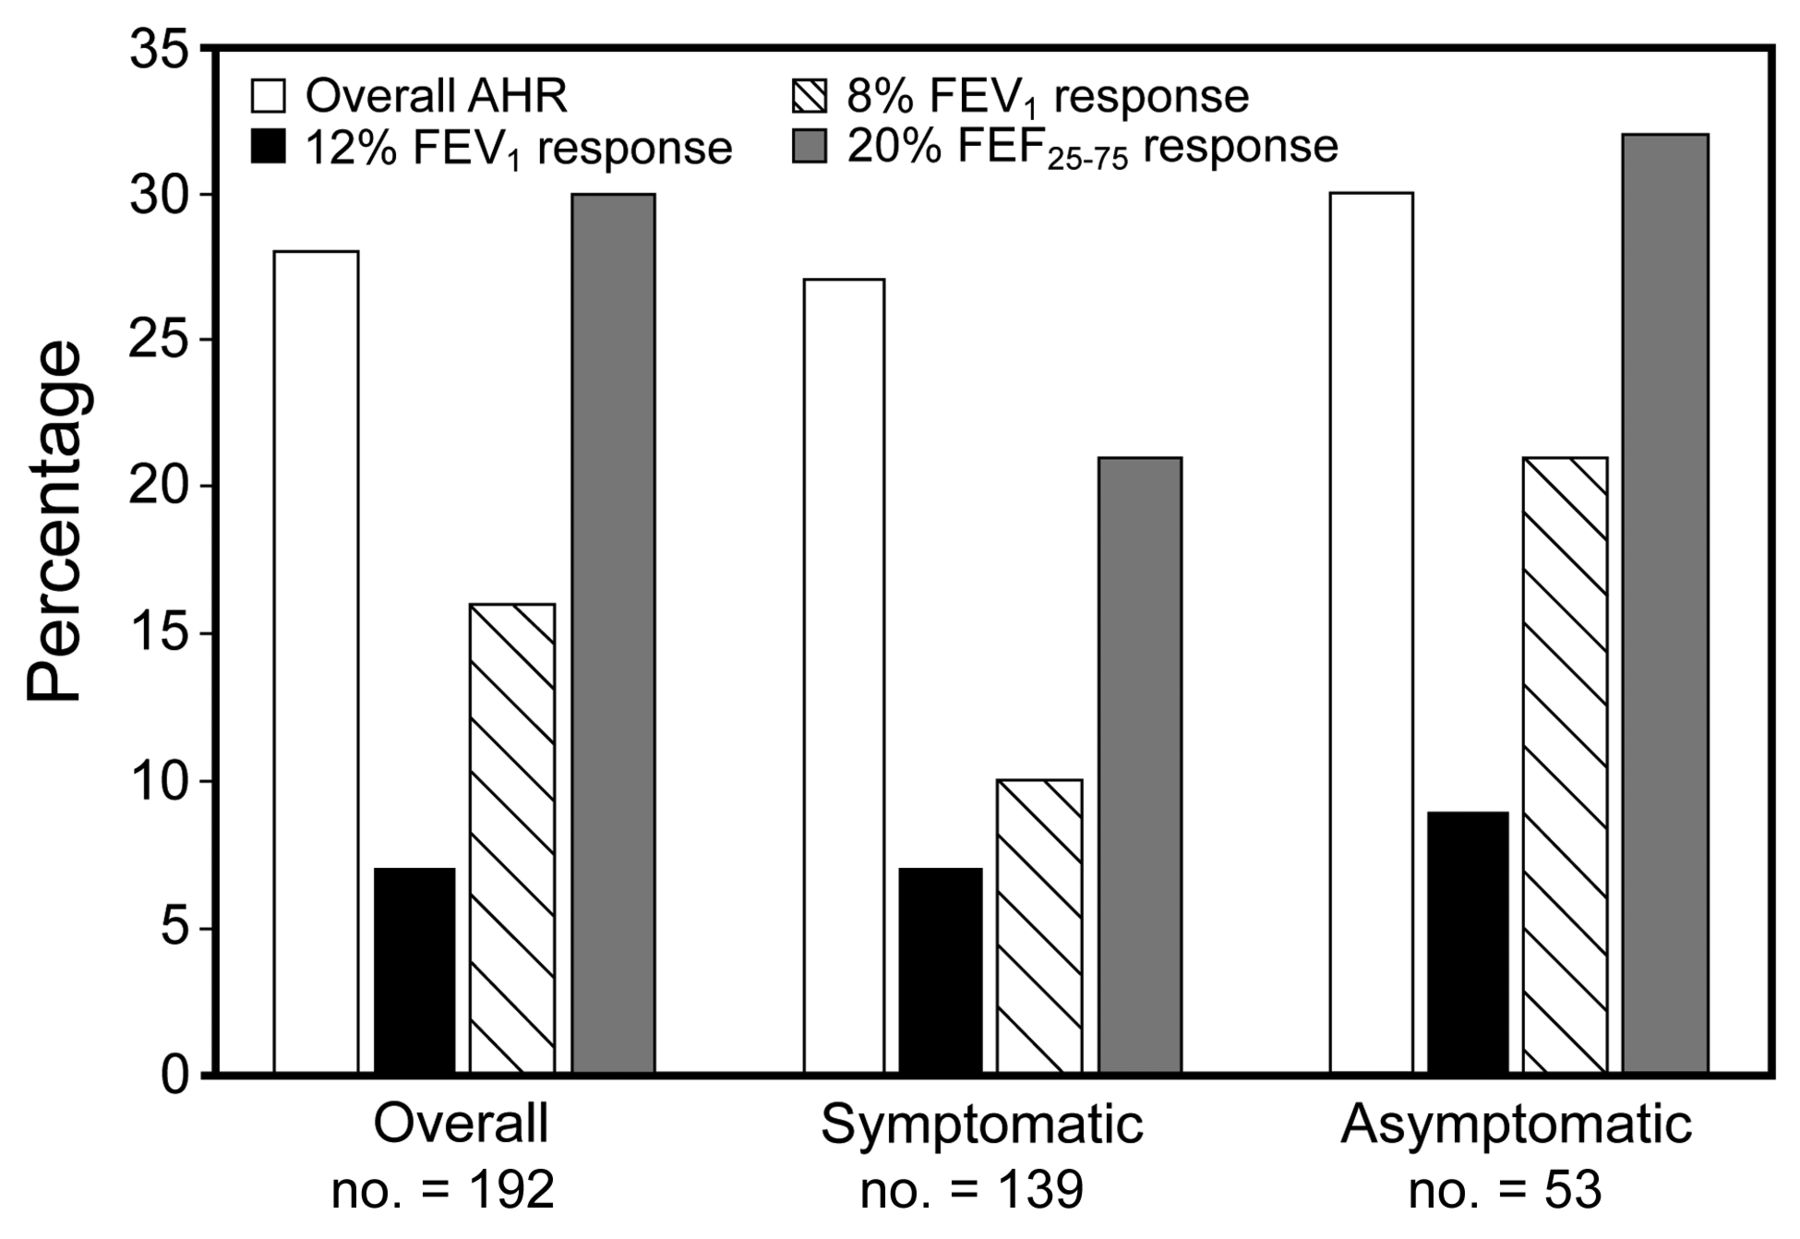
Bar graph depicting percentage of patients with evidence of airway hyper-responsiveness (AHR). Column 1 represents the combined total for 12% FEV1 response, 8% FEV1 response, and positive methacholine challenge test. Column 2 demonstrates the 12% FEV1 response, and Column 3 demonstrates the 8% FEV1 response. Column 4 shows the additional percentage of patients with a 20% FEF25–75% response.
Further subgroup analysis of the symptomatic group for differences in PFT values based on the use of regular inhaled medications (no. = 62) versus no use of inhaled medications (no. = 131) did not detect any significant differences (Table 3). An additional subgroup analysis evaluated FEV1 < 100% of predicted (no. = 204) and FEV1 ≥ 100% of predicted (no. = 76) to determine any statistical differences for a lower limit cutoff of 90% compared to 100% (Table 4). As expected based on FEV1 values, there were significant differences between the 2 groups in terms of percent-of-predicted FEV1 (pre- and post-BD), FVC, and percent-of-predicted FEF25–75%. There was no difference in the overall FEV1/FVC and the percent change of FEV1 post-BD, with P values > .05. Along with the lack of differences based on PFT values, the presence of AHR (based on BD response and MCT) did not favor either group. Ten patients (7.0% of patients tested) with an FEV1 < 100% of predicted compared to 5 patients (10.2%) (all symptomatic) with an FEV1 ≥ 100%, had a 12% BD response and 200 mL increase in FEV1; 24 patients (16.8%) with an FEV1 < 100%, compared to 7 patients (14.3%) with an FEV1 ≥ 100%, had an 8% BD response and 150 mL increase in FEV1; and 8 patients (33%) with an FEV1 < 100% had a reactive MCT, compared to 5 patients (55%) with an FEV1 ≥ 100%.
PFT Values of Symptomatic Group, Based on Medication Use
Analysis of PFT Based on FEV1 Greater Than or Less Than 100% of Predicted (n = 280)
Discussion
Our study made a preliminary demonstration that the finding of obstruction based on the FEV1/FVC in the setting of a normal FEV1 (defined in this study as greater than 90% of predicted) does not consistently represent a normal physiologic variant. Nearly 28% of tested patients met criteria for AHR by either BD response or bronchoprovocation testing, irrespective of the presence or absence of symptoms. While there were no significant differences in AHR for those patients with an FEV1 < 100% of predicted versus ≥ 100% of predicted, the overall trend demonstrated a decreased frequency of AHR for an FEV1 ≥ 100% of predicted, as 80% of patients with evidence of AHR had an FEV1 < 100%. This becomes important in correlating the clinical suspicion for underlying disease with the indication (screening vs symptomatic) for PFT. Conversely, even in the presence of active pulmonary symptoms or established diagnoses, nearly 75% of patients tested did not demonstrate a significant BD response. This might be expected in patients on medications, but no differences were found when compared with the non-medication or asymptomatic groups. From a clinical perspective, this spirometric pattern was not uncommon in our study population and was found in approximately 1.5% of all spirometry examinations reviewed. Understanding the proper interpretation of this finding would make a difference in the evaluation and treatment of individual patients.
The initial standards for spirometry were first published by the ATS in 1979, but provided minimal guidance on interpretation for the diagnosis of airway obstruction based on the FEV1/FVC.8 The 1987 ATS update also gave minimal information on standards for interpretation, noting over 20 different reference value equations at the time.9 The first published standards for interpretation in 1991 suggested that elevated FVC values may result in lower FEV1/FVC values in athletes or physically demanding occupations. This statement issued caution in interpreting FEV1 and FVC values above established normal values, even with a low ratio, since healthy subjects, especially athletes, may have this pattern.3 Notably, this recommendation was based largely on expert opinion and provided no referenced studies. The 1994 ATS update provided no new updates to the 1991 interpretative guidelines for clinicians.10 Not until the publication of the 2005 ATS standards was there further discussion of this finding and attempt to explain that in healthy subjects there may be the “dysanaptic” pattern or unequal growth of the airways.1 None of the published ATS standards on spirometry supported the recommendations with clinical evidence.
The only study to date that formally evaluated patients with obstructive indices and an FEV1 > 100% of predicted was published by Barisione et al in 2009.4 Forty subjects without known cardiopulmonary disease had previously completed a surveillance or pre-employment spirometry and were noted to have this finding. They completed 2 questionnaires and underwent formalized testing, to include full PFTs, BD response, and MCT. On the basis of the questionnaires and testing, they classified 7 subjects as asymptomatic, 8 subjects as rhinitis, 12 subjects as asthma, and the remaining 13 subjects as COPD. This study also did not demonstrate significant differences between diagnosed groups, except an increased RV/TLC in the subjects classified as COPD.
What is the clinical importance of the correct interpretation of spirometry? In the evaluation of symptomatic patients, a normal percent-of-predicted FEV1 with the presence of obstruction could be incorrectly interpreted as normal in the presence of actual airways disease. This may lead to undertreatment of these patients if there is no further evaluation to establish the presence of AHR. Conversely, in an asymptomatic patient who performs spirometry for occupational or screening purposes, an interpretation of obstruction may misdiagnose a patient with non-existent disease. Both the clinical history and determination of AHR, whether by BD response or bronchoprovocation testing, are important in establishing a diagnosis of airways disease, typically either asthma or COPD. In many instances, the interpretation of spirometry is performed in the absence of clinical history. Substantial concern has been raised by Enright and others that there will be an overdiagnosis of airway obstruction that could lead to overtreatment.5 The correct interpretation of spirometry and determination of AHR is especially important in military personnel, as this information may impact the ability to meet fitness for duty and requirements for deployment.
The lower limit of normal for the FEV1/FVC for spirometry interpretation has been debated over the past several decades, based on various standards set by differing respiratory societies. Viegi et al found significant differences in obstruction based on the 1995 ERS statement (FEV1/vital capacity < 88% of predicted in men and < 89% of predicted in women), accepted “clinical” criteria (FEV1/FVC < 70%), and the 1986 ATS statement (FEV1/FVC < 75%). Large variances were noted in their 2 patient groups below and above the age of 45. Importantly, in those patients with a “possible physiologic variant,” rates of obstruction ranged from 1.0% (ERS) to 3.1% (clinical) to 12.0% (ATS) based on the various criteria.11 Since the publication of the NHANES III reference values, several studies have demonstrated the variances associated with older references values. Kreider et al evaluated 4 different schemes for spirometry interpretation in 319 patients. Using the ATS/ERS classification, compared to the Global Initiative for Chronic Obstructive Lung Disease scheme, led to an increase in patients diagnosed with obstruction (44% vs 33%).12 Two similar studies evaluated changes in interpretation based on NHANES III reference values and noted there was an increase in obstructive abnormalities using the Morris, Knudson, and Crapo reference values.13,14 Schermer et al reviewed 14,056 patients with obstruction based on FEV1/FVC of 70% and compared these to age and sex-specific lower limits of normal. The use of a fixed value resulted in the overdiagnosis of obstruction for these spirometry exams.15 These studies reflect that the standards and reference values used make a significant difference in interpretation, especially in the absence of clinical history.
There are 2 patient populations in which a low FEV1/FVC with a normal FEV1 has been reported: acromegalics and athletes (especially swimmers). However, case series do not demonstrate this to be a consistent finding across these populations. An early study by Evans et al described pulmonary function in 20 patients with acromegaly, noting increased vital capacity (120% of predicted) in 8 males with a normal FEV1 (108% of predicted) along with upper-airway obstruction based on the midexpiratory to inspiratory flow ratio.16 Subsequent studies of acromegaly patients demonstrated an increased TLC with a corresponding increase in FVC, but without an overall decrease in FEV1/FVC, when compared to control patients.17,18 A comparison of swimmers to runners and controls noted a higher increase in lung volumes (FVC of 128% of predicted) but without differences in the FEV1/FVC.19 A similar study demonstrated an increase in the vital capacity (115% of predicted), but without a decrease in FEV1/FVC.20 While there may be individual patients with elevated lung volumes and normal FEV1, the decrease in the flow ratio has not consistently been demonstrated in either swimmers or acromegalics.
There are several limitations to this study that alter the applicability of our findings. This was a retrospective study, and the clinical evaluation varied significantly based on indications for spirometry (screening vs symptomatic). Approximately one third of patients were undergoing occupational screening and not testing for active pulmonary symptoms; there would be less inclination for bronchoprovocation testing in this population. Although 61% of asymptomatic patients underwent post-BD testing, their response rates for AHR were similar to symptomatic individuals. It is possible that fewer of these patients would have evidence of AHR if further testing were pursued. Fewer than 25% of patients had completed full PFTs, so there are limited data on the presence of possible hyperinflation, especially in patients diagnosed with COPD. Only two thirds of patients had post-BD spirometry performed, and 13% underwent formal bronchoprovocation testing, so the true prevalence of AHR cannot be established. Importantly, our population was primarily young (mean age of 35 y) and nearly two thirds were active duty military, so the applicability of these findings may not apply to the general population.
Conclusions
The findings from this study suggest that an FEV1 > 90% of predicted with obstructive indices may indicate underlying AHR in certain patients. Furthermore, an FEV1 > 100% should not automatically be assumed to indicate a normal physiologic variant. Therefore, clinicians should perform an evaluation for AHR, particularly in symptomatic patients, even if the FEV1 is > 90% of predicted, by full PFTs, post-BD response, and then by formalized bronchoprovocation testing. Given the equivalence of AHR between the symptomatic and asymptomatic groups, increased emphasis should be placed on the clinical history and active pulmonary symptoms to determine further need for evaluation. A detailed prospective evaluation of patients with these spirometric indices will further clarify the prevalence of AHR in this population and provide additional guidance on the interpretation of PFTs and indications for further testing in asymptomatic versus symptomatic patients.
Footnotes
- Correspondence: Michael J Morris MD, Department of Medicine, 3851 Roger Brooke Drive, Brooke Army Medical Center, Fort Sam Houston TX 78234-6200. E-mail: michael.morris{at}amedd.army.mil.
The opinions and assertions contained herein are the private views of the authors and are not to be construed as reflecting the positions of the Department of the Army, Department of the Air Force, or Department of Defense.
The authors have disclosed no conflicts of interest.
- Copyright © 2012 by Daedalus Enterprises Inc.


