

Abstract
INTRODUCTION: There is growing evidence that exercise-induced variation in lung volumes is an important source of ventilatory limitation and is linked to exercise intolerance in COPD. The aim of this study was to compare the correlations of walk distance and lung volumes measured before and after a 6-min walk test (6MWT) in subjects with COPD.
METHODS: Forty-five subjects with stable COPD (mean pre-bronchodilator FEV1: 47 ± 18% predicted) underwent a 6MWT. Body plethysmography was performed immediately pre- and post-6MWT.
RESULTS: Correlations were generally stronger between 6-min walk distance and post-6MWT lung volumes than between 6-min walk distance and pre-6MWT lung volumes, except for FEV1. These differences in Pearson correlation coefficients were significant for residual volume expressed as percent of total lung capacity (−0.67 vs −0.58, P = .043), percent of predicted residual volume expressed as percent of total lung capacity (−0.68 vs −0.59, P = .026), inspiratory vital capacity (0.65 vs 0.54, P = .019), percent of predicted inspiratory vital capacity (0.49 vs 0.38, P = .037), and percent of predicted functional residual capacity (−0.62 vs −0.47, P = .023).
CONCLUSIONS: In subjects with stable COPD, lung volumes measured immediately after 6MWT are more closely related to exercise limitation than baseline lung volumes measured before 6MWT, except for FEV1. Therefore, pulmonary function testing immediately after exercise should be included in future studies on COPD for the assessment of exercise-induced ventilatory constraints to physical performance that cannot be adequately assessed from baseline pulmonary function testing at rest.
- chronic obstructive pulmonary disease
- exercise limitation
- pulmonary function
- body plethysmography
- hyperinflation
Introduction
COPD is a leading cause of disease burden worldwide.1,2 It is primarily characterized by chronic inflammation of peripheral airways and destruction of lung parenchyma, resulting in reduced elastic recoil and increased airway resistance.3 These changes provoke progressive expiratory flow limitation and hyperinflation, which are the pathophysiological hallmarks of COPD.4–6 Impaired exercise tolerance is a cardinal symptom of COPD, and, although traditionally associated with ventilatory limitations, the mechanisms responsible for the development of exercise intolerance are complex and multifactorial, given the pathophysiological heterogeneity of the disease and the frequent existence of comorbidities.7–12 The distance walked during a 6-min walk test (6MWT) has been shown to be useful for the evaluation of exercise capacity in subjects with COPD.13,14 Moreover, linear relationships between walking distance and pulmonary function parameters could be demonstrated in several studies.8,9,11,15–17 However, conventional measurements of resting pulmonary function at baseline could explain only a part of the variance in 6-min walk distance (6MWD).8,17 The recognition of the development of dynamic hyperinflation during exercise as an important factor linked to exercise intolerance in COPD showed that the measurement of exercise-induced variation in lung volumes could complement the traditional assessments of pulmonary function and could provide additional insight into the mechanisms by which ventilatory constrains limit exercise capacity.18
Therefore, we hypothesized that end-exercise pulmonary function could be more related to exercise capacity than resting pulmonary function at baseline. The aim of our study was to compare the correlations of 6MWD and lung volumes measured before and after 6MWT in subjects with COPD.
QUICK LOOK
Current knowledge
Exercise-induced variation in lung volumes is an important source of ventilatory limitation and is linked to exercise intolerance in COPD. The 6-min walk test is the standard for determining exercise limitation in COPD.
What this paper contributes to our knowledge
In subjects with stable COPD, lung volumes measured immediately after the 6-min walk test were more closely related to walking distance than baseline lung volumes, except for FEV1. Comprehensive pulmonary function testing immediately after exercise may assist in determining the cause of exercise limitation.
Methods
Subjects
Subjects with the diagnosis of stable COPD, established according to the Global Initiative for Chronic Obstructive Lung Disease (GOLD) criteria before study entry,2 who were able to perform 6MWTs were consecutively recruited from a pulmonary out-patient clinic. All subjects were treated according to GOLD standards and took their regular medication on the day of the test.2 Medical records were reviewed to confirm the presence of a post-bronchodilator FEV1/FVC ratio < 0.7. Subjects were excluded if they had an acute cardiac illness within 4 weeks before study entry or severe orthopedic or neurological diseases limiting the ability to walk. The study received approval from the local ethics committee (approval 316/12 from the ethics committee of the University of Ulm), and informed consent was given by all of the subjects.
Procedures
The 6MWT was carried out according to the American Thoracic Society and the European Respiratory Society (ATS/ERS) guidelines by an experienced investigator (TW) in a flat, straight, indoor corridor (30 m long, marked by colored tape at each end to indicate turnaround points).19 If subjects were on chronic oxygen therapy, oxygen supplementation was provided at the subject's standard rate. Subjects were instructed to walk at a comfortable pace but with the aim to cover as much distance as possible in 6 min, and were allowed to stop and rest during the test and to proceed with the walk as soon as they were able. At the end of the 6 min, the distance walked was recorded, but the subject was not told to stop until the starting point was reached again. Pre- and post-walk dyspnea and fatigue levels using the Borg scale were recorded together with oxygen saturation (SpO2) and heart rate from a lightweight pulse oximeter (Pulsox 300i; Konica Minolta Sensing, Osaka, Japan).19,20
Spirometry and whole body plethysmography measurements were performed according to the ATS/ERS21,22 guidelines with a commercially available system (MasterScreen Body, CareFusion, Hoechberg, Germany; and JLAB LABManager, version 5.3.0.4, Cardinal Health, Hoechberg, Germany) before and immediately (< 1 min) after the 6MWT. Lung subdivisions were determined by measuring expiratory reserve volume after the acquisition of the functional residual capacity (FRC), followed by the slow inspiratory vital capacity maneuver, all performed as “linked” maneuvers as recommended by the ATS/ERS guidelines.21,22 Values for inspiratory capacity were calculated as total lung capacity (TLC) minus FRC. Spirometric abnormalities were classified according to ATS/ERS guidelines based on pre-bronchodilator FEV1.23 The predicted normal values for spirometry and lung volumes were those of the European Community of Coal and Steel.24 Predicted normal values for inspiratory capacity were calculated as predicted TLC minus predicted FRC.
The body plethysmograph was located near the starting position of the 6MWT, which enabled subjects to start the walk test directly after pulmonary function measurement and, in addition, to re-enter the plethysmograph immediately at the end of the walk for post-exercise pulmonary function assessment.
Statistical Analysis and Sample Size Estimation
The required sample size was estimated using GPower (version 3.1.7, Franz Faul, University of Kiel, Kiel, Germany) to detect a difference between dependent correlations with a power of 80% and an α level of 5%.25 On examining pre- and post-6MWT pulmonary function data from 20 subjects with COPD previously studied in our institution, we observed the strongest 6MWD correlations with residual volume expressed as percent of TLC (RV%TLC) values (% predicted), both in the pre- and post-6MWT measurements.26 Based on these data, we assumed 6MWD correlations of −0.701 and −0.794 with RV%TLC values (% predicted) pre- and post-6MWT, respectively, and a correlation of the pre- and post-6MWT RV%TLC values (% predicted) of 0.950. This resulted in a required sample size of 45 subjects.
Correlations between 6MWD and pulmonary function parameters were evaluated using Pearson's correlation coefficient (r). Steiger's Z test was used to determine whether differences between correlation coefficients were statistically significant.27 Stepwise multiple linear regression was carried out to determine the main predictors of 6MWD.
Lung volumes pre- and post-6MWT were compared using the t test for paired samples after normal distribution was confirmed with the Shapiro-Wilk test.28 Data are reported as mean ± SD unless otherwise stated. All tests were 2-sided. A P < .05 and a Z > 1.96 were considered statistically significant. Data were analyzed with GraphPad Prism 5 (GraphPad Software, San Diego, California), SPSS 22 (SPSS, Chicago, Illinois), and FZT Computator (Calvin P Garbin, University of Nebraska-Lincoln, Lincoln, Nebraska).
Results
Subject Characteristics
All of the 45 subjects completed the study protocol and met the timing requirements. Subject characteristics are shown in Table 1. Most of the subjects showed moderately severe to very severe ventilatory defects. None of the subjects had participated in pulmonary rehabilitation programs in the previous 6 months.
Baseline Data of Subjects
Response to Exercise
The mean 6MWD was 341 ± 84 m. In post-6MWT lung volumes, there was a significant increase in TLC, FRC, RV, RV%TLC, and FEV1, as well as a significant decrease in inspiratory capacity and inspiratory vital capacity compared with pre-6MWT measurements (Table 2). In addition, there was a significant post-6MWT decrease in SpO2 and a significant increase in Borg scale and heart rate (Table 2).
Assessed Parameters Before and After 6-Min Walk Test
Correlations Between 6MWD and Functional Parameters
In both the pre- and post-6MWT measurements, there were significant correlations between 6MWD and FRC, RV, RV%TLC, inspiratory capacity, inspiratory vital capacity, FVC, and FEV1. No significant correlations could be observed between 6MWD and absolute values of TLC, whereas the correlations between 6MWD and percent of predicted TLC values were significant pre- and post 6MWT. In addition, there was a significant correlation between 6MWD and post-6MWT Borg-scale values. FEV1 and RV%TLC showed the strongest correlations with 6MWD in the pre- and post-6MWT measurements, respectively (Table 3).
Correlations Between 6-Min Walk Distance and Functional Parameters Before and After 6-Min Walk Test
Comparison of 6MWD Correlations
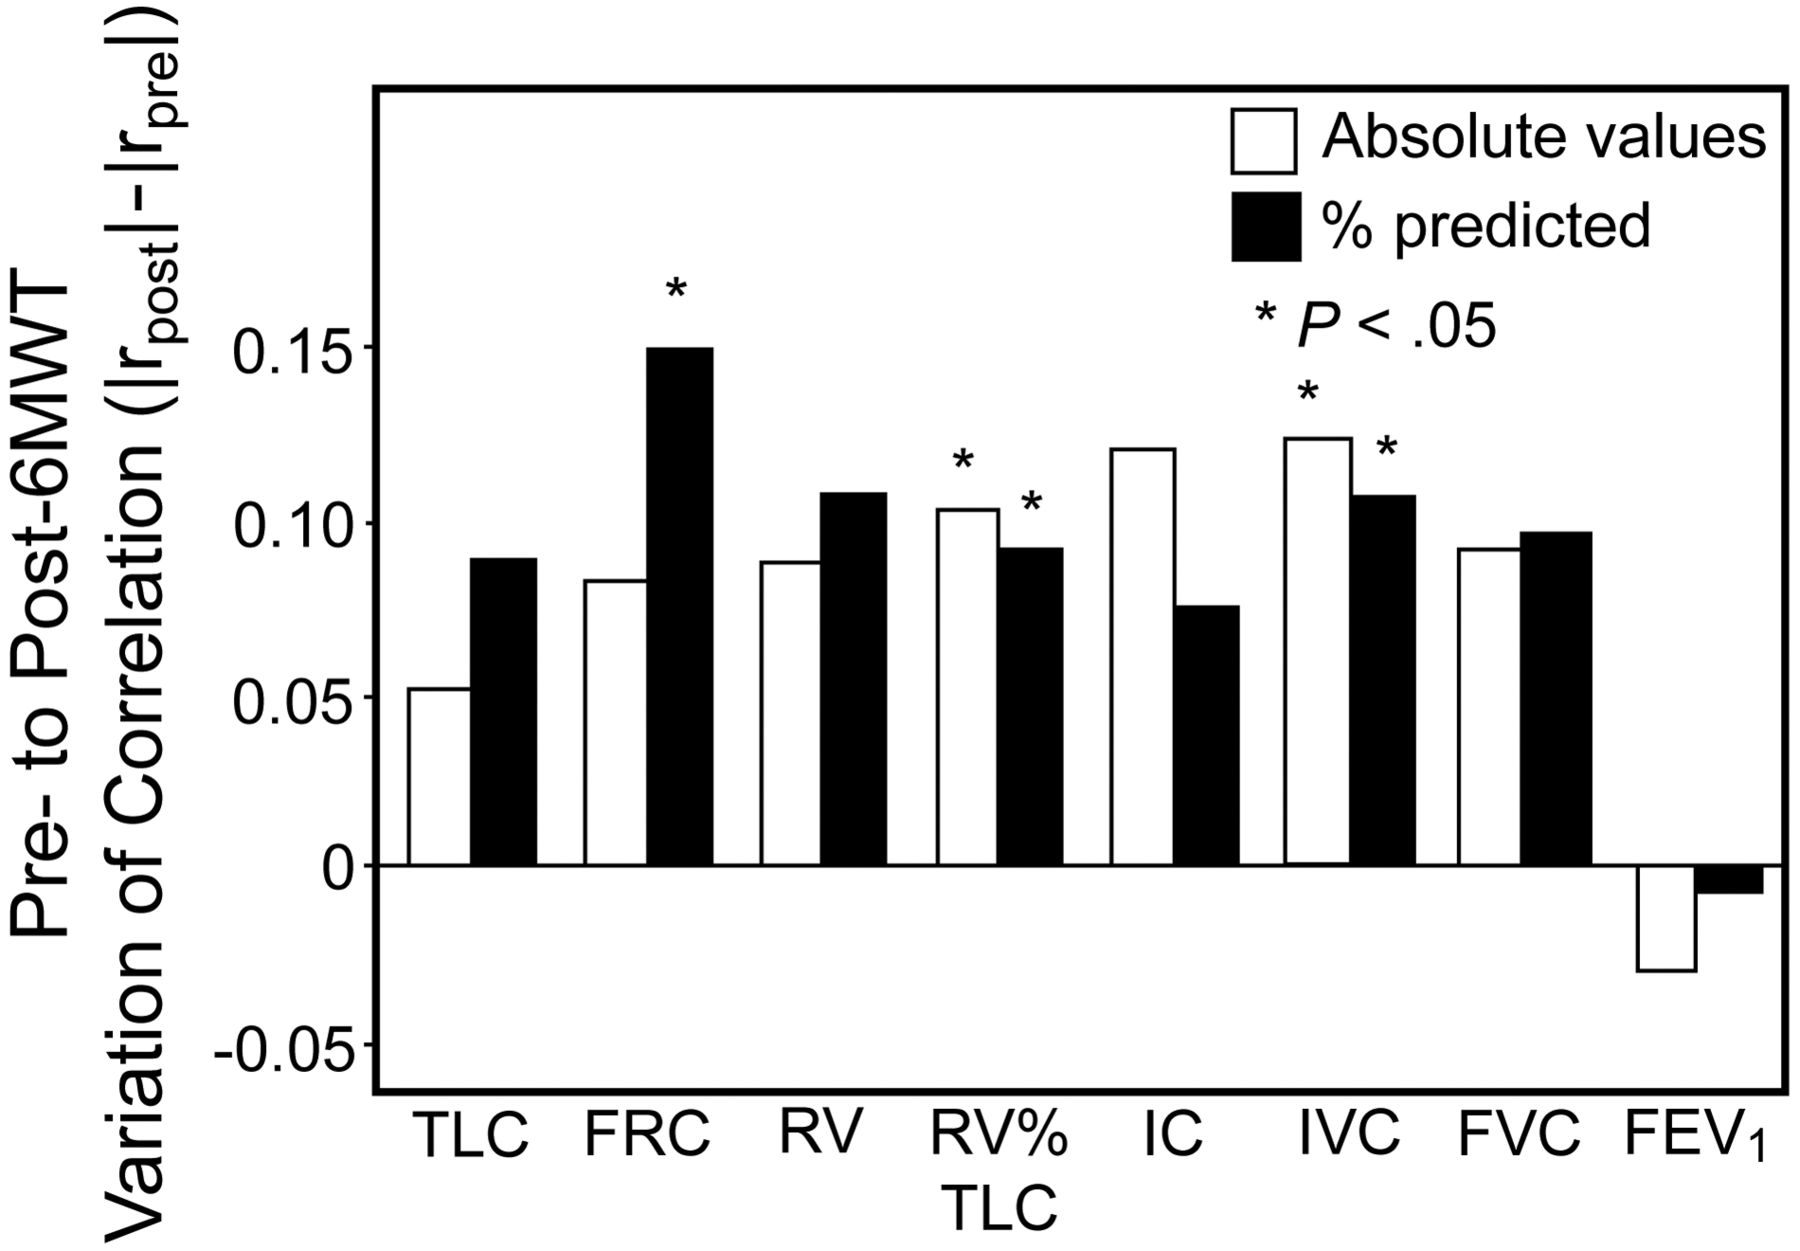
Correlations were generally stronger between 6MWD and post-6MWT measurements than between 6MWD and pre-6MWT measurements, except for FEV1 and heart rate, which showed stronger 6MWD-correlations with the pre-6MWT values. These differences in correlation coefficients were significant for RV%TLC, percent of predicted RV%TLC, inspiratory vital capacity, percent of predicted inspiratory vital capacity, percent of predicted FRC, and Borg scale (Table 3, Figs. 1 and 2).

Pre- to post-6-min walk test (6MWT) variation in Pearson correlation coefficients. Correlations between 6-min walk distance (6MWD) and lung volumes were generally stronger after 6MWT than before 6MWT, except for FEV1. TLC = total lung capacity; FRC = functional residual capacity; RV = residual volume; IC = inspiratory capacity; IVC = inspiratory vital capacity; FVC = forced vital capacity.

Correlation between 6-min walk distance (6MWD) and measures of functional residual capacity (FRC) and FEV1. The correlation between 6MWD and FRC is significantly stronger (r = −0.62 vs r = −0.47; P = .023) after 6-min walk test (6MWT; B) than before 6MWT (A), whereas the correlation between 6MWD and FEV1 remains almost unchanged (r = 0.65 vs r = 0.66; P = .76).
Correlations between 6MWD and variations of the functional parameters (ie, post-6MWT values minus pre-6MWT values) were not significantly different from correlations between 6MWD and pre-6MWT measurements, except for FEV1, which showed a stronger 6MWD correlation in the pre-6MWT measurements (Table 4).
Correlations Between 6-Min Walk Distance and Pre- to Post–6MWT Variation (ie, Post–6MWT Values Minus Pre–6MWT Values) in Functional Parameters
Stepwise Multiple Linear Regression
Stepwise multiple linear regression using anthropometric and pre-6MWT pulmonary function parameters showed that pre-6MWT FEV1 was the only significant independent determinant of 6MWD, even when pre-to-post 6MWT variations of the pulmonary function parameters (ie, post-6MWT values minus pre-6MWT values) were additionally included in the analysis. When the same variables, together with post-6MWT pulmonary function parameters, were included in further stepwise regression analyses, only post-6MWT RV%TLC remained as a significant independent determinant of 6MWD. Using percentage of predicted lung volumes instead of absolute values did not change the predictor variables retained by the stepwise multiple linear regression analyses.
Discussion
This study demonstrated that, in subjects with COPD, lung volumes measured immediately after 6MWT are more closely related to walking distance than baseline lung volumes measured before 6MWT. This effect could be observed for all assessed lung volumes except for FEV1, with the most pronounced difference found in percent of predicted FRC (r = −0.62 vs r = −0.47, P = .023).
To our knowledge, this is the first study to compare the relation of exercise capacity with lung volumes before and after 6MWT in subjects with COPD based on body plethysmography data.
However, the present findings are supported by results of previous studies demonstrating similar correlations between parameters of exercise capacity and pulmonary function in subjects with COPD. Several studies examined the relation of exercise tolerance, expressed as V̇O2peak determined by cycle ergometry, and baseline lung volumes at rest and reported significant correlations in the range of 0.45–0.75 for FEV1, 0.62–0.71 for FVC, and 0.45–0.81 for inspiratory capacity.7,18,29,30 Other studies assessed exercise capacity by means of the 5- or 6-min walk distance and reported significant correlations to baseline lung volumes at rest in the range of 0.22–0.55 for FEV1, 0.29–0.54 for FVC, and 0.42–0.57 for inspiratory capacity.8,9,11,16,17,31–36
Wijkstra et al9 assessed the relation of baseline pulmonary function parameters at rest with 6MWD and maximal cycle ergometry work load in subjects with COPD who performed both exercise tests on 2 consecutive days. For both 6MWD and maximal work load, they reported significant correlations with FEV1 (r = 0.55 and r = 0.58) and with FVC (r = 0.51 and r = 0.50). The correlation between RV and exercise capacity was significant in the walking test (r = −0.41) but not in the cycle exercise test. Similar to the present results, absolute values of baseline TLC at rest did not show significant correlation to exercise capacity.
Few studies examined the relation between exercise capacity and post-exercise pulmonary function parameters in subjects with COPD. Marin et al8 found significant correlations between 6MWD and inspiratory capacity (expressed as % of TLC) before 6MWT (r = 0.41) and after 6MWT (r = 0.52). This increase in the correlation coefficient is very similar to the pre- to post 6MWT variations observed in the present study. In addition, in the same study, Marin et al8 assessed the correlation between the pre- to post-6MWT change in inspiratory capacity (expressed as % of TLC) and 6MWD, which—in contrast to inspiratory capacity (expressed as % of TLC) measured before and after 6MWT—did not reach statistical significance, similar to the findings observed in the present study. Similarly, Callens et al11 reported a significant correlation between 6MWD and inspiratory capacity before 6MWT (ρ = 0.41), whereas the pre- to post-6MWT change in inspiratory capacity was not significantly correlated with 6MWD.
These and the present findings consistently demonstrate that, despite the weak relation between exercise capacity and pre- to post-6MWT changes in lung volumes (ie, post-6MWT values minus pre-6MWT values), exercise capacity in subjects with COPD is significantly correlated with lung volumes measured before exercise and particularly with lung volumes measured immediately after exercise. This suggests that, when performing assessment of post-exercise lung volumes, analyses should focus on the actual magnitude of post-exercise lung volumes rather than looking at relative increases or decreases from baseline.
In the present analysis, FEV1 showed strong correlations with 6MWD before and after 6MWT, and there was no evidence that post-6MWT correlations between FEV1 and 6MWD were significantly affected by physical exercise. However, the correlations of other pulmonary function parameters with 6MWD were stronger after 6MWT than before 6MWT, and these differences were statistically significant for FRC, RV%TLC, and inspiratory vital capacity. This suggests the presence of ventilatory constraints to exercise that develop during physical activity and that cannot be adequately assessed on the basis of baseline pulmonary function testing at rest.
Although exercise limitation is multifactorial in COPD and reflects a complex combination of ventilatory, cardiovascular, metabolic, muscular, and psychological factors that varies among individuals, impairment of ventilatory mechanics has steadily emerged in several detailed physiological studies as an essential determinant of exercise capacity.10,12,18,37 Considerable evidence has accumulated that exercise-induced dynamic lung hyperinflation may represent an important factor contributing to exercise intolerance in subjects with COPD.12,18 Previous studies demonstrated that dynamic hyperinflation can be measured after submaximal exercise such as 6MWT in subjects with COPD.8,11,26 Accordingly, in the present study, dynamic hyperinflation could be observed, as reflected by a significant decrease in inspiratory capacity and inspiratory vital capacity as well as an increase in FRC, RV, and RV%TLC after the 6MWT. Whether the observed increase in TLC (0.25 L, P = .004) can be attributed to a possible methodological artifact of the “linked maneuver” during pulmonary function testing, or reflects hypothetical pathophysiological processes due to greater neural drive to the inspiratory muscles during exercise similar to mechanisms that have been proposed in literature on acute asthma, remains unexplained.38,39 In 1980, Stubbing et al40 reported in a study on 6 male subjects with air flow obstruction, who underwent lung function measurements during exercise in a body plethysmograph containing pedals of a cycle ergometer, an increase in RV (0.45 L, P < .02) and FRC (0.30 L, not significant) during submaximal exercise, whereas TLC did not change considerably (−0.01 L, not significant). Since then, despite the low statistical power of that study, there has been little research on the effects of exercise on TLC in subjects with COPD. Recently, 2 studies assessed TLC before and immediately after submaximal exercise using body plethysmography and reported an increase of 0.14 L (not significant) and 0.58 L (P < .05) in 17 and 20 subjects with COPD, respectively.26,41 The experience gained from body plethysmography measurements after exercise in the present study and previous reports therefore warrants further and detailed studies on the effects of exercise on TLC in subjects with COPD.
The current study was driven by the hypothesis that, due to the development of dynamic hyperinflation during exercise, end-exercise pulmonary function could be more closely related to exercise capacity than resting pulmonary function at baseline. Although the present findings clearly support this hypothesis, these results cannot prove that the stronger correlation of post-exercise pulmonary function is caused by dynamic hyperinflation. In fact, considering the limited information from past literature, it can only be speculated what the reasons for this effect may be, and it cannot be excluded that, apart from dynamic hyperinflation, there might be other factors contributing to the observed variation in correlation coefficients. Nevertheless, the present results obtained from stepwise multiple regression analyses might provide some evidence of the important statistical contribution of post-exercise hyperinflation, reflected by post-6MWT RV%TLC, in explaining the variance in 6MWD. However, there are known shortcomings of stepwise multiple regression, and, therefore, results should be interpreted with caution. Slight changes in the correlations of the independent variables could result in a completely different choice of the best predictors, particularly when independent variables are highly correlated with each other and with the dependent variable.42,43 This might partly explain the inconsistencies among previous reports on the determinants of 6MWD in subjects with COPD.8,9,17,35
Traditionally, in subjects with COPD, the measurement of baseline lung volumes at rest serves as an accepted standard for the assessment of respiratory impairment and is employed as an end point in the vast majority of pharmacologic trials.2,44 The results of the present study demonstrate that the measurement of lung volumes after 6MWT in subjects with COPD can be easily employed and can provide additional information on pulmonary function since the results are more closely related to exercise limitation than traditional pulmonary function tests at rest. This finding should have important implications for future clinical trials assessing pulmonary function and effects of treatment in subjects with COPD.
In addition to pulmonary function parameters, SpO2, heart rate, and Borg scale values taken before and after 6MWT were evaluated in the present analysis. Similar to previous studies, pre-6MWT SpO2, post-6MWT SpO2, and ΔSpO2 showed only weak 6MWD correlations.32,33 Two other studies45,46 suggested that, in contradiction to the ATS statement19 on 6MWT, constant SpO2 monitoring during the 6MWT should be performed to assess the nadir of SpO2 during the walk, but correlation between 6MWD and ΔSpO2 (r = 0.10; not significant) reported in a previous study that defined ΔSpO2 as the change in SpO2 from baseline to the nadir during the walk was similar to the present findings.36 In the present study, mean post-6MWT heart rate was found to be within the range between 97 and 119 beats/min published in previous studies36,47 and neither pre-6MWT heart rate, post-6MWT heart rate, nor Δheart rate correlated significantly with 6MWD. In agreement with these findings, 3 similar studies reported correlations between 6MWD and heart rate that were either weak or not statistically significant.32,34,48 However, in male COPD subjects without cardiovascular disease or arrhythmias, another study reported a significant correlation between 6MWD and Δheart rate (r = 0.51, P = .005).36 Similarly, the correlations of Borg-scale values with 6MWD in the present study are similar to those reported in previous studies, although there are some inconsistencies in current literature. Two studies reported a significant 6MWD correlation with ΔBorg similar to the present findings.36,48 The correlation of pre-6MWT Borg-scale values and 6MWD was not significant in the present study, but Wijkstra et al9 reported a significant correlation in a previous study. 6MWD correlation with post-6MWT Borg-scale values was significant in the present study similar to the findings of Freitas et al,33 but Camargo et al32 did not find a significant correlation.
However, the study has some limitations. The pre- and post exercise lung volumes reported in this study are pre-bronchodilator measures. Therefore, the present findings cannot simply be transferred to post-bronchodilator measures, because the effects of bronchodilation on the correlations between exercise capacity and lung volumes have not yet been explored in current literature. It could be expected that the effects of short-acting bronchodilators on pre-exercise correlations might be different from those on post-exercise correlations due to pharmacodynamic mechanisms and due to the known effects of bronchodilation on dynamic hyperinflation.49–51 Similarly, it could also be speculated as to whether the use of pre-bronchodilator measures in the present study has contributed to the fact that the correlation between pre-6MWT FEV1 and 6MWD is stronger than those reported before in similar studies where post-bronchodilator data might have been used, although there may be a variety of other potential confounding factors in previous studies such as selection bias, restriction of the range of disease severity, use of different exercise protocols, or repetitive exercise tests.8,9,11,16,17,31–36 In addition, the findings of the present study cannot simply be transferred to studies that use one or more training walks before the 6MWT, because it is unknown whether learning and fatigue effects discussed in current literature affect the correlations between 6MWD and lung volumes.52 Similarly, it is currently unknown whether oxygen supplementation, as administered to subjects on chronic oxygen therapy in the present study, could have influenced the correlation between 6MWD and pulmonary function parameters. Another limitation of the present study is the heterogeneity of the study population with a wide range of ventilatory defects. It could be expected that the observed effects vary depending on specific subject characteristics or disease severity, and, therefore, further studies are warranted focusing on particular target populations.
Conclusions
This study demonstrated that, in subjects with stable COPD, lung volumes measured immediately after 6MWT are more closely related to walking distance than baseline lung volumes measured before 6MWT, except for FEV1. These findings implicate that comprehensive pulmonary function testing immediately after exercise should be included in future studies on COPD for the assessment of ventilatory constraints to exercise that develop during physical activity and that cannot be adequately assessed on the basis of baseline pulmonary function testing at rest.
Acknowledgments
We thank the members of the clinical research assistant team.
Footnotes
- Correspondence: Thomas Wibmer MD, Department of Internal Medicine II, University Hospital of Ulm, Albert-Einstein-Allee 23, 89081 Ulm, Germany. E-mail: thomas.wibmer{at}gmx.de.
The authors have disclosed no conflicts of interest.
- Copyright © 2014 by Daedalus Enterprises


