

Abstract
BACKGROUND: The patterns and kinetics of changes in SpO2 in the 6-min walk test (6MWT) and cycling test have not been addressed in patients with COPD.
METHODS: We studied 60 COPD subjects, with a mean ± SD FEV1 of 54 ± 18% of predicted. We compared the changes in SpO2 (ΔSpO2) within and between the 2 tests, and the differences between the desaturators and non-desaturators.
RESULTS: In the 6MWT there were 4 patterns of SpO2. Desaturation then resaturation was the most common (46%). ΔSpO2 ≥ 3% occurred at approximately 1.2 min, and the nadir was at 3.5 min where resaturation occurred thereafter. The ΔSpO2 between the start and the nadir (start-vs-nadir ΔSpO2) was greater than the start-vs-end ΔSpO2 (P < .001). The desaturators had less inspiratory muscle strength, worse dyspnea, and shorter 6-min walk distance, whereas the resaturators had greater FEV1/FVC and less functional residual capacity (all P < .05). In the cycling test there were 3 patterns of SpO2. Desaturation was the most common (57%). The ΔSpO2 ≥ 3% and nadir SpO2 occurred at 4.6 min and 6.6 min, respectively, of the 6.8-min cycling exercise duration. The desaturators had lower body mass index, lower oxygen-cost diagram score, less post-exercise inspiratory muscle strength, lower diffusing capacity, lower SpO2, lower work during 6MWT, and lower peak exercise performance (all P < .05). In both tests, the start-vs-nadir ΔSpO2 during the 6MWT was greater (P = .02) but the start-vs-end ΔSpO2 was similar (P = .79). The desaturators in both tests had lower oxygen-cost-diagram scores (P < .01) and poorer peak exercise performance.
CONCLUSIONS: Measurement of start-vs-nadir ΔSpO2 rather than start-vs-end ΔSpO2 during the 6MWT is recommended, because start-vs-nadir ΔSpO2 is greater, and the nadir SpO2 is earlier. In both the 6MWT and the cycling exercise test, desaturation can be predicted with the oxygen-cost-diagram score, which has more capability to predict peak exercise performance than the 6MWT.
Introduction
Walking may induce hypoxemia or oxyhemoglobin desaturation (saturation of hemoglobin via pulse oximeter; decrease in SpO2) more profoundly than does cycling in patients with COPD.1–5 The differences in the change (Δ) in PaO2 or SpO2 between walking and cycling are due to utilizing different muscle groups for ventilatory compensation for exercise demand.1,3,6,7 However, the results of previous reports have been inconsistent,8,9 perhaps due to differences in the definitions of desaturation, modes of exercise, and patient populations.10
The patterns and kinetics of SpO2 during different exercise modes may also influence the magnitude of ΔSpO2. There are 3 types of SpO2 change during the 6-min walk test (6MWT): desaturation increases throughout the test, no desaturation,4 and desaturation then resaturation during the last few minutes.4,9,11 But these SpO2 patterns have rarely been reported. ΔSpO2 during the 6MWT may be influenced by the patient's COPD stage4,12,13 and by the test protocol, which is self-pacing,14 conducted with “neutral” verbal encouragement, and with rest allowed.5,11 ΔSpO2 during the incremental cycling test may also be influenced by COPD stage15,16 but only rarely by differences in the test protocol, which is computer-controlled, conducted with verbal encouragement, and continuous to symptom-limited exhaustion.
We hypothesized that 3 ΔSpO2 patterns may occur in one individual test, and that the nadir SpO2 may occur midway during the 6MWT, so merely subtracting the end PaO27 or SpO217 from the start PaO2 or SpO2 may be inappropriate.11 We investigated how the patterns and kinetics of ΔSpO2 differ in the 6MWT and the cycling exercise test, and the differences between subjects with and without desaturation.
QUICK LOOK
Current knowledge
The 6-min walk test is the standard for determining exercise intolerance in patients with chronic lung disease. The kinetics of oxygen desaturation during the 6-min walk test versus during cycle ergometry has not been directly compared in patients with COPD.
What this paper contributes to our knowledge
Monitoring SpO2 and recording the ΔSpO2 between the starting SpO2 and the nadir SpO2 was superior to determining the ΔSpO2 between the beginning and end of the test. Exertional desaturation in both tests predicted poorer peak exercise performance than did walking performance.
Methods
The Institutional Review Boards of Chang Gung Memorial Hospital and Chung Shan Medical University Hospital approved this study (study numbers CMRP443 and CS11144), and all of the subjects provided written informed consent. A cohort of COPD subjects underwent the 6MWT and symptom-limited cycling test in random order.
Subjects
The diagnosis of COPD was based on the Global Initiative for Chronic Obstructive Lung Disease criteria.18 All the subjects were clinically stable for 1 month before undergoing the 2 exercise tests, which were conducted within 2 weeks of each other. We excluded patients who had important comorbidities, needed home oxygen, or participated in any physical training program during this study.
Protocols and Measurements
Oxygen-Cost Diagram.
The oxygen-cost diagram was used as a scale for daily activities, assessed by the subjects themselves. The subjects were asked to indicate a point on an oxygen-cost diagram, a 100-mm long vertical line with everyday activities listed alongside the line, spaced according to the oxygen requirement associated with the performance of each task, above which their breathlessness limited them.19 The distance from zero was measured and scored.
Pulmonary Function Testing.
Pulmonary function tests were performed before the exercise tests. The FVC, FEV1, forced expiratory flow during the middle half of the FVC maneuver, TLC, and RV were measured by pressure-sensitive body plethysmography (6200 Autobox DL, SensorMedics, Yorba Linda, California). The best of 3 technically satisfactory readings was used.20,21 All lung function data were obtained after inhaling 400 μg of fenoterol HCl. The diffusing capacity of the lung for carbon monoxide (DLCO) was measured with the single-breath technique. Simple volume calibration was done using a 3-L syringe before each test.
The maximum inspiratory pressure, indicating inspiratory muscle strength, was measured (MicroRPM, Micro Medical/CareFusion, San Diego, California), starting at residual volume, with a nose clip in place, with forceful inspiratory maneuver with sustained maximal effort for 1–3 s. Maximum expiratory pressure, for expiratory muscle strength, was measured starting at TLC. Both maximum inspiratory pressure and maximum expiratory pressure were performed, before and after the cycling test, with a 1-min recovery period in between. The best result was recorded for analysis.
6-Min Walk Test.
The 6MWTs were conducted in a temperature-controlled, 20-m corridor. Blood pressure and breathing frequency were measured. Dyspnea was measured with the modified Borg scale,22 at rest, midway, and at the end of the walk. The 6MWT was conducted with the help of verbal encouragement, per the American Thoracic Society recommendations.14 SpO2 and pulse rate (3760, Datex-Ohmeda/GE Healthcare, Madison, Wisconsin, or N-595, Nellcor/Covidien, Boulder, Colorado) were continuously measured, to maximize the signal and minimize motion artifacts. The signals were stable before the recording, and were stored as 4-s averages. However, the data in this report are for each minute only.
The pulse oximeters were validated with arterial blood gas analysis.12 The ΔSpO2 patterns were identified and classified independently by 2 investigators. Consensus was reached after discussion if there were any discrepancies. The ΔSpO2 values are reported as start-vs-nadir ΔSpO2 and start-vs-end ΔSpO2. The minimum clinically important SpO2 difference was defined as a ≥ 3% decrease after the start of exercise.12
Each subject performed the 6MWT twice, with a > 30 min rest in between. The longest distance walked was recorded, and the work of walking was calculated as distance in kilometers times body weight in kilograms.9
Maximum Cardiopulmonary Exercise Test.
After a 2-min rest from the mounting the computer-controlled, electronically braked cycle ergometer (Lode, Corival, Groningen, Netherlands), each subject began a 2-min period of unloaded cycling, followed by a ramp-pattern exercise test to the limit of tolerance. The work rate was set to increase at 5–20 watts per min, according to pre-determined fitness, based on a derived protocol formula.23
Heart rate, SpO2, oxygen uptake, carbon dioxide output, minute volume, blood pressure, and Borg dyspnea score were measured. Pulse rate and SpO2 (3740, Datex-Ohmeda/GE Healthcare, Madison, Wisconsin, or 7500, Nonin, Plymouth, Minnesota) were measured continuously. The pneumotachograph was calibrated with a 3-L syringe before each test. The O2 and CO2 analyzers were calibrated with standard gases.
Statistical Analysis
Data are reported as mean ± SD. Unpaired and paired t tests were used to compare the means between the 2 independent groups and 2 dependent groups, respectively. The chi-square or Fisher exact test was used to compare the proportion of the categorical variables between the 2 groups. One-way analysis of variance was used to compare the 3 groups of consistent changes in the variables. All tests were 2-sided, and statistical significance was set at P < .05. All statistical analyses were performed with statistics software (SAS 9, SAS Institute, Cary, North Carolina, and Origin 4.0, MicroCal/GE Healthcare, Little Chalfont, Buckinghamshire, United Kingdom).
Sample Size and Power Calculations.
The changes in SpO2 between start and nadir (start-vs-nadir ΔSpO2) during the 6MWT were the primary outcomes. Using statistics software (NCSS 9, NCSS, Kaysville, Utah) we estimated that a sample size of 21 subjects in each group would be required to detect a ΔSpO2 of 3% with a standard deviation of the change of 4%,9 statistical power of 0.90, and alpha of .05.
Results
We enrolled 60 subjects (Table 1), 37 at Chang Gung Memorial Hospital and 23 at Chung Shan Medical University Hospital. Most had stage II or stage III COPD, with elevated static air trapping and mildly impaired diffusing capacity.
Demographic and Lung Function Data From 60 Subjects With COPD
6-Min Walk Test
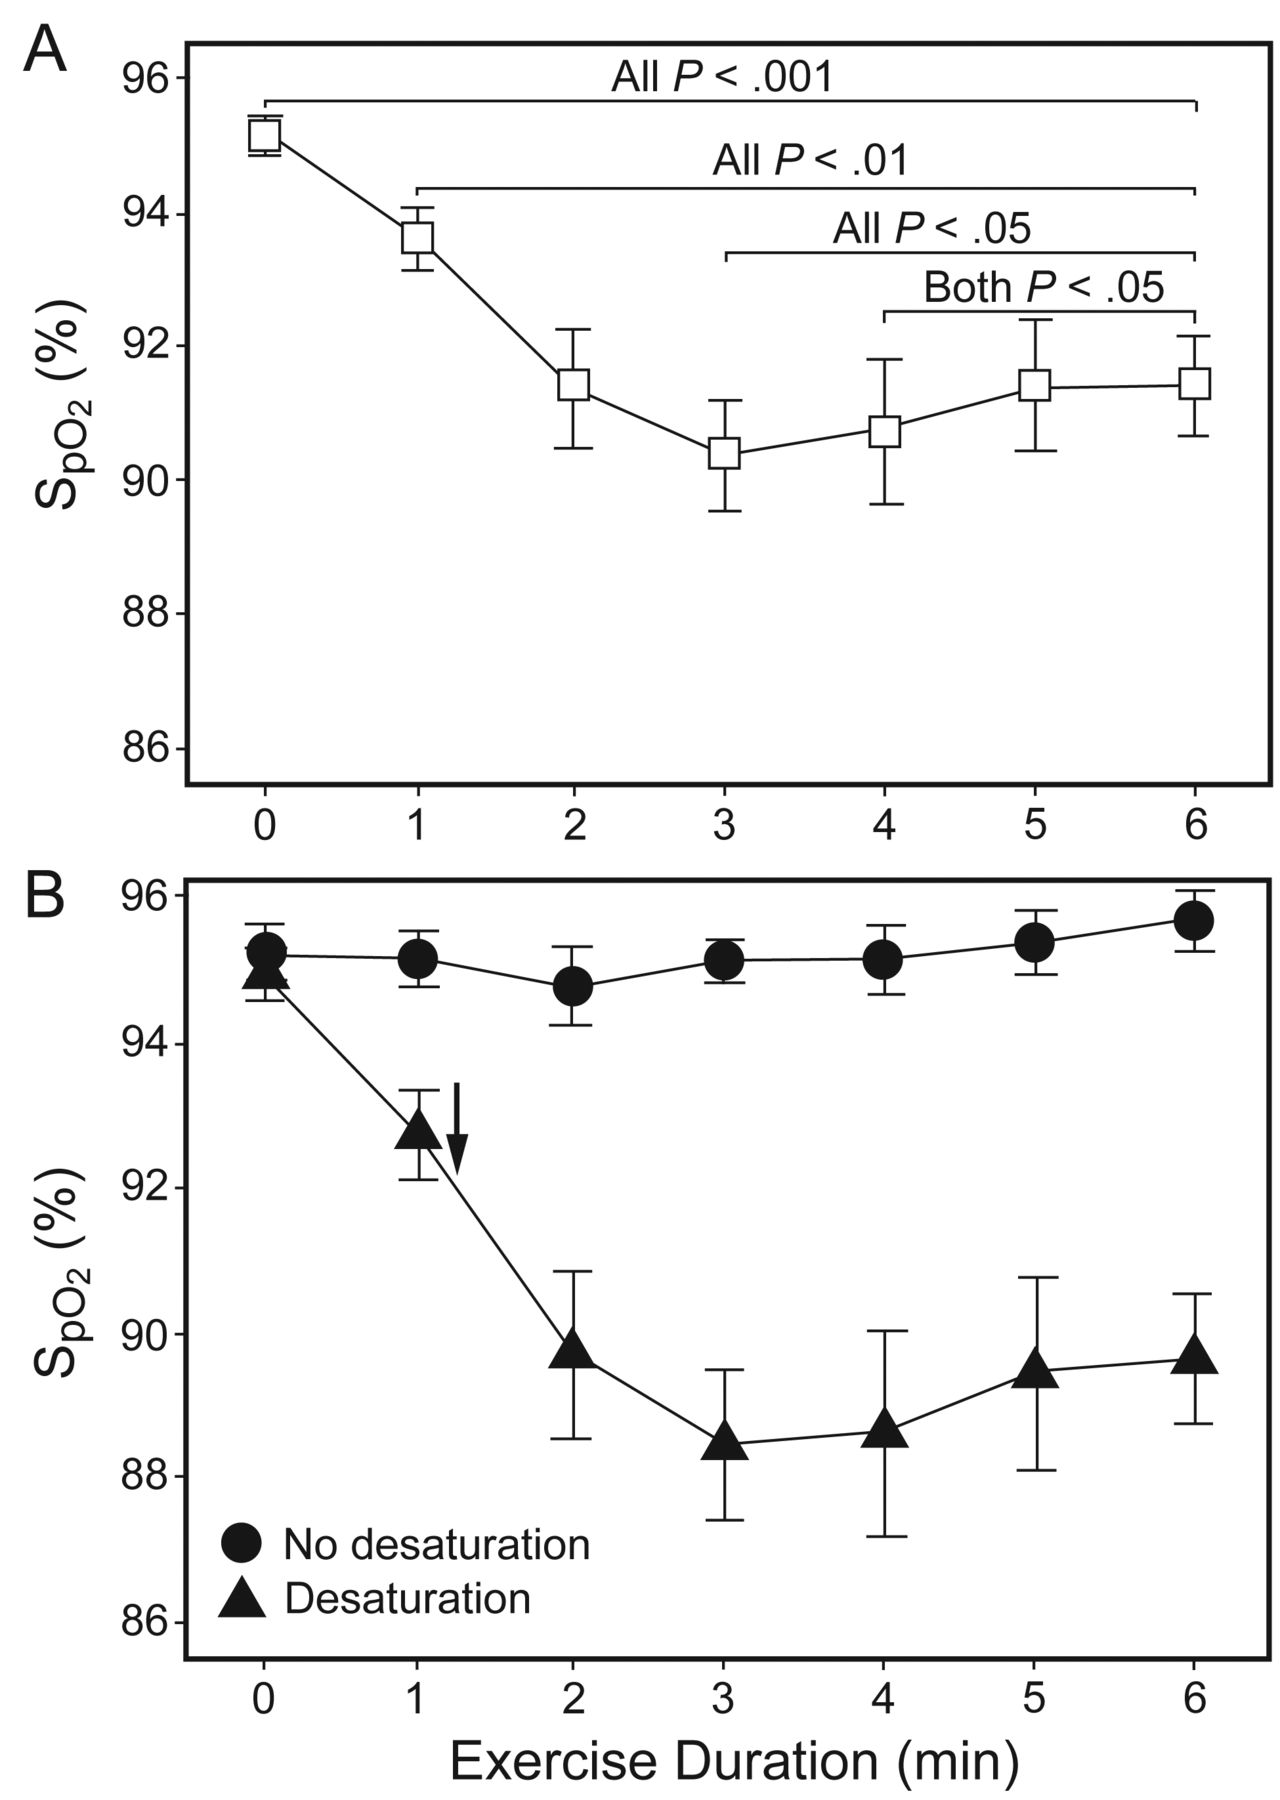
All the subjects completed the 6MWT, but 3 were excluded due to unstable baseline recordings. Overall, the start-vs-end ΔSpO2 was 3.7 ± 5.1% (P < .001) (Table 2, Fig. 1) and 70% of subjects had desaturation (ΔSpO2 ≥ 3%) at 1.2 min (see Fig. 1B, P < .001). The desaturation group (n = 40 of the total 57) was further separated into 3 subgroups: 3 (5%) of 57 subjects desaturated after the third minute; 26 (46%) subjects desaturated (7.8 ± 5.6%, P < .001) during the first 3 min and then began to resaturate at 3.5 ± 1.4 min (see Table 2 and Fig. 2); and 11 (19%) subjects began desaturating immediately and did not resaturate during the 6MWT. The mean start-vs-end ΔSpO2 was less than the start-vs-nadir ΔSpO2 (P < .001).
SpO2 and Exercise Duration

A: Mean ± SD SpO2 in all 57 subjects during the 6-min walk test. B: Mean ± SD SpO2 in subjects with (n = 40) and without (n = 17) desaturation. The arrow indicates the point at which SpO2 had decreased by 3%, which we considered the minimum clinically important desaturation.
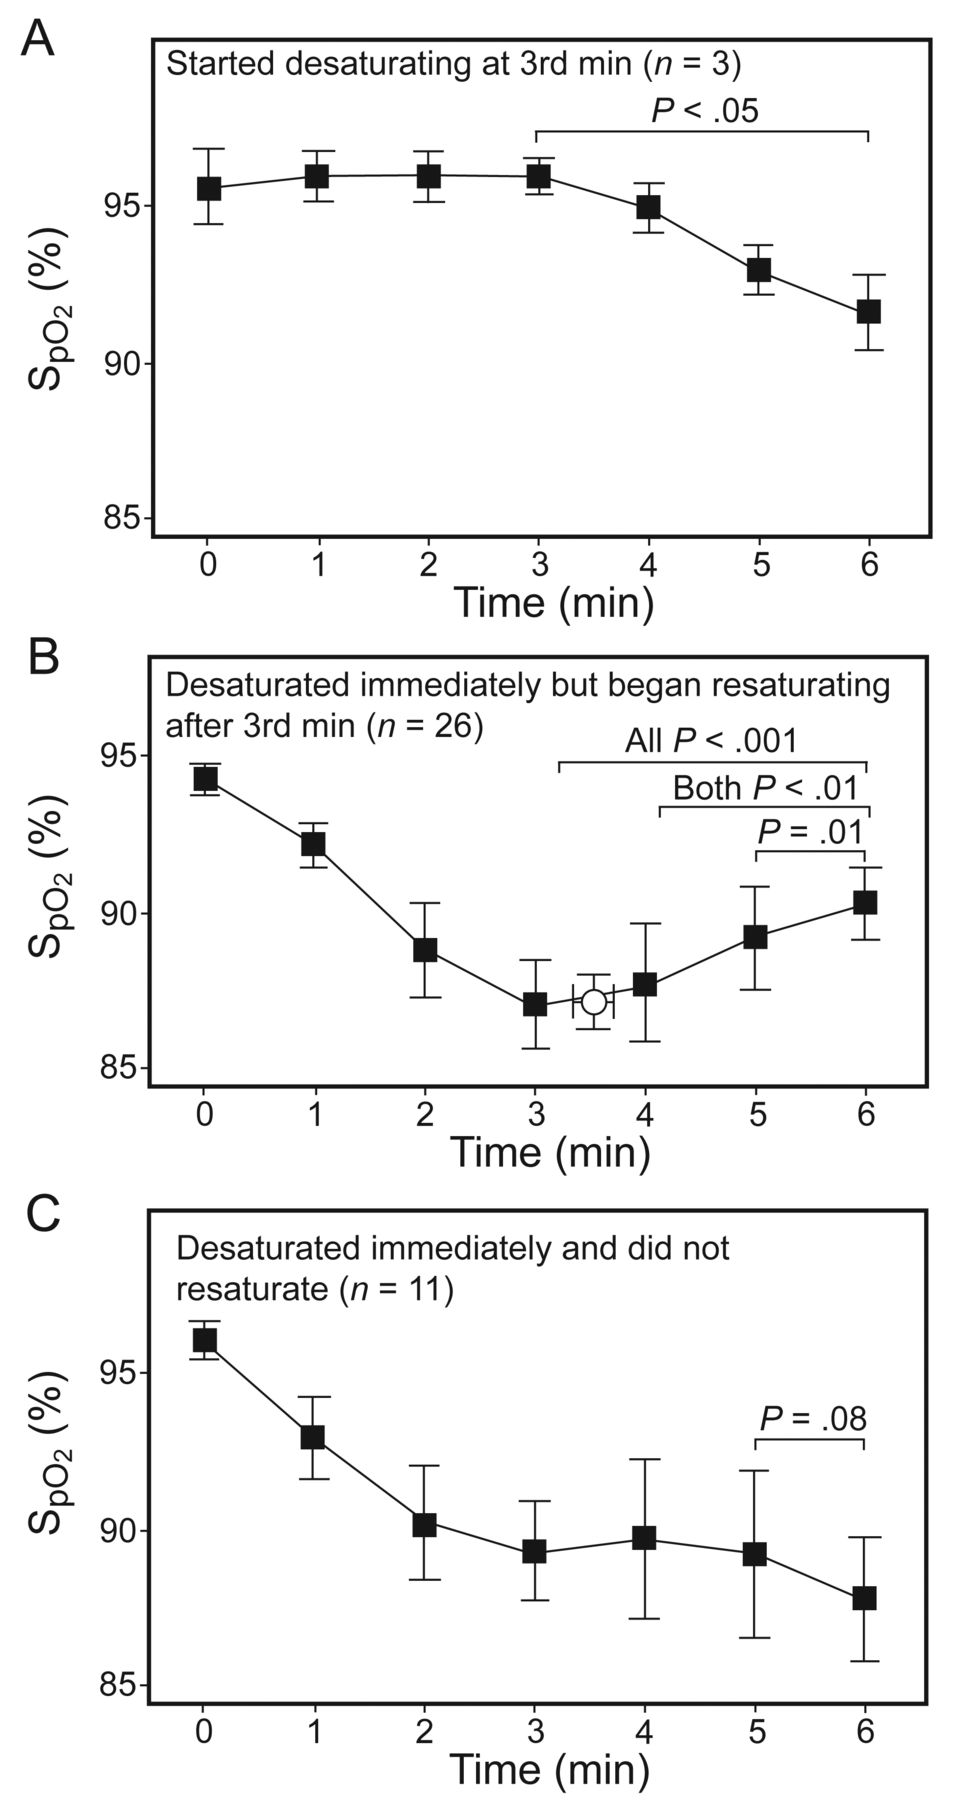
SpO2 during the 6-min walk test in the 40 subjects who desaturated. A: Three subjects who started desaturating after the third minute and did not resaturate (all P < .05 for the comparison of the mean SpO2 with the third minute). B: Twenty-six subjects who began desaturating immediately but then resaturated (the open circle indicates the SpO2 nadir at 3.5 ± 1.4 min, P < .001 for the comparison of the SpO2 of the fifth and sixth minutes with the third minute; P < .001 for the comparisons of the fifth and sixth minute with the fourth minute; P < .01 for the comparison of the sixth minute with the fifth minute). C: Eleven subjects who began desaturating immediately and continued desaturating throughout the test (P = .08 for the comparison of the sixth minute with the fifth minute).
The 40 subjects (70%) with desaturation during the 6MWT had significantly less inspiratory muscle strength (P = .01), worse dyspnea (P = .03), and shorter walk distance (P = .05) than the subjects without desaturation (Table 3). Subjects with desaturation then resaturation had greater FEV1/FVC (P = .01) and less air trapping (P = .047) than those with desaturation.
Physiologic Data From Subjects Who Conducted the 6-Minute Walk Test
Cycling Test
Fifty of the 60 subjects completed the symptom-limited cycling test. Thirteen were excluded (10 did not want to perform the test, and 3 had technical difficulties) so SpO2 analysis was performed on the data from 47 subjects (see Table 2).
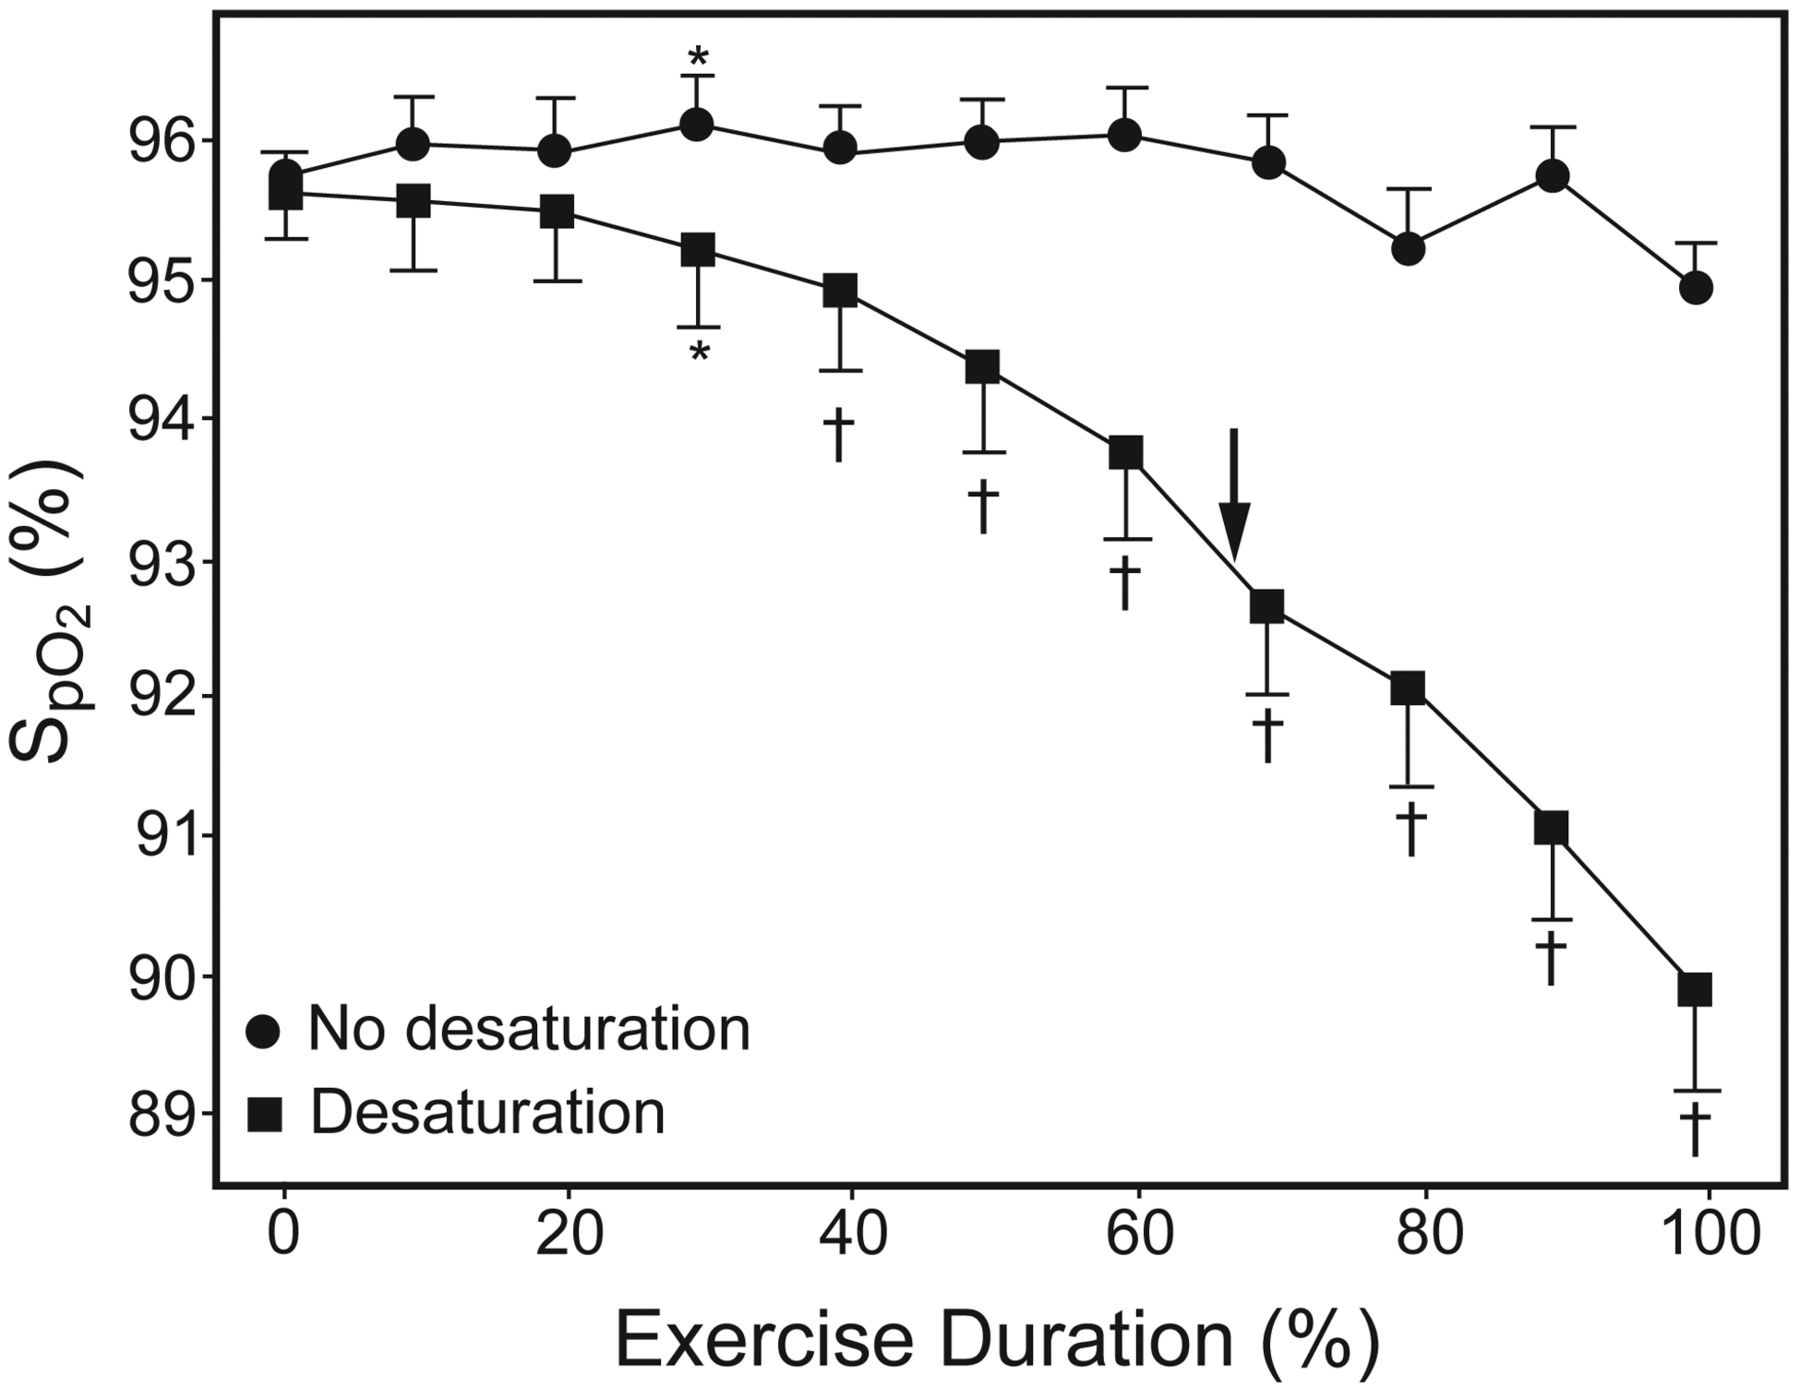
There were 2 typical SpO2 patterns during the cycling test (Fig. 3). Two subjects had irregular ΔSpO2 patterns, which are not shown in Figure 3. In total, 27 (57%) of the 47 subjects desaturated during the cycling test. Desaturation was initially detected at approximately 30% of the loaded exercise (ie, at approximately 2 min in the 6.8-min exercise duration). ΔSpO2 ≥ 3% was detected at 68% of the loaded exercise (ie, at approximately 4.6 min of the total exercise duration), and the nadir SpO2 at 97% (ie, 6.6 min of the total exercise duration) (see Table 2 and Fig. 3). The subjects who desaturated had lower body mass index and oxygen-cost-diagram score, poorer lung function, more tachypnea and dyspnea, and lower work of walking during the 6MWT. They also had poorer cardiopulmonary function during the peak exercise test (Table 4).

SpO2 during the cycling test in 45 subjects: 18 who did not desaturate ≥ 3%, and 27 who desaturated ≥ 3%. * P < .05 and † P < .001 for comparison with SpO2 at the start of the cycling test. The arrow indicates the point at which SpO2 had decreased by 3%, which we considered the minimum clinically important desaturation.
Physiologic Data and Test Results From Desaturators Versus Non-desaturators in the Cycling Test
Comparison of 2 Exercise Tests
The SpO2 was significantly different between the 2 exercise tests at the start of the loaded exercise (P < .001) (see Table 2). The difference in start-vs-nadir ΔSpO2 was significant (P = .02), but not the difference in start-vs-end ΔSpO2 (P = .79). The time to ΔSpO2 ≥ 3% and nadir SpO2 was much earlier in the 6MWT than in the cycling test (1.2 min and 3.5 min vs 4.6 min and 6.6 min, respectively) (both P < .001).
More subjects had ΔSpO2 ≥ 3% during the 6MWT than during the cycling test (40 vs 27) but that difference was not significant (P = .28). Moreover, 64% (n = 30) had consistent ΔSpO2 in the 2 tests (Table 5). Those with desaturation in both tests had poorer oxygen-cost-diagram score (P < .01) and cardiopulmonary function at peak exercise (P = .04 to .006) (see Table 5). Thus, the oxygen-cost-diagram score might predict exertional desaturation in both submaximal and maximum exercise testing.
Physiologic Data and Test Results Relative to SpO2 Difference Between the 2 Exercise Tests
Discussion
The present study has several important findings. First, in the 6MWT, the start-vs-nadir ΔSpO2 was much greater than the start-vs-end ΔSpO2 (see Fig. 1 and Table 2), and the start-vs-nadir ΔSpO2 during the 6MWT was greater than that during the cycling test (see Figs. 1 and 3 and Table 2). Second, the time to ΔSpO2 ≥ 3% and to nadir SpO2 occurred much earlier in the 6MWT than in the cycling test (1.2 and 3.5 min vs 4.6 and 6.6 min, respectively, both P < .001). Therefore, during the 6MWT the start-vs-nadir ΔSpO2 is more important than the start-vs-end ΔSpO2.
6-Min Walk Test
The SpO2 measurement for patients with COPD during the 6MWT has been recommended for routine use because of the high incidence of desaturation5,24 and the related severity25 and mortality.26 In the American Thoracic Society guidelines it is an optional measurement.14
In our study we observed 4 SpO2 patterns (see Figs. 1 and 2). The 26 (46%) subjects who resaturated during the second half of the 6MWT had better FEV1/FVC and smaller FRC than the subjects who did not resaturate (both P < .05, see Table 3). These subjects may have slowed down of their own volition, or even rested, to compensate for ventilation when SpO2 reached the nadir. This is supported by a recent study.11 Nonetheless, walking-induced desaturation remained steady despite taking a rest.5
This issue of measuring start-vs-nadir ΔSpO2 during the 6MWT was first raised, recently, by Fiore et al.11 However, in the present study the start-vs-nadir ΔSpO2 was greater and the start-vs-end ΔSpO2 was smaller than in Fiore's study (7.8% vs 7% and 3.7% vs 6%, respectively). And the proportion of subjects who resaturated was greater in the present study than in Fiore's study (26/40 vs 5/22, P = .001). Also, Fiore did not present the kinetics of SpO2 changes during the 6MWT.
The time to desaturation in the 6MWT predicts 24-hour SpO2 changes in COPD patients with PaO2 between 60 and 70 mm Hg.27 Exertional desaturation after the first minute of the 6MWT forecasts a 74% probability of desaturation in daily activities, whereas exertional desaturation after 3.5 min of the 6MWT negatively predicts (100%) desaturation in whole-day events.27 Most previous studies have reported start-vs-end ΔSpO24,8,17,28 or start-vs-end ΔPaO2,7 but no differences in start-vs-end ΔSpO2 or start-vs-end ΔPaO2 between the 2 modes of exercise have been reported in previous studies7,8 or in the present one. One study reported SpO2 at the third minute, but the nadir SpO2 might not occur during the third minute, thereby missing the point.4
The subjects who desaturated had a non-significant lower mean oxygen-cost-diagram score and diffusing capacity, significantly less inspiratory muscle strength, more dyspnea, shorter walk distance, and relative tachycardia during the walk test (all P < .05, Table 3). One previous study reported that the mean SpO2 during the 6MWT was modestly related to lung function (DLCO, FEV1/FVC, and peak flow, r = 0.48–0.55) but not related to dyspnea or walk distance.29 Another study reported that resting SpO2 was significantly related to FEV1 and walk distance,5 and to FEV1 plus forced expiratory flow during the middle half of the FVC maneuver.30 The sensitivity and specificity of exertional desaturation were 75% when the DLCO threshold was set at 60% of predicted.31 DLCO > 80% of predicted plus resting SpO2 has been used to exclude the evolution of exertional desaturation.32 The disagreement in the variables of lung function, dyspnea score, and walk distance in relation to SpO2 between the present study and previous reports might be due to the different definitions of SpO2 and different COPD populations.10
Cycling Test
Non-desaturation may be due to increased ventilation and improved ventilation/perfusion matching. The mechanisms of SpO2 desaturation are related to hypoventilation secondary to airway obstruction,4,12,33 decreased mixed venous PO2, deterioration of ventilation/perfusion matching and diffusing capacity, and increased shunting,10,33 but not necessarily to increased pulmonary vascular resistance.34
In the present study, body mass index, oxygen-cost-diagram score, lung function (including peak flow and DLCO), dyspnea, oxyhemoglobin saturation, and work of walking during the 6MWT, and cardiopulmonary function at peak exercise were worse in the desaturators (see Table 4). This is partly consistent with previous reports, as exertional desaturation is predicted by FEV1 < 35% of predicted plus DLCO < 35% of predicted,15 and is excluded by DLCO > 55% of predicted15 or FEV1/FVC > 0.5 plus DLCO > 20 mL/min/mm Hg.16 After the cycling test the inspiratory muscles are weaker in subjects with desaturation (see Table 4), indicating that oxyhemoglobin saturation may influence the recovery of inspiratory muscles after exercise. This might be concomitantly due to intercostal muscle blood flow limitation during intense exercise, as shown in near-infra-red spectroscopy.35 Exertional desaturation during a maximum exercise test may be significantly related to poorer anthropometrics and lung function at rest, and impacts the exercise capability of daily activities and submaximal and maximal exercises.
6MWT Versus Cycling Test
At the start of exercise, SpO2 of the 6MWT was significantly lower than that of the cycling test (P < .001, see Table 2), which is consistent with another report.2 It is possible that there is more hyperventilation triggered by unloaded pedaling during the cycling test than that triggered by standing ready for the walk test. Unfortunately, ventilation during the walk test was not measured for comparison.
The work load in the cycling test increased more slowly than in the walk test. An incremental cycling test ideally lasts for 10 min so that 85% of the maximum exercise intensity takes 8.5 min. In contrast, the intensity of walking is approximately 85% of the maximum exercise intensity for patients with COPD.9 The timing of reaching the asymptote of heart rate change during the 6MWT reportedly develops by the third minute, as in constant-work-rate exercise.8 In turn, the exercise intensity of the early phase of 6MWT is much heavier than that of the cycling test, so the 6MWT causes earlier desaturation, if ever, than the cycling test (time to ΔSpO2 ≥ 3% and time to nadir SpO2 1.2 min and 3.5 min vs 4.6 min and 6.6 min, respectively) (see Table 2 and Figs. 1 and 3).
The resaturation that occurs in the 6MWT does not happen in the cycling test. The cycling test is an external-pacing exercise mode wherein the load is increased regularly and smoothly by a computer, whereas the walk test is an internal-pacing exercise mode controlled by subject. This notion is compatible with a previous report that resaturation occurs after rest.11
Poulain et al reported 3 subgroups of COPD desaturators: desaturation in both the 6MWT and the cycling test; desaturation in neither test; and desaturation only in the 6MWT.4 The present study had more subjects who desaturated in both tests, and fewer subjects who desaturated in neither test (P < .001), and 4 unique subjects who desaturated only in the cycling test. Our subjects here may have had more severe airway obstruction than those in Poulain's study.4
Poulain et al also reported that the severity of FEV1/FVC was related to the agreement in occurrence of desaturation between the 6MWT and cycling test.4 The subgroup with desaturation in both tests had the lowest FEV1/FVC, whereas the subgroup with desaturation in neither test had the highest. This relationship was not seen in the present study. The body height and oxygen-cost-diagram scores are significantly related across the subgroups (see Table 5). Subjects in the subgroup with desaturation in both tests had significantly less active daily lives, suggesting that the oxygen-cost-diagram score can predict exertional desaturation in both exercise modes, whereas DLCO plays only a marginal role. The discrepancies between our study and Poulain's are perhaps due to the various speeds and volitional rests in the 6MWT (see Tables 3⇑–5).
Limitations
There are concerns regarding the accuracy of measuring saturation via pulse oximetry.36,37 We validated our pulse oximeters via arterial blood gas analysis.12 The pattern of heart rate readings remained constantly exponential when there was SpO2 resaturation. Extraction of arterial blood during the field walk test is technically difficult in the prompt collection of arterial blood at the end of the walk test. This problem may have caused inconsistency in the previous reports.1,3,7 In a previous study, blood sampled within 15 seconds after the end of walking showed insignificant difference in PaO2 between the 6MWT and cycling test.7 However, 2 other reports found significant differences in PaO2.1,3 Sampling blood within 15 seconds is technically demanding and inappropriate, as it was shown in this study that SpO2 resaturated significantly within 16 ± 14.1 seconds during the recovery phase of the cycling test. Although arterial blood sampling during the treadmill walk test is feasible, that test is an external-pacing modality, unlike the 6MWT. Earlobe blood sampling is a less invasive alternative,4 but it has questionable accuracy.38 Pursed-lips breathing39 could not be evaluated during the 6MWT because our study was not designed to include it. Lastly, the 6MWT performance was not significantly different across the subgroups (see Table 5) but was different between the non-desaturation and desaturation subgroups (see Table 3), suggesting a grouping effect. In Table 5 we combined into one subgroup the subjects who desaturated only in the 6MWT and the subjects who desaturated only in the cycling test, because there were only 4 subjects who desaturated only during the cycling test.
Conclusions
For the 6MWT we recommend using and reporting the start-vs-nadir ΔSpO2, because the start-vs-nadir ΔSpO2 is greater than the start-vs-end ΔSpO2, and during the 6MWT the nadir SpO2 occurs earlier than during the cycling test. The oxygen-cost-diagram score can predict agreement in the occurrence of SpO2 changes in both tests. Exertional desaturation in both tests can predict poorer peak exercise performance than the 6MWT performance.
Footnotes
- Correspondence: Ming-Lung Chuang MD, Division of Pulmonary Medicine, Department of Critical Care Medicine, Chung Shan Medical University Hospital, #110, Section 1, Chien-Kuo North Road, South District, Taichung 40201, Taiwan. E-mail: yuan1007{at}ms36.hinet.net.
This study was partly supported by grant CSH-2012-C-023 from the Chung Shan Medical University Research Program and grant 443 from the Chang Gung Medical Research Program. The authors have disclosed no conflicts of interest.
- Copyright © 2014 by Daedalus Enterprises


