

Abstract
INTRODUCTION: Normal values of the 6-min walk distance (6MWD) for children have not been well demonstrated. This limits the interpretation of the 6MWD in children.
METHODS: A cross-sectional prospective study was designed. A total of 949 (467 males, 482 females) healthy children were recruited randomly from 7 Turkish secondary schools in Ankara. The 6-min walk tests were conducted according to the American Thoracic Society guidelines.
RESULTS: The mean 6MWD decreased between the ages of 12 and 14 y for both boys and girls, and then gradually increased until 17 y of age. In the best fitting and most efficient linear, quadratic, and categorical regression models, the age of the subjects, heart rate after the test, and physical activity level of the subjects were significantly related to the 6MWD. Nevertheless, these variables explained < 20% of the variance in the 6MWD.
CONCLUSIONS: The 6MWD does not increase in a straight linear fashion from the age of 12 until adulthood. Correlation of the 6MWD with anthropometric features is very weak, so in evaluating the 6MWD, the standard curves should be used.
Introduction
The 6-min walk test (6MWT) measures the distance that a participant can walk as far as possible along a 30-m corridor in a period of 6 min. It is easy to perform, can be repeated at a low cost, and is unlike laboratory-based tests of exercise tolerance that require technical expertise and sophisticated equipment.1 Participants exert submaximal effort while performing the 6MWT; thus, the 6MWT closely resembles the patient's ability to perform daily activities2 and correlates well with formal measures of quality of life.3
The 6MWT is increasingly used on healthy children and children with pulmonary hypertension,4 congenital cardiac diseases,5 cystic fibrosis,6 interstitial lung disease,7 juvenile idiopathic arthritis,8 obesity,9 cerebral palsy,10 end-stage renal disease,11 hemophilia,7 and spina bifida,7 as well as those waiting for cardiac and lung transplantation.12 Nevertheless, normal values of the 6-min walk distance (6MWD) for children vary greatly according to different studies and countries.13–20 This limits the interpretation of the 6MWD in children and poses problems for clinicians wishing to use the 6MWT in a research setting. We aimed to establish anthropometric specific reference values for the 6MWT in healthy children and adolescents between 12 and 18 y of age.
QUICK LOOK
Current knowledge
The 6-min walk distance (6MWD) is an established method of determining exercise limitation in adults with chronic lung disease. Normal values of the 6MWD for children have not been well demonstrated, limiting the utility of the test in children.
What this paper contributes to our knowledge
The mean 6MWD decreases between the ages of 12 and 14 y but then gradually increases until age 17. The correlation of 6MWD with anthropometric features is very weak. The 6MWD cannot be predicted by using reference equations in pediatric ages.
Methods
This cross-sectional study was conducted in Ankara, where there are 200,265 students between the ages of 12 and 18 y being educated in local schools. The proportional cluster sampling method was used, and the sample population was weighted according to the population density in central and suburban areas in Ankara. A total of 1,112 students were recruited randomly from 7 selected schools (4 high schools, 3 primary schools).
The study protocol was reviewed and approved by the institutional human subjects research review board of Gazi Medical University and the institutional boards of the participating local schools. The study was conducted through the pediatric cardiology and public health departments of Gazi Medical University between March and April, 2010. Thirty-four intern medical doctors who were in rotation in the public health department carried out the study. Four resident medical doctors and one sport coach accompanied them as observers during the study to maintain the quality of the research.
Body mass index (BMI) values were plotted on the standard growth charts of the official Centers for Disease Control.21 According to the subject's age and sex, weight status was categorized as obese if BMI was > 95th percentile, overweight if BMI was between 85th and 95th percentiles, normal if BMI was between 5th and 85th percentiles, and underweight if BMI was < 5th percentile.
6MWT Protocol
The intern medical doctors and the observers were given a 2-d training on how the study and 6MWT would be performed. The 6MWT was performed following the standardized approach provided by the American Thoracic Society guidelines,1 except only one test was done per child, because there is a high degree of test-retest reliability in pediatric population.9,22
The students were informed about the study and how to perform the 6MWT 1 d before the test. The 6MWTs were carried out during sports lessons before the beginning of the activity time, so all students were in sports clothes. The study was completed in 3 wks during nonrainy spring days. Altitudes of the schools were very similar, and all the tests were done on the asphalt surfaces of the schoolyards.
Informed consent was obtained from both the subjects and their parents. Before the test, the height and weight of the subjects were measured without shoes using an electronic scale (Seca 769, readability 100 g, capacity 200 kg; Seca, Chino, California) and a wall stadiometer (Seca 222, graduation 1 mm). Heart rate and sphygmomanometric blood pressure measurements were performed using the Omron M6 (HEM 711) blood pressure monitor (Omron, Kyoto, Japan).23 Cuff sizes of the sphygmomanometers were appropriate for the sizes of the arms of the subjects. Subjects rated their baseline dyspnea and overall fatigue using the Modified Borg scale before and after the test.24,25
The test area was arranged over a length of 30 m and was marked every 3 m. Each end of the course had clearly identified turning points. The students sat on a chair for 5 min before the test. Observers measured the test time using stopwatches and said the same encouraging sentences as stated by the American Thoracic Society to the students every minute. At the end of the test, the 6MWD was calculated by adding the distance walked during previous laps (number of laps × 30 m) to the distance walked at the final lap by using a tape measure.
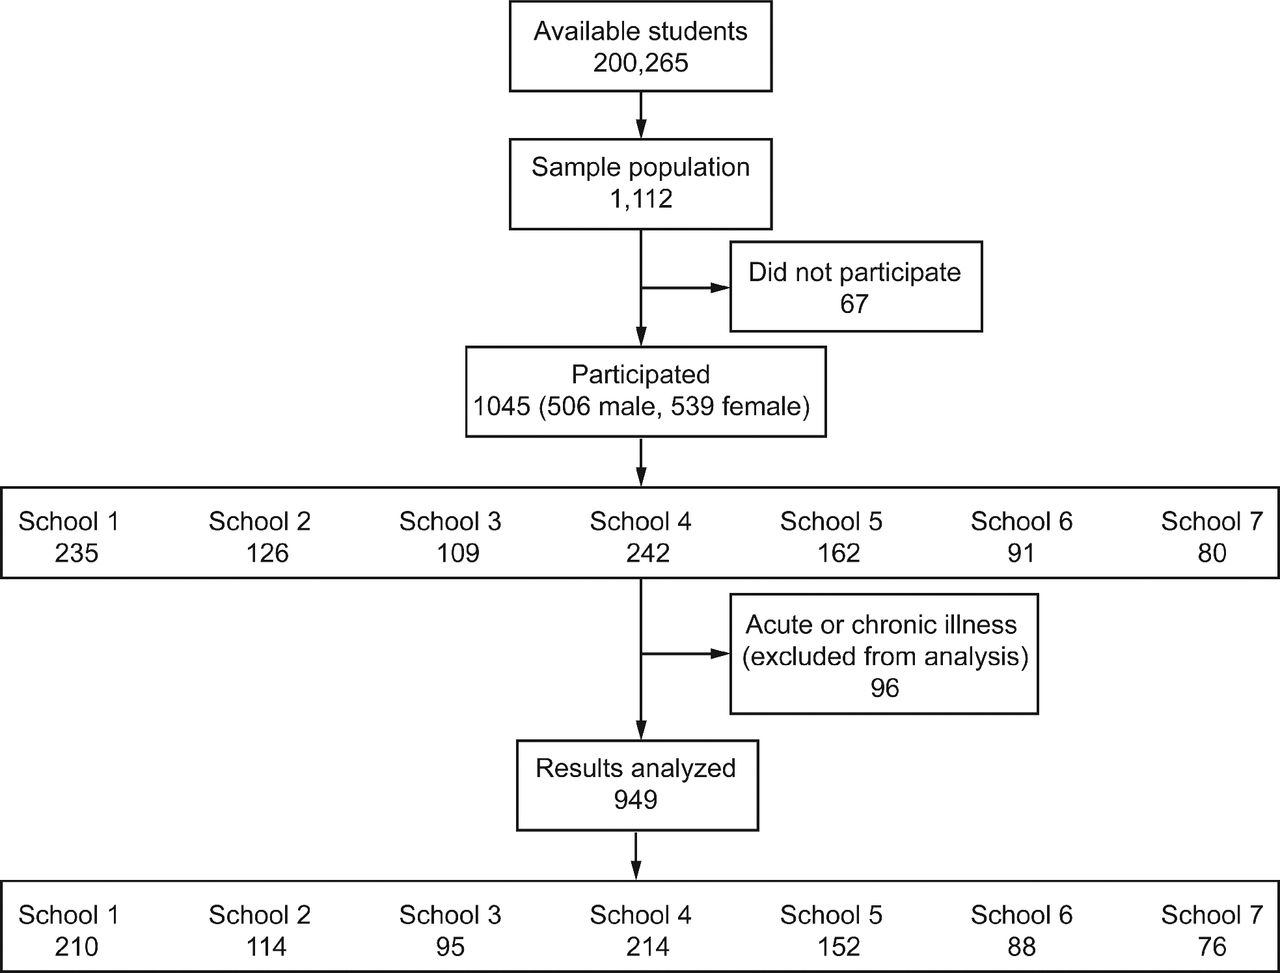
Sixty-seven of the 1,112 students opted not to join the test, and the remaining 1,045 (506 male, 539 female) students participated in the test. All of the participants and their parents were asked whether the participant had any acute or chronic illnesses. Ninety-six (9.18%, 39 male, 57 female) students had an acute respiratory infection or had a chronic respiratory, cardiac, or skeletal disease. These students were allowed to participate in the 6MWT so that any chance of social discrimination of unhealthy students by their peers was eliminated. However, their results were excluded from the final results of the study. In total, 949 (467 male, 482 female) healthy students were included in the data analysis (Fig. 1). At least one doctor certified in cardiopulmonary resuscitation with a minimum of basic life support and appropriate technical equipment was on hand at the test area.

Flow diagram illustrating participants entered into the study.
Level of Physical Activity
The subjects were classified according to self-reported physical activity as very active (activity ≥ 30 min, 5 or more times/wk), active (activity ≥ 30 min, 3 or more times/wk), or sedentary (activity < 30 min, or 3 times/wk) in the last 3 months.26 None of the participants were involved in any competitive sport.
Statistical Analysis
By defining the type-1 error probability (α) as .05, power as 0.80, and SD of 6MWD as 2%; we calculated that 1,112 students were needed in the study sample (PS 3.0.43 software by WD Dupont and WD Plummer).
Data are presented as mean ± SD for normally distributed continuous variables, and as absolute or relative frequencies and percentage for categorical variables. Student t tests and analysis of variance with Tukey and least significant difference (LSD) post hoc tests were used for comparison of continuous variables. Frequencies were compared using chi-square analysis. Bivariate and partial correlation analyses were performed by parametric Pearson correlation. Percentile charts were constructed using the 5th, 25th, 50th, 75th, and 95th percentiles of the 6MWD for male and female subjects. R2 values for multiple linear, quadratic, and categorical regression models were calculated according to forward and backward stepwise selection of possible independent predictors of the 6MWD simultaneously for boys and girls with the use of standard regression techniques. However, only the best-fitting models are presented. Significance levels for all tests were established as a two-tailed P value < .05. Descriptive analysis of data and analysis of variance were undertaken using the Statistical Package for the Social Sciences (SPSS) 16.0 program (SPSS, Chicago, Illinois).
Results
From the 949 children (467 male, 482 female) analyzed, the number of individuals in each age group and school, gender distribution, weight, height, BMI, heart rate values before and after the test, 6MWD, and blood pressure values before and after the test are given in Table 1. In no case was it necessary to stop the test prematurely, and there were no unexpected events during the tests.
Demographic, Anthropometric, Physical Features, and 6MWD of the Participants According to Age and Sex
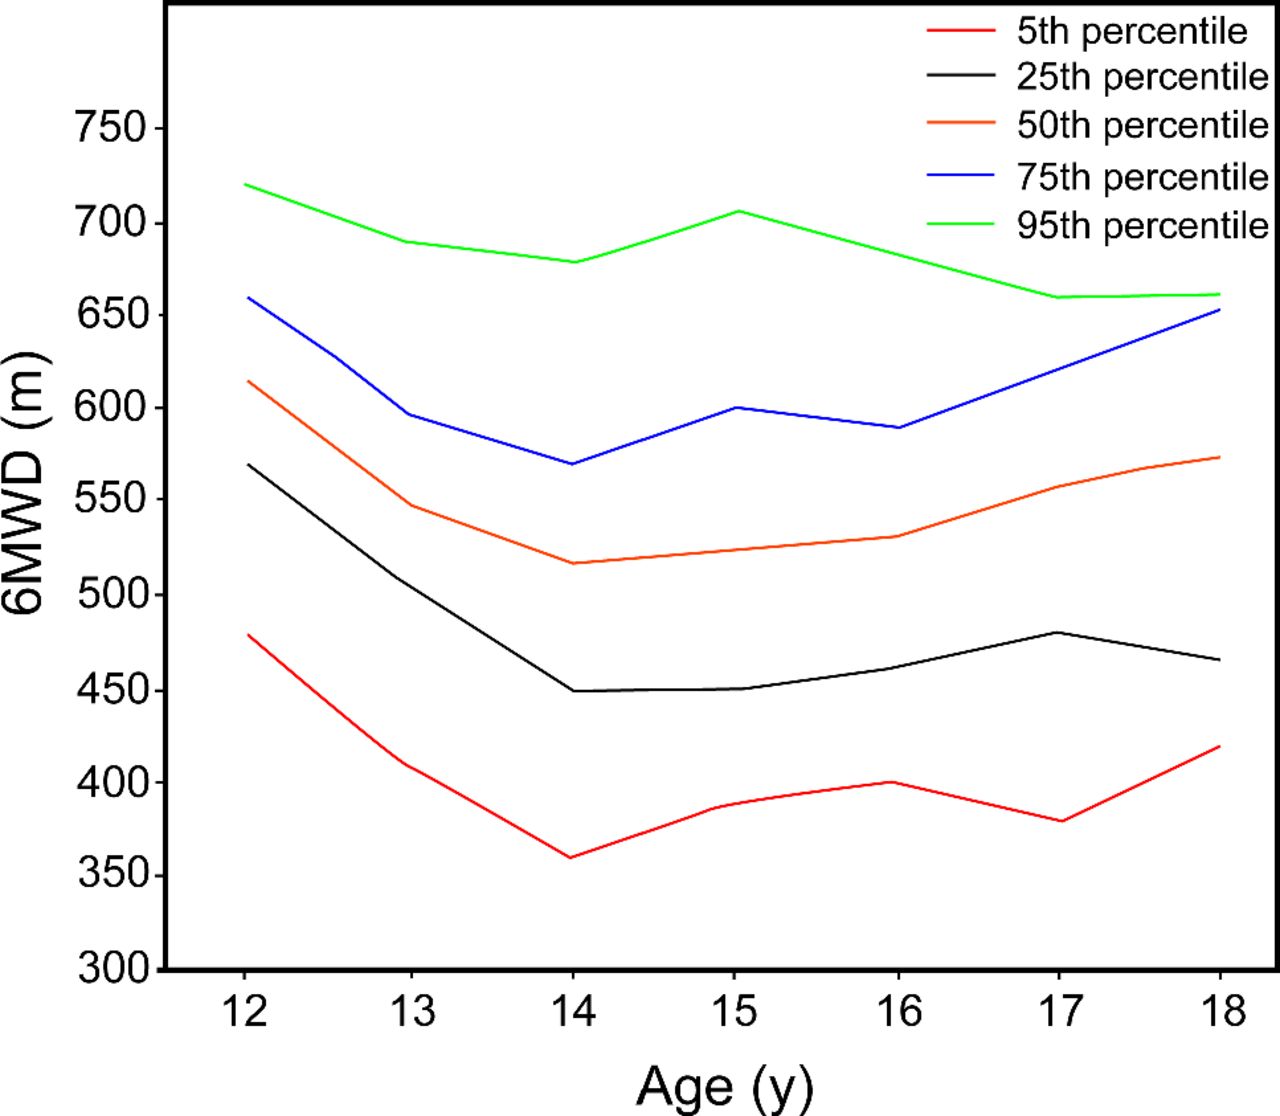
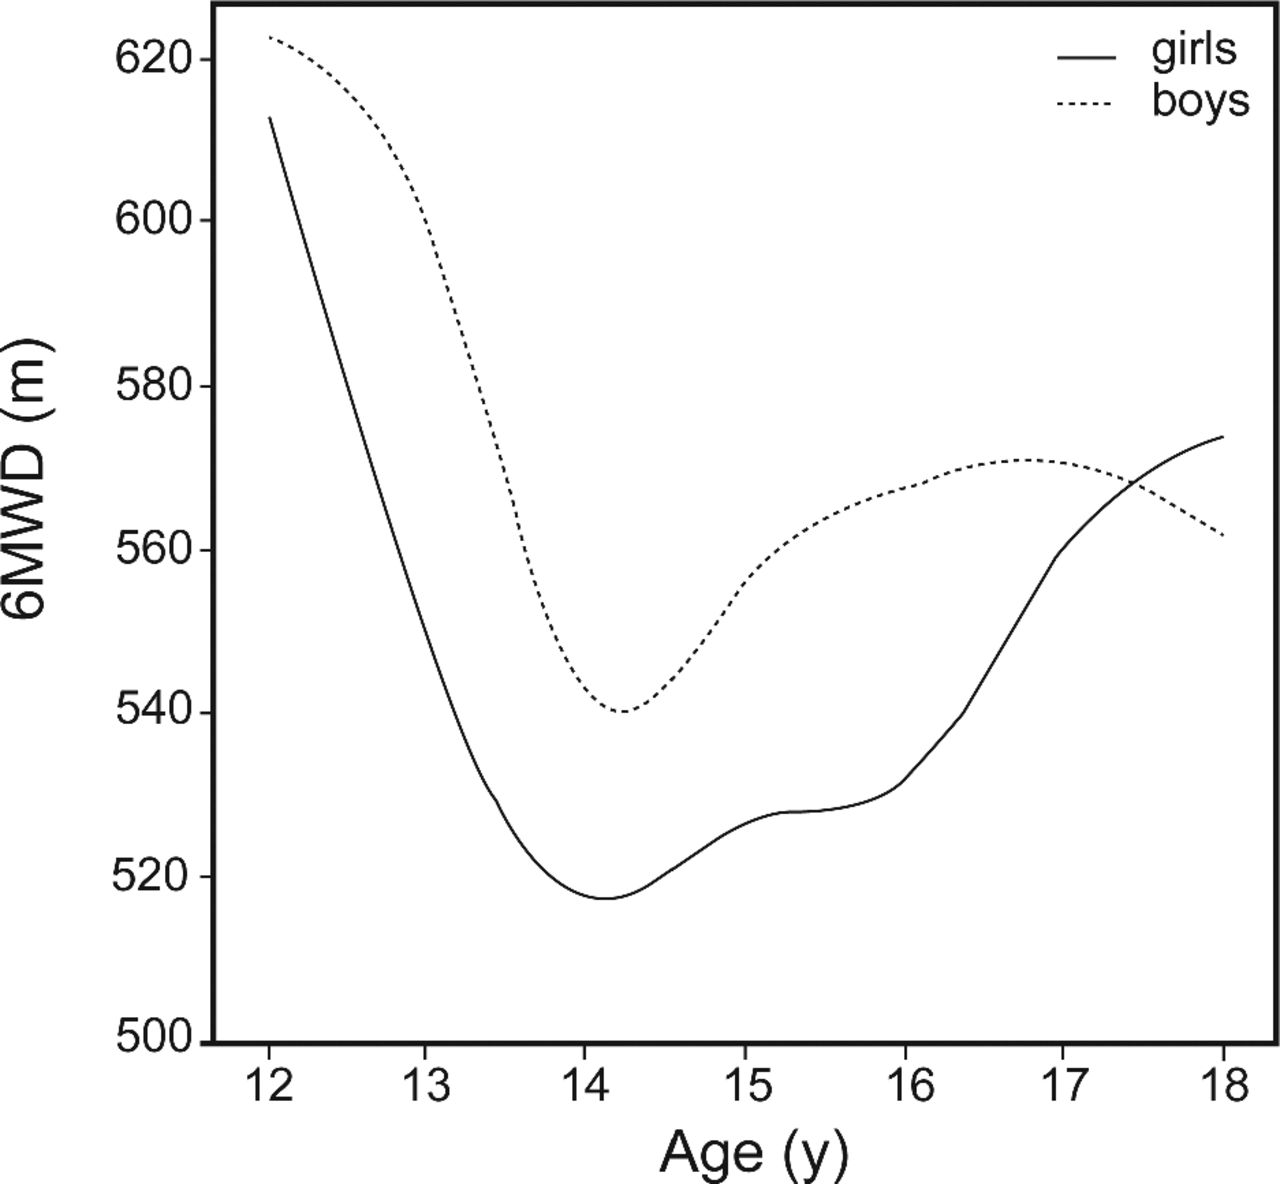
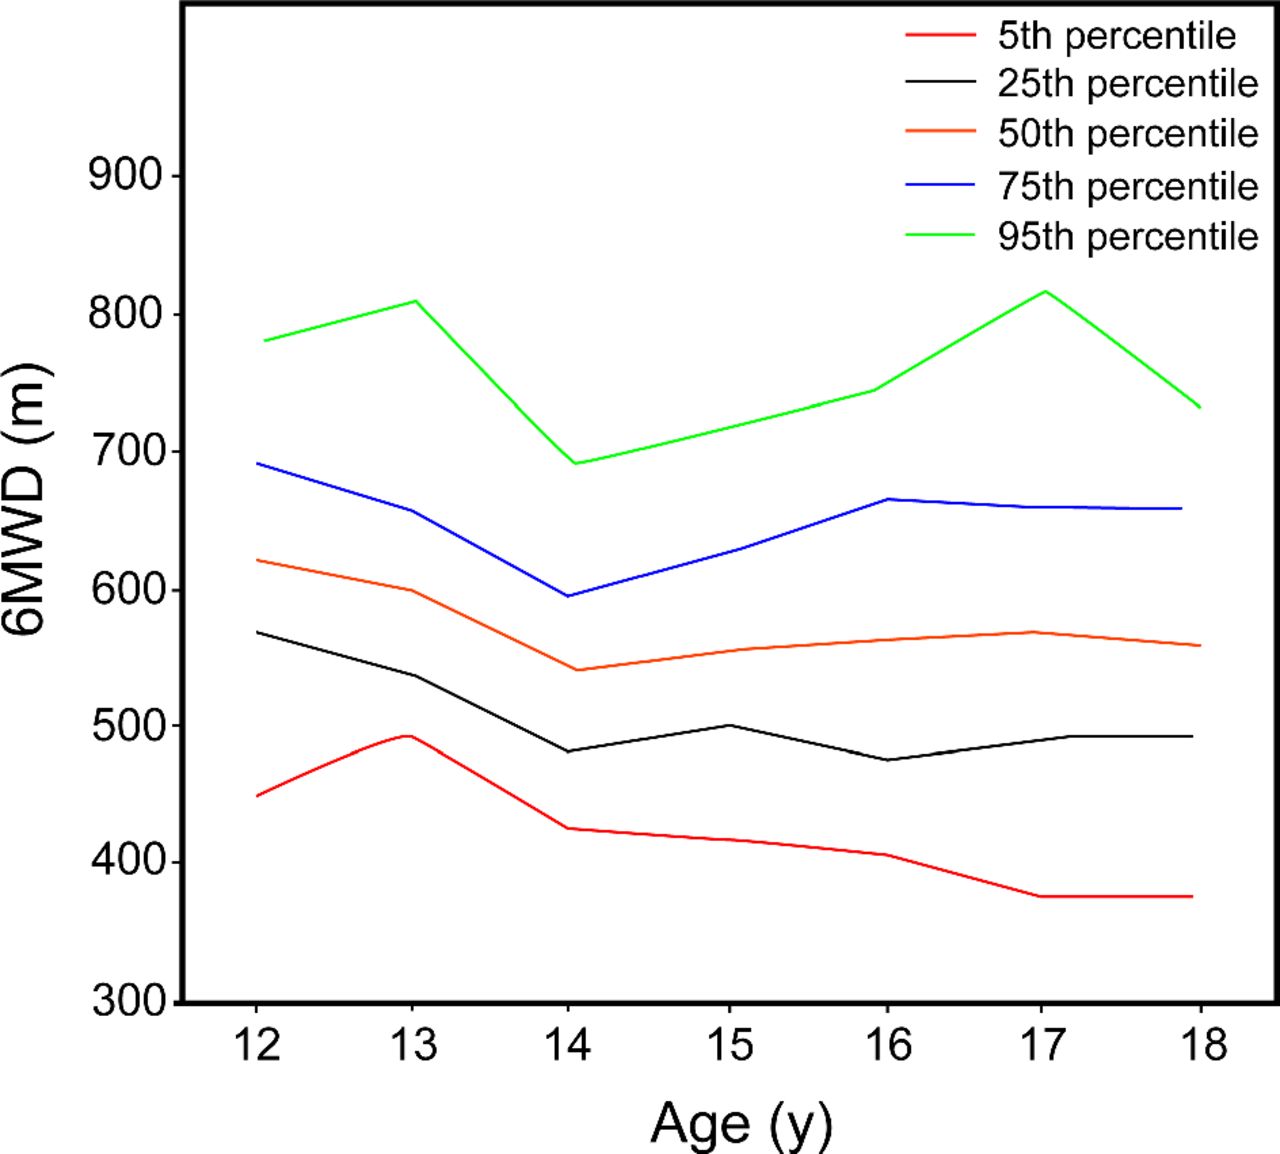
Boys had a significantly higher 6MWD than girls between the ages of 12 and 17 y (P < .001). The mean 6MWD decreased to a nadir at 14 y of age and then gradually increased again until 17, where it continued to increase for girls but slightly decreased for boys until the age of 18 (Fig. 2). Correlation values (r) of the 6MWD with age and height were very similar: 0.23 and 0.22, respectively. We used age values to establish percentile charts of 6MWD, because there would be missing values if we chose height instead. The percentile graphics and numeric percentiles for the 6MWD according to sex and age groups are depicted in Figures 3 and 4.

Mean 6-min walk distance (6MWD) according to age and sex.

Percentiles for 6-min walk distance (6MWD) in boys, according to age.
Percentiles for 6-min walk distance (6MWD) in girls, according to age.
The 6MWD significantly correlated with height, weight, BMI, heart rate before and after the test, modified Borg scales for fatigue and dyspnea after corrected for age; however, the calculated correlation (r) values were weak (Table 2). Correlation of the 6MWD with age was not directly linear (Fig. 2), so we calculated a curvilinear regression model by linear, quadratic, and categorical regression analysis. In the best-fitting models, age (P < .001), age2 (P < .001), heart rate after the test (P < .001), and physical activity levels (P < .001) of the subjects were significantly related with the 6MWD; nevertheless, these variables explained about only 19% of the variability of the 6MWD in boys and 13% in girls. Height, weight, and BMI did not have significant influence on the 6MWD in regression analysis.
Partial Correlation Values (r) of 6MWT With Anthropometric Measurements, Corrected for Age
Most of the females had a sedentary lifestyle, whereas boys were more active (chi-square test, P < .01) (Table 3). The 6MWD was significantly different according to frequency of physical activity; students with sedentary life styles had shorter 6MWD results than very active students (male P = .003, female P = .09). The 6MWD was not significantly different between active and very active students.
6MWD According to Frequency of Physical Activity
A total of 6.5% of the subjects were obese, 15.7% of them were overweight, and 3.5% of them were underweight. The mean 6MWD was not statistically different according to obesity status of the subjects (P = .64).
Discussion
A wide range of reference values of the 6MWT for children between the ages of 12 and 18 y have been reported in previous studies.13,15,17,20 Nevertheless, only one of them (Ulrich et al)20 gave age-by-age reference values (Table 4). This study along with ours demonstrated a decline in the 6MWD after the age of 12; however, both the decline and resurrection of the 6MWD were more obvious in our study.
Studies That Have Reported Reference Values for 6MWT in Children 11–18 y of Age
The fact that 6MWD results do not linearly increase with age was an unpredictable finding. This may be due to the ever-changing hormones and energy levels or the discrepancy of inner motivation of teenagers at different ages.27 During a self-paced test, the motivation of the participant is of paramount importance.1 The motivational aspects during the 6MWT have not been assessed, and no qualifying criteria for a 6MWT in children have been defined. The heart rate variation in our study was lower than previous studies, which may also be due to motivational discrepancies.13,15
The decline in the 6MWD between the ages of 12 and 14 y is especially important for patients with chronic conditions, because, according to our results, it may be due to an expected phenomenon rather than deterioration caused by the primary disease.
According to our results, the correlation of the 6MWD with height, weight, and BMI is not sufficient to recommend routine usage of predictive equations. Instead, the present study provides new 6MWD standard curves that can be used in the care of pediatric patients between the ages of 12 and 18 y. It is frequently proposed that predictive equations derived from anthropometric measurements may be used to estimate 6MWD.14,22,28 In most of these studies, the predictive equations show a high variability in their predictive power.
To prevent discrepancies between nations, Li et al15 suggested using height-specific standards for the 6MWT. However, age and height were equally correlated with the 6MWD in our study, and the reference values reported by Li et al were not the exact values; instead, they were constructed using the maximum penalized likelihood LMS method.
The 6MWD does not differ between active and very active students, even though it is significantly different between sedentary and very active students. This finding supports the basic feature of the 6MWT, which is that it assesses the submaximal level of functional capacity, and most of the patients do not achieve maximal exercise capacity during the 6MWT.1 For the same reason, if a child has a result lower than the corresponding 5th percentile, a treadmill exercise test will be needed to reveal the underlying mechanism. In children who are moderately or severely impaired, the 6MWT represents a maximal exercise test.29 A less detailed analysis of physical activity by Ben Saad et al17 also showed that sports activity significantly affected the 6MWD.
Due to the selection method of the students and the sociocultural reasons which permits girls to start and finish school earlier, the number of 18-y-old girls was limited to 9. Therefore, the reliability of the reference value for this age for girls is less than the other age groups. Furthermore, we could not evaluate the pubertal status of the students due to cultural restrictions.
Our results presented a small inverse correlation of body weight with distance walked (Table 2). Even so, we did not find any relationship between the obesity and the 6MWD, although it was shown that obese children and adolescents have shorter 6MWD than normal subjects.9 It may be due to the fact that the prevalence of overweight children in our study sample (girls 14.8%, boys 16.0%) was lower than that of the expected prevalence of this condition in Europe (girls 28%, boys 31.7%) and in the United States (girls 16%, boys 18.2%).30,31
All the observers who carried out the 6MWT were volunteers from among interns. Although, we tried to diminish inter-rater variability as much as possible by performing pretest education and controlling the observers individually by one of the writers, the study may still possess a bias.
We performed only one 6MWT per child. In an adult population, it has been shown that there might be a training effect, and a longer distance might be reached on repeated tests.32 However, there is a high degree of test-retest reliability in pediatric populations.9,22 Moreover, Priesnitz et al16 reported that most of the participants in their study walked longer distances during the first test than during the second. There was a high variability in 6MWD, which may limit the use of reference values. Because all of our subjects were healthy, we believe that 5th percentile may be used as a cutoff value. Further studies are needed in this regard.
To the best of our knowledge, this is the largest study that gives reference values of the 6MWD for individual age groups in children between 12 and 18 y of age.
Conclusions
The mean 6MWD decreases between the ages of 12 and 14 y but then gradually increases until the age of 17. Correlation of the 6MWD with anthropometric features is very weak; thus, the 6MWD cannot be predicted by using reference equations in pediatric ages. When evaluating 6MWT results, standard curves should be used.
Acknowledgments
We thank the intern doctors for their intense effort and help in this study.
Footnotes
- Correspondence: Mehmet Kenan Kanburoglu MD, Department of Pediatrics, Fatih University Medical School, Alparslan Turkes Bulvari 57, Bestepe/Yenimahalle, Ankara 06510, Turkey.
The authors have disclosed no conflicts of interest.
- Copyright © 2014 by Daedalus Enterprises


