

Abstract
BACKGROUND: We investigated the role of mechanical ventilatory constraints in obese class III subjects during incremental exercise.
METHODS: We examined 14 control subjects (body mass index [BMI], 23.6 ± 3.2 kg/m2), 15 obese class II subjects (BMI, 37.2 ± 4.5 kg/m2), and 17 obese class III subjects (BMI, 53.4 ± 6.8 kg/m2). All subjects performed pulmonary function tests and maximal inspiratory pressure at rest, ventilatory parameters, flow-volume loops, and rated perceived exertion and breathlessness during exercise.
RESULTS: All subjects had normal pulmonary function. Obesity resulted in increased minute ventilation for a given submaximal work rate, although minute ventilation during peak exercise was lowest in the obese class III subjects. End-expiratory lung volume was significantly lower in the obese subjects at rest and during exercise at the ventilatory threshold but not during peak exercise. During heavy-to-peak exercise, the obese subjects increased their end-expiratory lung volume, whereas the control group continued to decrease this parameter. Compared with controls, end-inspiratory lung volume was significantly lower in obese class II subjects and obese class III subjects at rest and at the ventilatory threshold but not during peak exercise. At maximal exercise, obese class III subjects had a greater end-inspiratory lung volume than obese class II subjects and controls. Obese class III subjects displayed a greater expiratory air flow limitation at rest, at the ventilatory threshold, and during peak exercise than both controls and obese class II subjects.
CONCLUSIONS: Mechanical ventilatory constraints increase progressively with degrees of obesity, contributing to exercise limitation in obese subjects.
- end-expiratory lung volumes
- end-inspiratory lung volume
- expiratory air flow limitation
- breathing strategy
- work of breathing
- dyspnea
Introduction
Ventilatory limitation during exercise has traditionally been determined by measuring how close the minute ventilation (V̇E) achieved during exercise approaches the maximum voluntary ventilation (MVV). However, the ventilatory reserve (V̇E/MVV) ratio is relatively insensitive and tells us little about the specific reasons for ventilatory constraint.1 In obese subjects, breathing at a low lung volume (near the residual volume) limits the available ventilatory reserve due to (1) the shape of the expiratory flow-volume curve, (2) reduced maximal available air flows, and (3) reduced chest wall compliance. The breathing reserve using the MVV therefore only provides limited information, and does not provide insight into breathing strategy or the degree of expiratory or inspiratory flow constraints.1 Understandably, significant controversy surrounds assessment of the ventilatory reserve, partly because of the lack of a definitive method for measuring ventilatory capacity. Nevertheless, emerging technologies (such as specific exercise tidal flow-volume loops referenced to maximal flow-volume loops) have provided valuable additional insight into how mechanical constraints limit exercise.2
In mild to moderate obesity, the earliest and most prominent change in pulmonary function is a reduction in end-expiratory lung volume (EELV), which is specific to static respiratory mechanics.3 In the present study, we chose to monitor EELV, which is determined by both respiratory mechanics and respiratory muscle recruitment during exercise. The end-expiratory lung volume adopted during exercise is also influenced by expiratory flow limitation.3 Importantly, a change in EELV is a major component of the normal ventilatory response to exercise and reflects alterations in respiratory mechanics during exercise. The EELV adopted during exercise has serious implications for tidal expiratory flow, respiratory muscle function, work of breathing (WOB), and/or shortness of breath.2,4 Recently, a number of studies have reported that mild to moderate obesity does not appear to limit the decrease in EELV during mild to moderate intensity cycling exercise.5–7 However, the obesity-associated reduction in EELV at rest appears to influence the regulation of this parameter during heavy-to-peak exercise. This may occur when the obese subject is placed at a lung volume that predisposes him/her to high expiratory resistance and expiratory flow limitation, which necessitates an increase in EELV to augment V̇E proportionally with exercise intensity.5,6,8
However, the degree of ventilatory constraint in massive obesity has yet to been defined. To our knowledge, a systematic study of progressive mechanical ventilatory constraints during exercise in obese class III individuals has never yet been conducted. It has been suggested that the decline in pulmonary function may be relatively greater in obese class III patients than in obese class II patients, thus making the former more susceptible to mechanical ventilatory constraints during exercise.
To investigate the progressive nature of mechanical ventilatory constraints in obesity, we chose to study 14 control, 15 obese class II, and 17 obese class III subjects. We hypothesized that lung function would progressively decrease with obesity and that obese class III subjects would experience greater mechanical ventilatory constraints during exercise.
QUICK LOOK
Current knowledge
Ventilatory limitation during exercise is commonly determined by measuring the relationship of the minute ventilation achieved during exercise to the maximum voluntary ventilation. However, this ratio is relatively insensitive and cannot identify the specific reasons for ventilatory constraint. In obese subjects, breathing at a low lung volume limits the available ventilatory reserve due to alterations in pulmonary and chest wall mechanics.
What this paper contributes to our knowledge
The impaired exercise performance in obese subjects was largely a result of increased ventilatory loads and impaired ventilatory muscle function. In subjects with severe obesity (class III), a reduced tidal volume reserve required an increase in breathing frequency to elevate minute volume, leading to dynamic hyperinflation. This additional elastic load was associated with exertional dyspnea, hypoxemia, and exercise limitation.
Methods
Subjects
Three groups of male subjects were recruited through local advertisements. Fourteen control (BMI = 23 ± 3 kg/m2 and 40 ± 5 y of age), 15 obese class II (BMI = 37 ± 4 kg/m2 and 42 ± 8 y of age), and 17 obese class III (BMI = 53 ± 6 kg/m2 and 45 ± 4 y of age) subjects were included in the study. Subjects provided verbal and written informed consent in accordance with the guidelines established by the institutional review board. The experimental procedures complied with the ethical standards of the 1975 Helsinki Declaration, and approval was received from the appropriate local institutional review board. All qualified participants were familiarized to exercise on the cycle ergometer and instructed to avoid exercise, food, and caffeine for at least 2 h before exercise testing, or had participated in regular vigorous exercise for the last 6 months. The American Thoracic Society spirometry interpretation workshop only states that subjects should be “never-smokers, free of respiratory symptoms and disease.”9 In accordance with these guidelines, exclusion criteria included: the presence of a significant disease other than obesity that could contribute to dyspnea or exercise limitation (ie, metabolic, cardiovascular, neuromuscular, musculoskeletal, history of asthma or COPD, smoking history, obstructive sleep apnea, pulmonary hypertension, obesity hypoventilation or other respiratory diseases, syndromes, or musculoskeletal abnormalities).10 Subjects not meeting these guidelines were excluded.
Body Composition
Standard measures of height, weight, waist, and hip circumferences were made upon initial screening of subjects. BMI and waist-to-hip ratio (WHR) were calculated from the standard measures.
Pulmonary Function Test
Baseline spirometric function was measured (Vmax 2130 spirometer, SensorMedics, Anaheim, California) with the subjects seated on the cycle ergometer before the exercise test. The subjects completed at least 3 acceptable maximal forced expiratory maneuvers; technical procedures, acceptability, and reproducibility criteria were those recommended by the American Thoracic Society/European Respiratory Society.11 Forced vital capacity (FVC), FEV1, and peak expiratory flow were recorded at body temperature and pressure saturated (BTPS). Predictive values were taken from Castellsagué et al.12
Body plethysmography and maximum inspiratory capacity were performed (V6200 Autobox, SensorMedics, Yorba Linda, California) in accordance with recommended techniques.11 Pulmonary function measurements were standardized as percentage of predicted normal values; predicted normal inspiratory capacity (IC) was calculated as predicted TLC minus predicted functional residual capacity.11
Maximal Inspiratory Pressure
At rest, maximal inspiratory pressure (PImax) was measured at the functional residual capacity on seated subjects at rest, with a differential pressure transducer (Druck, LPM 9000 series, ± 350 cm H2O, Leicester, United Kingdom) using the technique of Black and Hyatt.13 Predictive values were those of Harik-Khan et al.14
Flow-Volume Measurements
Tidal flow-volume loops were measured by the Vmax 2130 cardiopulmonary exercise testing (SensorMedics, Yorba Linda, California) at rest, before exercise, and during the last 30 s of each exercise intensity. Maximal flow-volume maneuvers were performed in conjunction with the tidal breaths at rest and during each exercise intensity, as well as within 2 min post exercise. The tidal flow-volume loops were collected without perception by the subjects. Literature shows that IC maneuvers do not interfere with the main cardiorespiratory functional parameters used for the interpretation of the cardiopulmonary parameters during incremental exercise.15 Typically, IC maneuvers were performed after 5–8 tidal breaths were collected with instructions to take a deep inspiration to total lung capacity (TLC). This was with an additional 5 breaths and a second IC maneuver followed by an FVC maneuver. On analysis, drift in the volume signal was corrected by aligning the tidal breaths according to the 2 IC maneuvers (assuming that TLC did not change). The IC maneuver was practiced repeatedly at rest before exercise to help ensure that a complete inspiration would be accomplished throughout the exercise period. The coefficient of variation for obese subjects and controls for multiple IC maneuvers that were performed before exercise averaged < 6%.
Breathing Mechanics
Inspiratory capacity was measured at rest and during exercise to determine placement of tidal flow-volume loops within the maximal flow-volume loop as previously described.16 End-expiratory lung volume was estimated from measurement of IC (EELV = [TLC] – IC) and reported as a percentage of TLC (EELV, % TLC). End-inspiratory lung volume (EILV) was calculated (EILV = EELV + ventilatory threshold [VT]) and expressed as a percentage of TLC (EILV, % TLC). This assumes that TLC does not change significantly with body position17 or exercise.6,18,19
Expiratory Air Flow Limitation
To evaluate the degree of ventilatory constraint during exercise, the degree of expiratory flow limitation can be examined by plotting the exercise flow-volume loop relative to the maximal flow.2 This relationship can provide information about the degree of expiratory flow limitation, operating lung volumes, as well as breathing strategies used with incremental exercise. The degree of expiratory air flow limitation is therefore a balance between ventilatory demand and ventilatory capacity combined with the way subjects choose to regulate their EELV.3
EAFL was defined as the % tidal volume where tidal expiratory flow impinged on maximal expiratory flow. As the degree of expiratory flow limitation increases, EELV typically rises (dynamic hyperinflation) and the inspiratory elastic load increases.4,20
Exercise Protocol
Exercise testing was performed on a cycle ergometer (Ergometrics 800S, SensorMedics, Anaheim, California). After 3 min of baseline measurements, the subjects performed an incremental exercise.21 Thereafter, the work rate was increased incrementally in 1-min intervals until a symptom-limited end point was reached. The individualized exercise test protocol used in our laboratory usually results in a maximal oxygen uptake (maximum V̇O2) test duration of 8–12 min meeting standard exercise testing recommendations. Exercise variables were measured and averaged over the last 30 s of 1-min increments and at peak exercise. All subjects were encouraged to exercise until exhaustion or they felt unable to continue. Test termination criteria included volitional exhaustion, pedal rate note maintained at 50 rpm at each level of exercise and a leveling of oxygen uptake. Peak V̇O2 was defined as the highest V̇O2 that could be sustained for at least 30 s during the last stage of exercise.
Both inspiratory and expiratory air flow were obtained from the calibrated mass flow sensor (Vmax 2130 metabolic measurement system, Sensor Medics) and electronically integrated to obtain volume measurements. Measurements of V̇O2 and carbon dioxide production (V̇CO2) were made with the use of a computerized custom gas exchange. VT was determined as described previously.21,22 Three validated methods were used concurrently to determine VT from incremental exercise test data: (1) ventilatory equivalent method (V̇E/V̇O2 method),23,24 (2) excess carbon dioxide method (PETCO2),23,24 and (3) modified V-slope method.25 This point was measured in a double blind design, according to the best agreement between 2 independent observers. In case of disagreement (ie, more than 10% difference between the 2 observers), a third investigator was asked to assess the thresholds. The value retained was the average of the values in closer agreement. We used VT to differentiate between light-to-moderate and heavy-to-maximal exercise. Ventilatory threshold was designated as the work rate that was most congruent among the different threshold determination methods. Electrocardiography and pulse oximetry were carried out continuously, and blood pressure was taken by auscultation at rest, at the end of each stage of exercise, at peak exercise, and during recovery from exercise. SpO2 was measured noninvasively with a pulse oximeter (Avant 9600) at the finger to detect exercise-induced hypoxemia, which was defined as a drop in SpO2 > of 3–4% between rest and the end of the exercise.26 ΔSpO2 % was designated as arterial oxygen desaturation as indicated, by pulse oximetry (SpO2 rest − SpO2 maximal exercise). The modified Borg scale was used to record rating of perceived breathlessness (RPB) and perceived exertion at peak exercise.27 To avoid possible effects of performing IC maneuvers on dyspnea intensity, IC maneuvers were always performed after subjects completed symptom intensity ratings.
A minimum of 2 IC were measured during the last 30 s of each work load by having the subject, on cue from the investigator, inhale maximally from a stable EELV to TLC. Changes in EELV were inferred from these IC measurements.20 Maximal flow-volume loops were determined 2 min after termination of exercise to determine whether exercise had induced bronchodilation or bronchoconstriction.2,20
Data Analysis
For each subject tested, 2 drift-corrected tidal flow-volume loops were averaged for rest and at each exercise intensity. The average loops were then plotted separately within each subject's maximum flow-volume envelope (obtained at the same specific time point) to assess the degree of ventilatory constraint.
The degree of expiratory flow limitation was defined as the degree to which the tidal flows during exercise met or exceeded the maximum flow-volume envelope measured during the same time period.28 The expiratory flow limitation was expressed as the percentage of the tidal volume over which expiratory flow met or exceeded the maximum flow-volume envelope flow at the same lung volume.20
The ventilatory response to exercise was determined below and above ventilatory threshold by least squares regression as described previously.5,6 The slope was calculated according to the method of Wasserman et al.29 For accurate calculation, we discarded any irregularities at the start (ie, the first 1 or 2 min) of exercise or any plateau near the end of exercise, because the lactate threshold could potentially distort the response's linearity. The slope of V̇E versus work rate was calculated individually on all the points between rest and VT and between VT and peak exercise for controls, obese class II, and obese class III groups, respectively. The fit of these data were considered good based upon the average coefficient of determination (r2), which, below VT was 0.97 ± 0.04, 0.94 ± 0.06, and 0.91 ± 0.07 and, above VT, was 0.95 ± 0.05, 0.92 ± 0.05, and 0.90 ± 0.06 for controls, obese class II, and obese class III groups, respectively. The individual slopes were then averaged and used as indicators of ventilatory response below and above VT. To compare the V̇O2 and work rate relationship across groups that used different increments in work rate, we utilized the above method to calculate the slope of V̇O2 versus work rate between the initial work rate and VT. The average r2 below VT was 0.98 ± 0.05, 0.97 ± 0.04, 0.96 ± 0.03 and, above VT, the average was 0.98 ± 0.04, 0.96 ± 0.02, and 0.94 ± 0.06 for controls, obese class II, and obese class III groups, respectively.
Statistics
Differences between groups were determined with a one-way analysis of variance (groups × exercise intensity). When the one-way analysis of variance-F ratio was significant, the post hoc Bonferroni test was used to perform pairwise multiple comparisons. When the difference between only 2 means was to be tested (ie, slopes below and above VT), paired t tests were used. Relationships among variables were determined by Pearson correlation coefficients. Values are presented as means ± SD. A P value < .05 was considered significant.
Results
Subjects
Subject characteristics are shown in Table 1. Weight, BMI, and waist circumference/hip circumference were all significantly greater in the obese groups (P < .001). No differences were noted for age and height.
Subject Characteristics
Pulmonary Function
Pulmonary function data are presented in Table 2. Based on predicted values, all subjects had normal spirometry parameters. However, predicted TLC values decrease in obese class III in agreement with other studies,30–32 and obesity resulted in a progressive decrease in FEV1, FVC, FEV1/FVC ratio, peak expiratory flow, and TLC. Additionally, based on predicted values, PImax was significantly decreased with obesity.
Pulmonary Function Test Results
Exercise Capacity
Table 3 lists the peak exercise values obtained during testing. Comparison with predicted values for V̇O2 demonstrate a decline of exercise capacity with obesity; however, heart rate, predicted values, and rate of exchange ratio33 demonstrated maximal effort during testing and normal cardiorespiratory fitness for all 3 groups. Rates of perceived exercise were not significantly different between all 3 groups; however, RPB values were higher in massive obesity than in the mild obesity and control subjects. At maximal exercise, massive obesity was accompanied with a significant fall in SpO2 at end exercise (−6 ± 3%).
Maximal Exercise Values
Ventilatory Response to Exercise
V̇E is plotted against work rate in Fig. 1; significant differences were observed in V̇E between obese and control subjects at rest and at VT. At peak exercise, obese class III had a lower V̇E (P < .001) than both obese class II and control subjects. V̇E/MVV percentage was significantly higher (P < .001) in the obese class III than in control subjects at peak exercise (Table 3). V̇E/MVV was not significantly different between obese class II and control subjects at peak exercise. Among all subjects, a significant correlation was observed between TLC and peak V̇E (r = 0.88, P = .001). V̇E was significantly correlated with BMI (r = –0.72, P = .001). As indicated in Fig. 1, obesity resulted in a progressive increase in V̇E for a given submaximal work rate. The slope of V̇E below VT (ie, between rest and VT) was significantly greater (P < .001) in obese class III (0.55 ± 0.07 L/min/W) than in control subjects (0.27 ± 0.09 L/min/W) and obese class II subjects (0.35 ± 0.08 L/min/W). The slope of V̇E above VT (ie, between VT and maximal exercise) was not significantly different between groups (slopes: 0.65 ± 0.15 L/min/W; 0.60 ± 0.12 L/min/W; 0.63 ± 0.1 L/min/W, for control, obese class II, and obese class III groups, respectively). The slope of V̇O2 versus work rate below VT was significantly higher in obese class III than control subjects (P < .001). V̇E/V̇O2 and V̇E/V̇CO2 were significantly higher (P < .001) at rest in the obese class III group than in the control and obese class II groups (Table 4). At VT, V̇E/V̇O2 and V̇E/V̇CO2 were significantly different (P < .001) across all 3 groups. At peak exercise, V̇E/V̇CO2 was significantly higher in the obese class III than the control (P < .001) and obese class II groups (P < .0). PETCO2 was not significantly different between groups at rest and VT, however, at peak exercise, PETCO2 was significantly higher (P < .001) in obese class III than in control subjects. Dead space volume (VD)/tidal volume was estimated using PETCO2 (Table 4). At rest, there was a trend for VD/tidal volume to increase with obesity, although no statistical differences were observed between groups. VD/tidal volume was significantly higher (P < .001) in obese class III than in control and obese class II at VT and at maximal exercise.
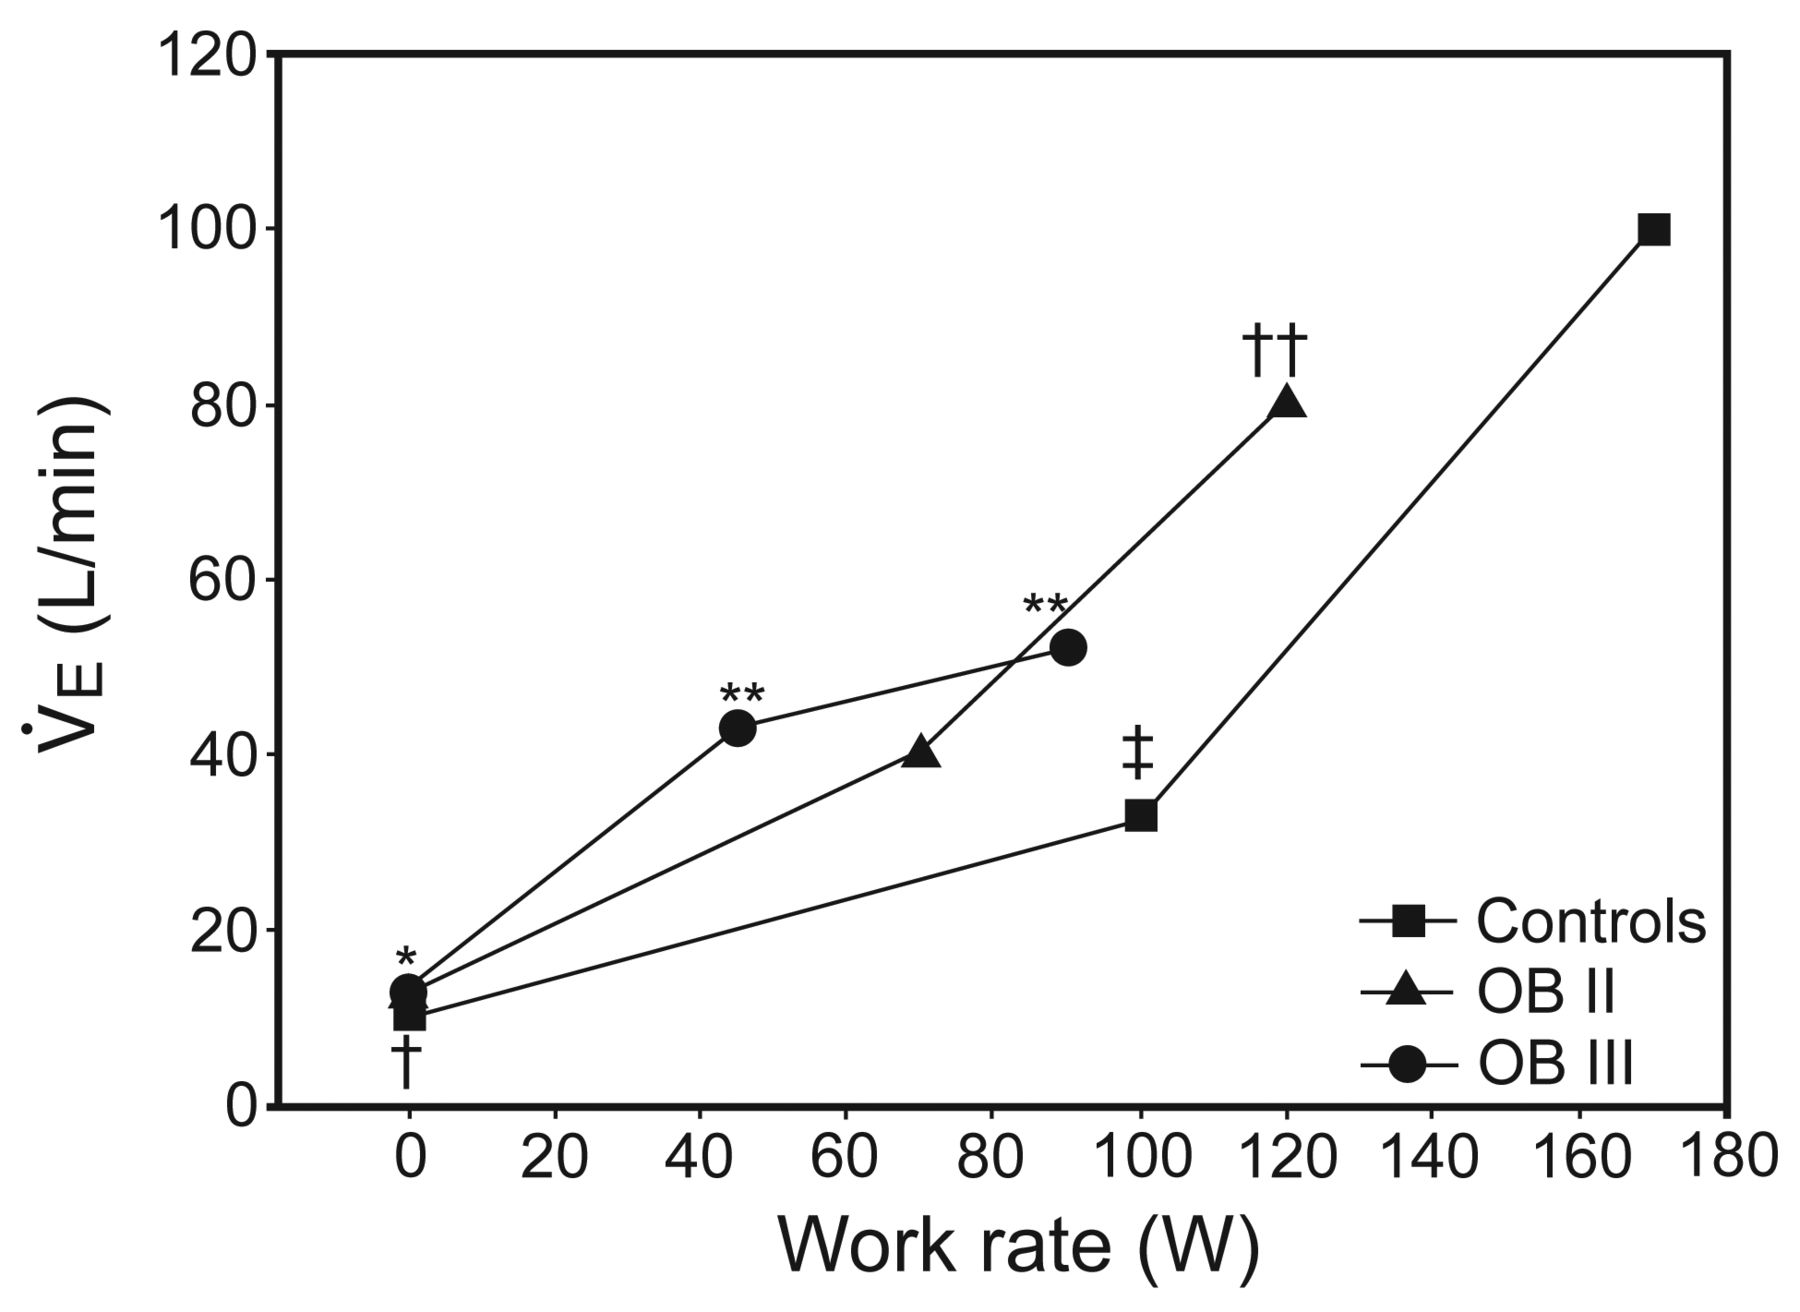
Minute ventilation plotted against work rate. Comparisons are between groups. First, second, and third points represent data at rest, ventilatory threshold, and maximal exercise, respectively. Class III obesity (OB III) vs control: * = P < .01, ** = P < .001; class II obesity (OB II) vs class III obesity: † = P < .05, †† = P < .001; control vs class II obesity: ‡ = P < .001.
Selected Ventilatory Variables
Breathing Mechanics
EELV were plotted against V̇E at rest, VT, and peak exercise (Fig. 2). EELV (% TLC) was significantly lower in the obese subjects at rest (P < .001), and during exercise at VT, but not during peak exercise. During heavy-to-peak exercise, the obese subjects increased EELV, whereas the control group continued to decrease EELV. Although both obese groups increased EELV during exercise above VT, only the obese class III group increased its EELV during exercise to levels above resting EELV. When the 3 groups were combined, resting EELV was significantly correlated with weight (r = −0.66, P = .001), BMI (r = −0.7, P = .001), and WHR (r = −0.72, P = .001). During peak exercise EELV was correlated with weight (r = 0.7, P = .001), BMI (r = 0.79, P = .001), and WHR (r = 0.89, P = .001), ΔSpO2 (r = 0.72, P = .001), PImax (r = −0.7, P = .001), and RPB (r = 0.82, P = .001).
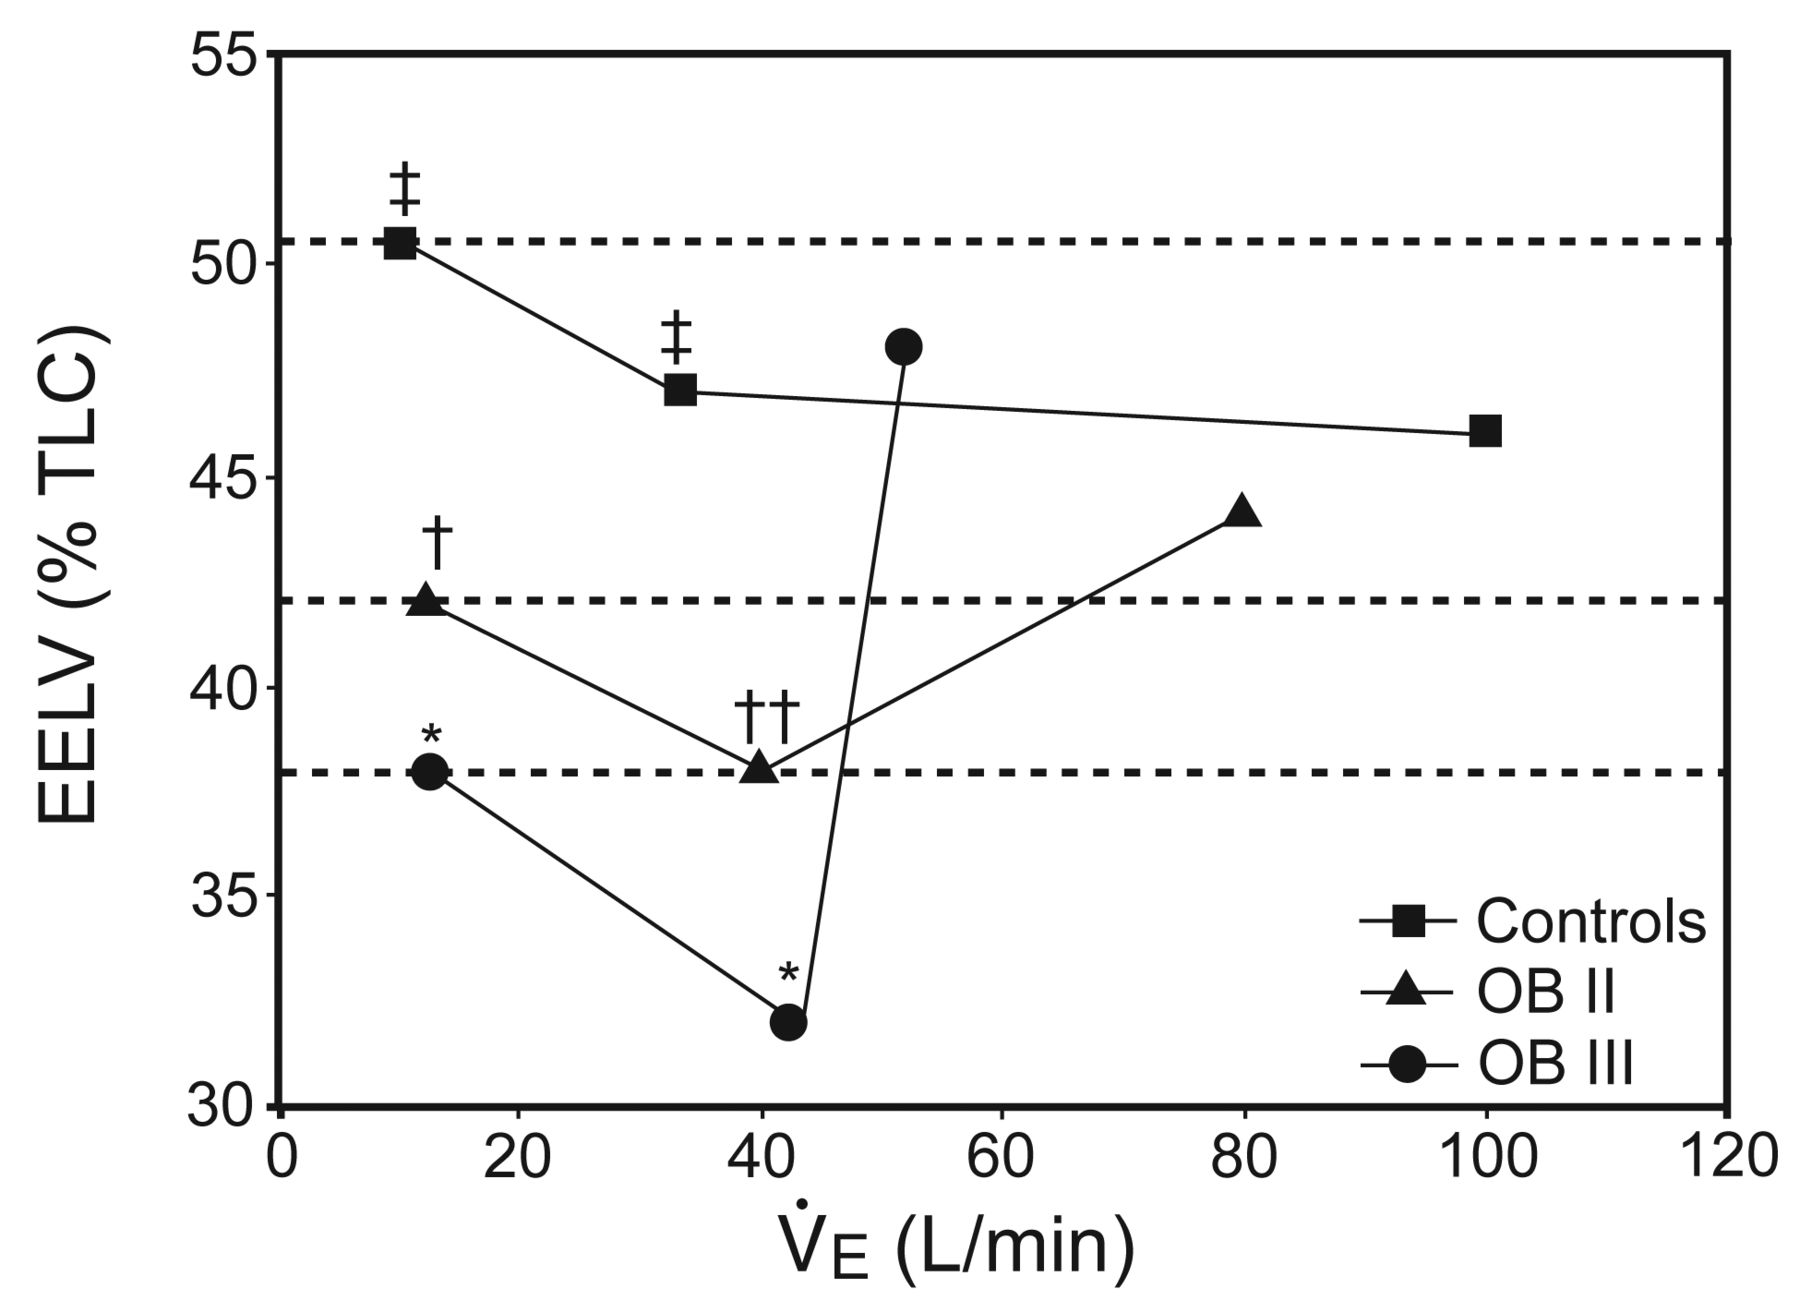
End-expiratory lung volume (EELV) as a percentage of total lung capacity (TLC) plotted against minute ventilation (V̇E). First, second, and third points represent data at rest, ventilatory threshold, and maximal exercise, respectively. Horizontal dashed lines indicate each group's resting EELV. Class III obesity (OB III) vs control: * = P < .001; class II obesity (OB II) vs class III obesity: † = P < .05, †† = P < .01; control vs class II obesity: ‡ = P < 001.
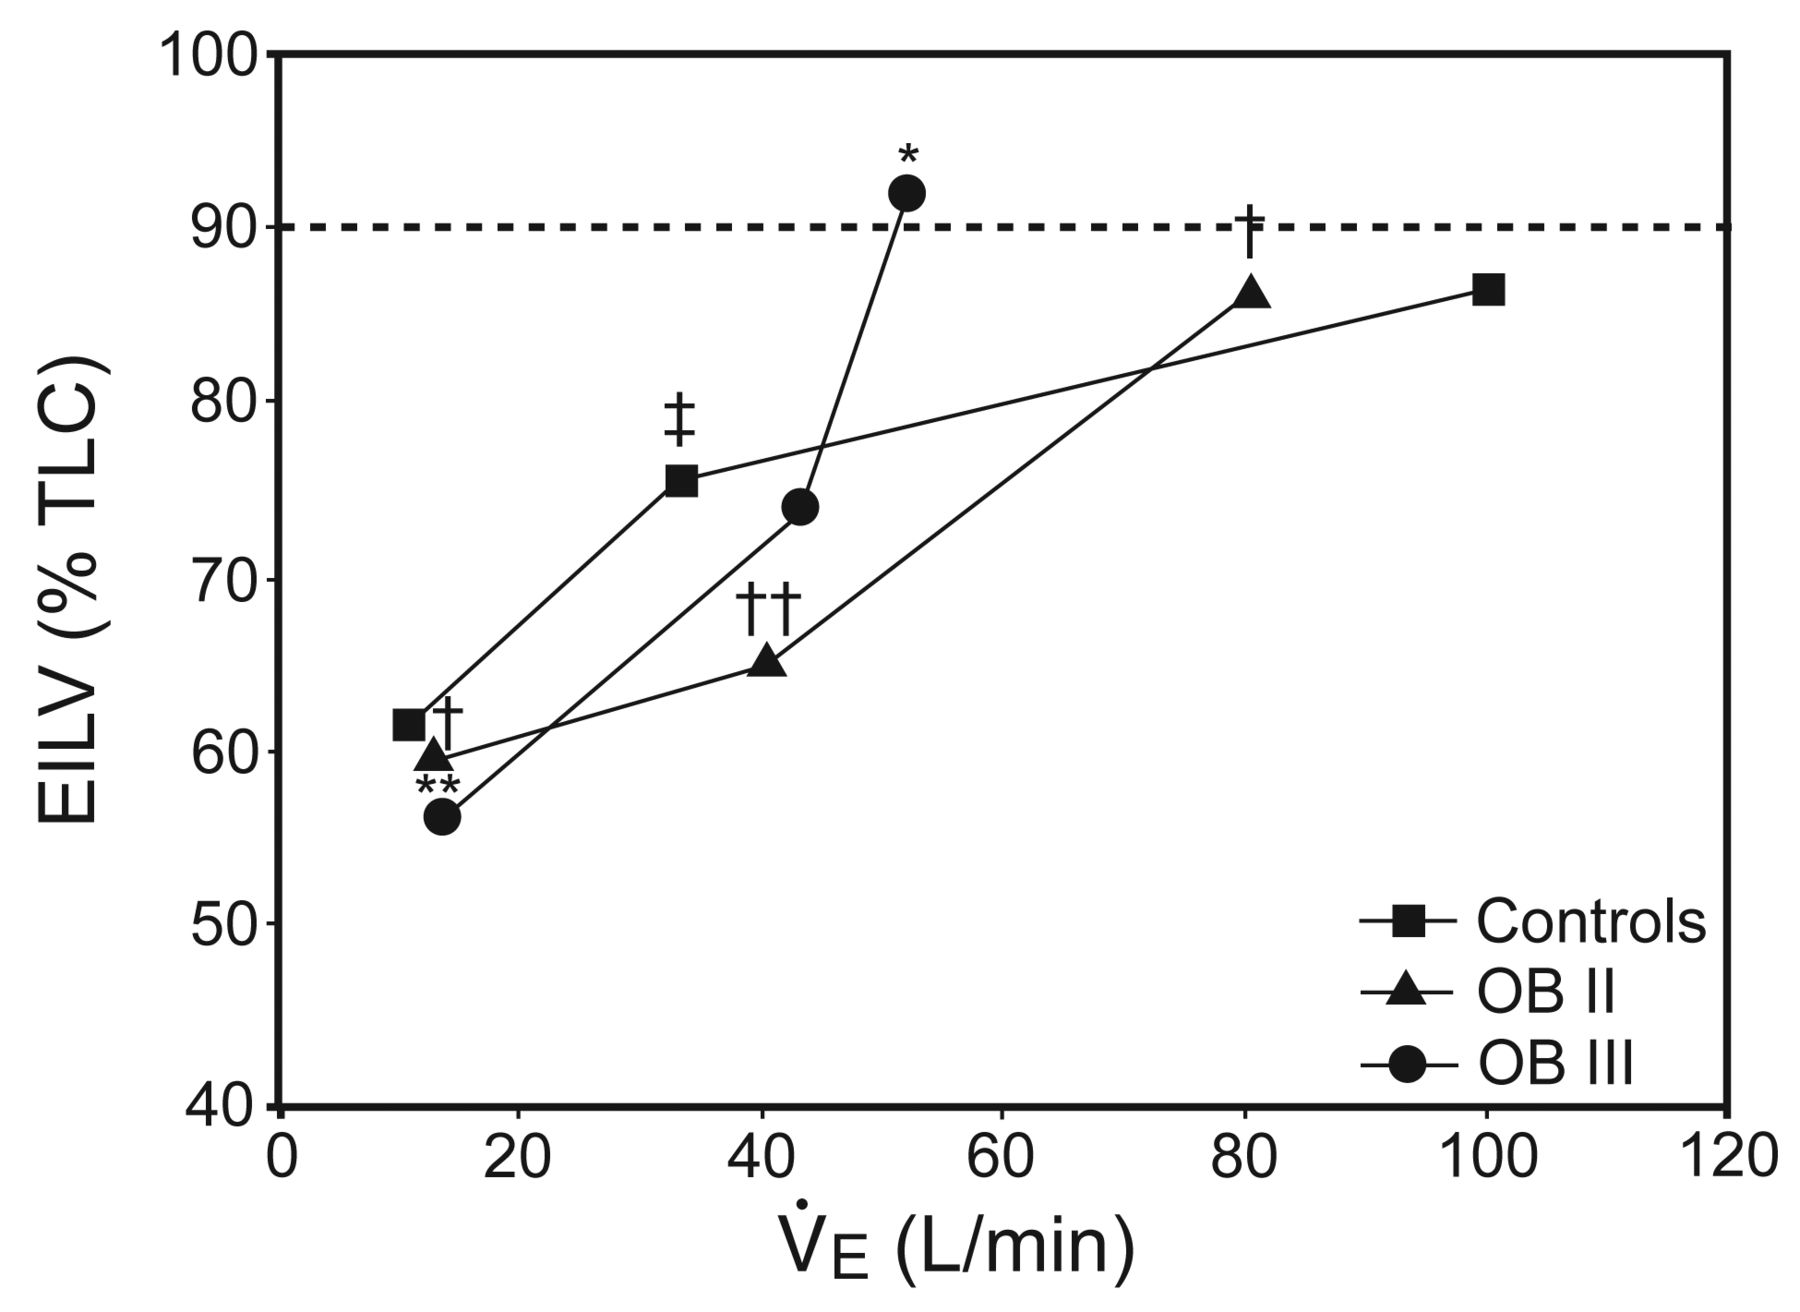
EILV (% TLC) are plotted against V̇E at rest, VT, and peak exercise (Fig. 3). EILV (% TLC) was significantly lower in the obese class II subjects and obese class III at rest and VT but not during peak exercise. At maximal exercise, obese class III subjects had a greater EILV (% TLC) than obese class II subjects and control subjects. When the 3 groups were combined, resting EILV was significantly correlated with weight (r = −0.7, P = .001), BMI (r = −0.74, P = .001), and WHR (r = −0.79, P = .001). At peak exercise, EILV (% TLC) was correlated with weight (r = 0.75, P = .001), BMI (r = 0.77, P = .001), WHR (r = 0.81, P = .001), ΔSpO2 (r = 0.74, P = .001), PImax (r = −0.72, P = .001), and RPB (r = 0.9, P = .001).

End-inspiratory lung volume (EILV) as a percentage of total lung capacity (TLC) plotted against minute ventilation (V̇E). First, second, and third points represent data at rest, ventilatory threshold, and maximal exercise, respectively. The dashed line shows 90% of TLC. Class III obesity (OB III) vs control: * = P < .01; ** = P < .001; class II obesity (OB II) vs class III obesity: † = P < .01, †† = P < .001; control vs class II obesity: ‡ = P < .001.
In Fig. 4, tidal volume and breathing frequency (f) are plotted against V̇E at rest, VT, and peak exercise. No differences in tidal volume were observed between groups at rest. Obese class III had a lower tidal volume than control and obese class II subjects at VT (P < .01) and peak exercise (P < .001). Breathing frequency (f) was significantly increased by obesity. Obese class III subjects had a greater f relative to control and obese class II subjects at rest (P < .05) and VT (P < .001). At peak exercise, f was significantly higher (P < .001) in obese class III than obese class II and control group.

Breathing pattern. Tidal volume (black symbols) and breathing frequency (white symbols) plotted against minute ventilation (V̇E). First, second, and third points represent data at rest, ventilatory threshold, and maximal exercise, respectively. Class III obesity (OB III) vs control: * = P < .001; class II obesity (OB II) vs obese class III: † = P < .05, †† = P < .01, ††† = P < .001; control vs class II obesity: ‡ = P < .001.
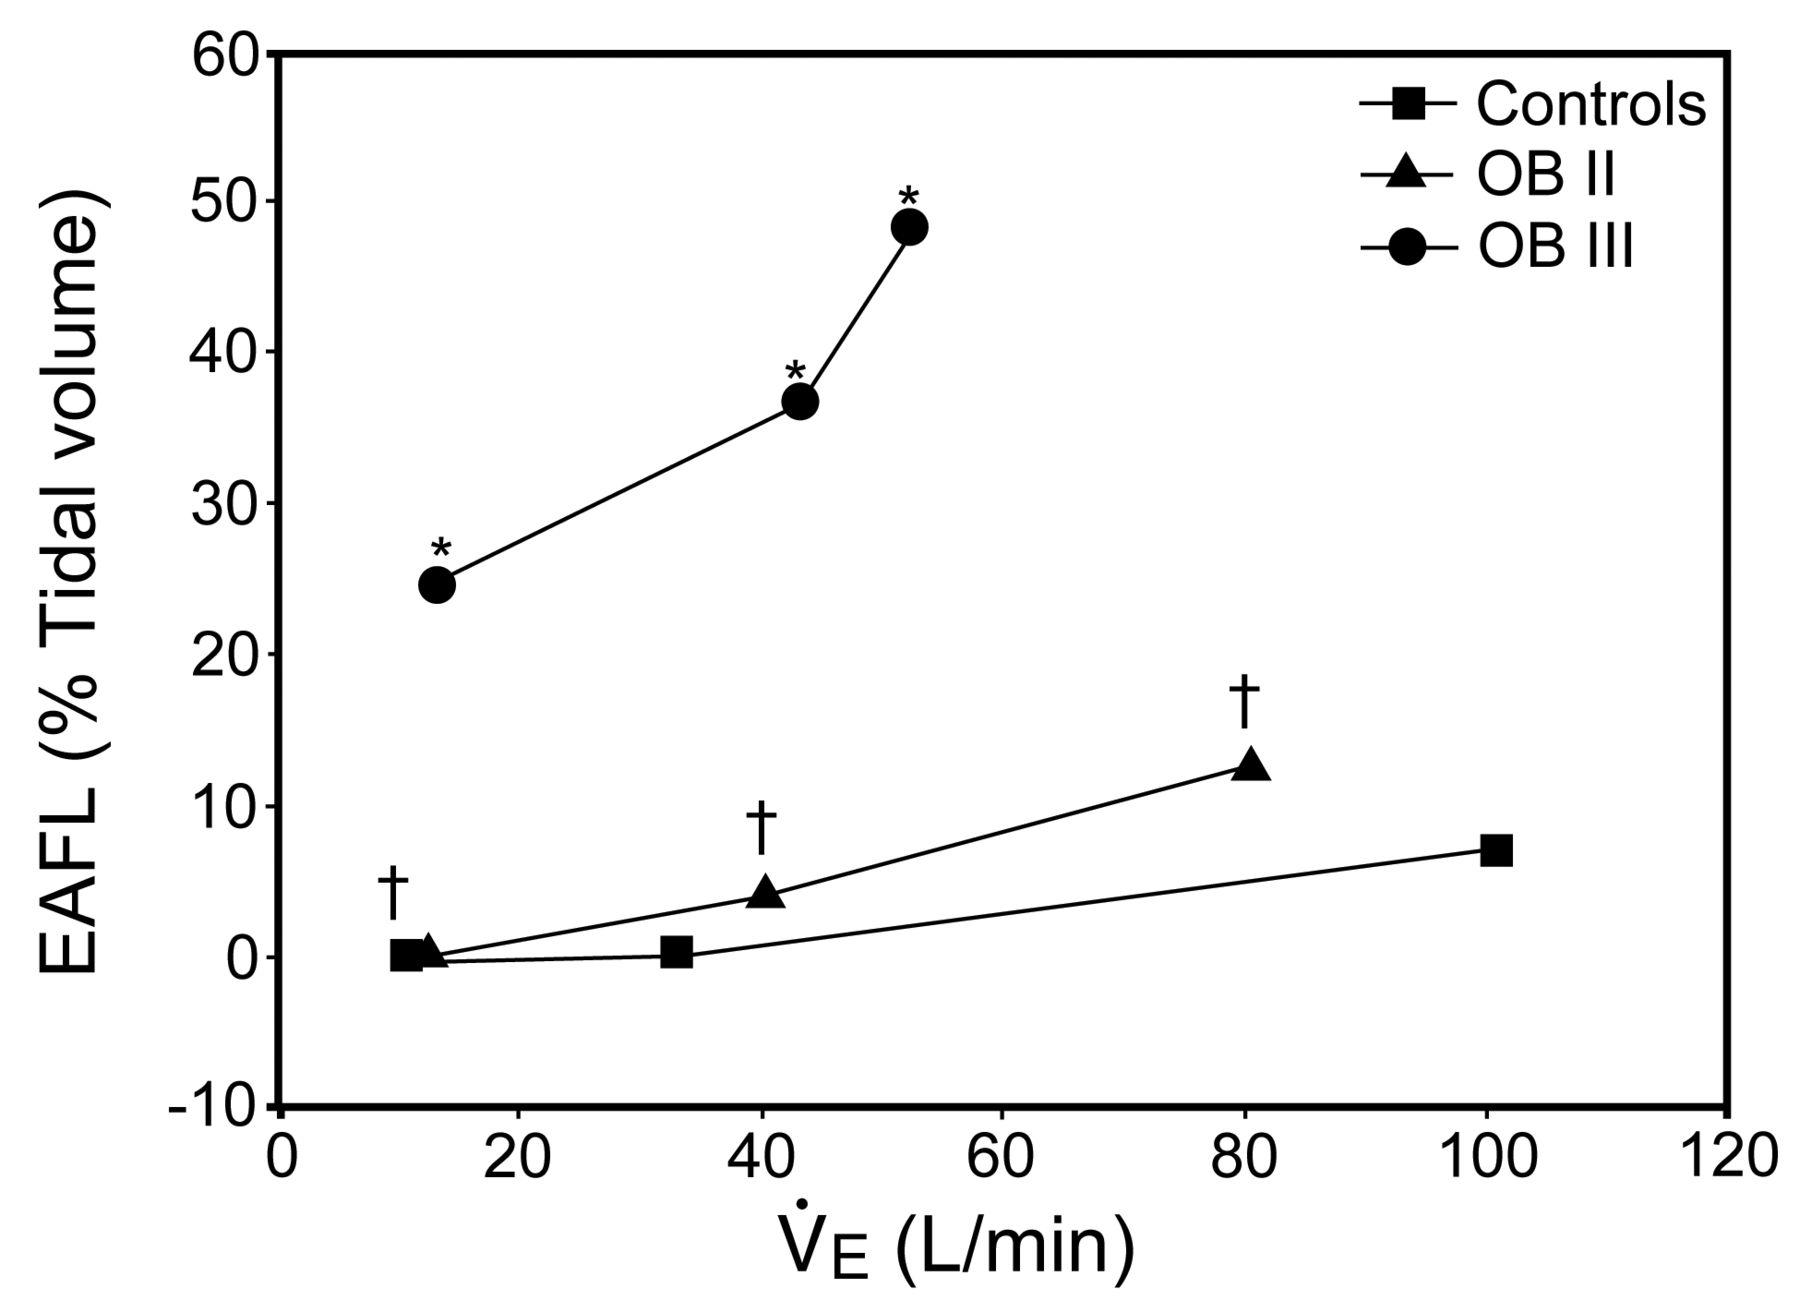
Expiratory air flow limitation (EAFL % tidal volume) is plotted against V̇E at rest, VT, and peak exercise (Fig. 5). EAFL progressively increased with obesity. Obese class III experienced greater EAFL at rest (24.5% tidal volume, P < .001), VT (36.5% tidal volume, P < .001), and at peak exercise (48% tidal volume, P < .001) than both control and obese class II subjects. When the 3 groups were combined, resting EAFL (% tidal volume) was significantly correlated with weight (r = 0.7, P =.001), BMI (r = 0.81, P = .001), and WHR (r = 0.85, P = .001). During peak exercise EAFL (% tidal volume) was correlated with weight (r = 0.71, P = .001), BMI (r = 0. 88, P = .001), and WHR (r = 0.86, P = .001), ΔSpO2 (r = 0.72, P = .001), PImax (r = −0.79, P = .001), and RPB (r = 0.87, P = .001).

Expiratory airflow limitation (EAFL) as a percentage of tidal volume plotted against minute ventilation (V̇E). First, second, and third points represent data at rest, ventilatory threshold, and maximal exercise, respectively. Class III obesity (OB III) vs control: * = P < .001; class II obesity (OB II) vs obese class III: † = P < .001.
Discussion
Our present findings indicate that mechanical constraints on V̇E during exercise increase progressively with obesity, because massively obese subjects demonstrated marked mechanical ventilatory constraints and an increased ventilatory requirement during exercise. These ventilatory constraints were evidenced by increases in EELV and EILV (which limited the VT reserve) and by expiratory flow limitation. The constraints appear to be closely related to exertional dyspnea and hypoxemia. To the best of our knowledge, this is the first study to examine the extent of ventilatory constraints in massive obesity and to determine how these constraints affect the ventilatory response to exercise.
The Ventilatory Response to Exercise
In this study, obese class III subjects displayed an elevated V̇E for a given submaximal work rate below VT. Obese individuals tend to have a rapid and shallow breathing pattern both at rest34 and during exercise.35 Presumably, adopting a more rapid, shallow breathing pattern optimizes WOB36 and helps avoid diaphragmatic muscle fatigue.37 A rapid, shallow breathing pattern can reduce peak inspiratory muscle effort and, therefore, optimize the O2 cost of breathing because, for a given V̇E, the combination of smaller tidal volume and higher f is most efficient by reducing the loading-related increased elastic forces. However, this breathing pattern becomes disadvantageous as dead space increases and the O2 cost of breathing increases with increasing f that is a lower ventilatory efficiency.38 Indeed, our results demonstrate that the slope of the linear V̇E/V̇CO2 relationship as an index of ventilatory inefficiency increased with obesity.21 Hence, observation of a greater V̇E/V̇CO2 ratio at rest and at VT in the obese class III argues in favor of an increase in dead space ventilation. Estimates of VD/tidal volume also revealed a tendency for the dead space to increase with obesity. However, if the increase in tidal volume was indeed limited by mechanical constraints in the obese class III, VD/tidal volume should have been higher in these subjects, relative to the other 2 groups. Our results demonstrate that exercise tolerance decreased with increasing obesity.36 This reduction is thought to be due to the added energy needed to move the fat mass during exercise. V̇O2 and V̇E were found to be higher in moderate to severe obese individuals39 than in control subjects during exercise at comparable work rates. The increased V̇O2 required for a given work load in obesity was thought to be due to the greater metabolic energy needed to move the increased body mass (ie, the increased leg mass) or to an increased WOB.40 V̇E/V̇O2 is greater at rest and during exercise41 in obese class III individuals, which implies reduced ventilatory efficiency. The physiological consequences of this relative inefficiency correspond to a reduction in the ventilatory reserve and a disturbance of homeostasis.
The observed increase in the slope of V̇O2 versus work rate below VT in our obese class III suggests that the latter had an increased metabolic demand. According to Hansen and colleagues,42 the slope for 1-min incremental cycle ergometer work is 10.2 ± 1.0 mL O2/min/W for normal subjects. Our obese class III had a mean slope of 15.5 ± 6 mL O2/min/W. This increase and the likelihood of an increased WOB are factors which could potentially contribute to the observed increased metabolic demand. Normally, for a given increment in work rate, V̇E increases at a greater rate above VT than below VT. The ventilatory response to exercise above VT appears to be adequate in the obese class III because the groups did not differ in terms of the slope of V̇E versus work rate above VT. Consequently, as a result of increased ventilatory demand during submaximal exercise, the obese class III began to encounter mechanical ventilatory constraints relatively early in the exercise session. Thus, it appears that our obese class III had already used a large portion of their ventilatory capacity before reaching VT and were prevented from further increasing V̇E by mechanical constraints. If there is a progressive increase in mechanical ventilatory constraints with obesity, one would predict that obese class III would have an even smaller ventilatory reserve in which to accommodate an increased ventilatory demand. In agreement with several other studies, we observed a decline in V̇E and an increase in V̇E/MVV at peak exercise in obese class III (Table 3). Decrease in MVV may be explained by respiratory muscle inefficiency, increased upper airway resistance, and inspiratory flow resistance.8,9,43 The decline in MVV in obesity may be due to increased tissue resistance, increased intra-abdominal pressure in obese persons, exaggeration of the normal spinal curvature due to forward displacement of the center of gravity of the body thus causing profound thoracic kyphosis. It leads to elevation of the lower sternum and relative fixation of the chest in a position of moderate inspiration and consequently reduced expiratory reserve volume.43,44 Although V̇E/MVV is commonly used as an indicator of ventilatory constraint, it has been shown to be a poor indicator of mechanical ventilatory constraints and is misleading in mild COPD.45 This is probably also true for the obese class III.
Breathing Mechanics
The most distinctive mechanical effect of obesity is the decrease in EELV at rest and the subsequent increase at maximal exercise.46 The decreased EELV likely reflects the decreased chest wall and lung compliance known to be associated with obesity.3,5,8,47,48 The reduced EELV at rest associated with obesity appears to influence the regulation of EELV during heavy-to-peak exercise. This occurs by placing the obese subject at a lung volume that predisposes him to high expiratory resistance and expiratory flow limitation, which necessitates an increase in EELV to increase V̇E in concert with exercise intensity.8,43,49,50 Obese subjects adopt this strategy because (1) maximal expiratory flows decrease progressively with decreasing lung volume, and so breathing at a low lung volume is necessarily associated with a reduction in the expiratory flow reserve, which can fall even more in the presence of airway obstruction, and (2) maintaining an adequate VT would imply the need to reduce EELV.
Ventilatory reserve depends on 2 main factors: ventilatory demand and ventilator capacity. In our study, ventilatory capacity is affected by mechanical factors such as air flow limitation, operating lung volumes, and ventilatory muscle function.51 Thus, a reduction in ventilatory reserve may be explained by increased ventilatory demand during exercise) and/or reduced ventilatory capacity typically due to air flow limitation. Our result demonstrate that MVV, which measures both ventilatory mechanics and respiratory muscle function, was reduced in excessively obese subjects who had dyspnea.32,52 Our data demonstrate a progressive decrease in maximal ventilatory variables with obesity. MVV decreases with increasing BMI, suggesting that respiratory muscle function may play a substantial role in dyspnea and exercise intolerance.8,44,53 At the very least, it is plausible that impaired respiratory muscle function will impair ventilatory mechanics and produce dyspnea and exercise intolerance.53–55
In our study, obese subjects demonstrated a tendency to decrease PImax, when expressed as a percentage of the predicted value at an equivalent lung volume. The reduced inspiratory muscle strength indicated by PImax values confirms earlier reports.56 It may be beneficial to keep EELV low, to optimize inspiratory muscle length and force production. The regulation of EELV during exercise was similar during submaximal exercise in the control and obese subjects, with all groups decreasing EELV between rest and VT. A decrease in EELV constitute one of the most prominent effects of mild obesity on pulmonary function.3 As a result, EELV does not drop farther during exercise in contrast to that in normal subjects. Thus, there appears to be a lower limit to end-tidal volume, although the mechanism of this lower limit is unclear. Nevertheless, the lower EELV means that: (1) the work of breathing is not partitioned between the expiratory and inspiratory muscles, (2) there is an increased load on the inspiratory muscles to increase VT during exercise, and (3) there is an increased potential for expiratory flow limitation resulting from breathing at such a low EELV.3 All these effects increase the mechanical ventilatory constraints to exercise in the obese. This response is in agreement with earlier reports.3,5–7 However, during heavy to maximal exercise, normal subjects continued to decrease EELV from VT to peak exercise, whereas the obese subjects further increased EELV. It is important to recognize that EELV increases during exercise in massive obesity, decreasing the IC. This dynamic hyperinflation (DH) increases the respiratory system's ability to generate expiratory flow but also limits the maximum tidal volume and reduces the inspiratory muscles' ability to produce force by reducing their length, leading to the sensation of breathlessness.57,58 We found an excellent correlation between DH (ie, the increase in EELV) and dyspnea; it is well known that DH is an important contributor to the intensity and quality of dyspnea.59,60 This finding is in accordance with other studies reporting frequent complaints of exertional dyspnea in obese subjects.61 Diaphragmatic fatigue has not been consistently observed in obese subjects after incremental exercise but the sensation of dyspnea may act as a protective mechanism, reaching intolerable levels before the muscles actually fatigue. Our result contrast with the result of Ofir et al,7 which showed that the increases in EELV with exercise served to optimize operating lung volumes and to attenuate expiratory flow limitation so as to accommodate the increased ventilatory demand without increased breathlessness.
As ventilatory demand increases and the subject increases his/her EELV to avoid expiratory flow limitation and to take advantage of the higher available maximal expiratory air flows, EILV increases to maintain VT.2 When increases in EELV are coupled with an EILV approaching the TLC ceiling, the VT reserve is reduced, thus limiting VT. EILV averaged (86%) of the TLC in the obese class II and reached (92–97%) in obese class III. Johnson and colleagues20 reported that a high EILV (> 90% of a subject's TLC) results in increased ventilatory muscle work. Furthermore, many obese class III subjects experience EAFL, which can result in further increases in EELV.30,31,46 In the present study, obese class III subjects experienced EAFL % tidal volume at rest and throughout exercise. Expiratory air flow limitation promotes DH with a concurrent increase in the WOB, due to presence of intrinsic PEEP.31,46 The inhomogeneity of intrinsic PEEP within the lung (which is present under these conditions) may also contribute to impaired arterial oxygenation. Hypoxia has been found to increase EELV in healthy subjects and in patients with interstitial lung disease.62 Our results demonstrate that massive obesity resulted in greater gas exchange abnormalities. Obesity caused a significant increase in ΔSpO2 and an increased PETCO2 toward the end of progressive exercise, which probably reflected decompensation of the respiratory system with some degree of alveolar hypoventilation. Other potential explanations for SpO2 desaturation during exercise with massive obesity include increased ventilation-perfusion abnormalities.63
There are certain limitations of the present study. First, the PImax test is volitional and requires full cooperation. Accordingly, a low result may be due to lack of motivation and does not necessarily indicate reduced inspiratory or expiratory muscle strength. In future studies, it is preferable to use the sniff test or phrenic nerve stimulation.
Second, reduction in oxygenation is unlikely to be due to abnormalities of gas transfer. Measurement of gas diffusion can be useful because a decreased diffusing capacity is associated with arterial desaturation during exercise.
Finally, we relied on pulse oximetry to define gas exchange abnormalities, which may not be sensitive to small changes in oxygen tension. We did not measure arterial blood gases in this study. However, we believe that exercise oximetry is a clinically relevant test, because it is easily performed in the office setting and is generally accurate for important levels of desaturation.
Conclusions
Exercise limitation is a major feature of obesity. The impaired exercise performance in obese subjects is largely due to failure of the available ventilatory reserve to meet increasing ventilatory demands, as a result of increased ventilatory loads and impaired ventilatory muscle function. In the present study, obese class III subjects displayed a reduced VT reserve and used increases in f early in exercise to boost V̇E. This strategy was effective until they began to experience marked EAFL during exercise. The development of dynamic hyperinflation with a progressive increase in EELV imposes additional elastic load on the ventilatory system and is closely related to exertional dyspnea and hypoxemia; it therefore contributes to exercise limitation in obese class III subjects.
Acknowledgments
We thank the medical staff of the Department of Cardiac Rehabilitation of Corbie Hospital for their technical assistance and the obese subjects from the Nutritional and Physical Rehabilitation Department of Corbie Hospital for their dedication to the study.
Footnotes
- Correspondence: Mehdi Chlif PhD, Faculté des Sciences du Sport Allée P Grousset Campus Universitaire du Bailly F-80025, Amiens Cedex, France. E-mail: mehdi.chlif{at}gmail.com.
The authors have disclosed no conflicts of interest.
- Copyright © 2015 by Daedalus Enterprises
References
- 1.↵
- 2.↵
- 3.↵
- 4.↵
- 5.↵
- 6.↵
- 7.↵
- 8.↵
- 9.↵
- 10.↵
- 11.↵
- 12.↵
- 13.↵
- 14.↵
- 15.↵
- 16.↵
- 17.↵
- 18.↵
- 19.↵
- 20.↵
- 21.↵
- 22.↵
- 23.↵
- 24.↵
- 25.↵
- 26.↵
- 27.↵
- 28.↵
- 29.↵
- 30.↵
- 31.↵
- 32.↵
- 33.↵
- 34.↵
- 35.↵
- 36.↵
- 37.↵
- 38.↵
- 39.↵
- 40.↵
- 41.↵
- 42.↵
- 43.↵
- 44.↵
- 45.↵
- 46.↵
- 47.↵
- 48.↵
- 49.↵
- 50.↵
- 51.↵
- 52.↵
- 53.↵
- 54.
- 55.↵
- 56.↵
- 57.↵
- 58.↵
- 59.↵
- 60.↵
- 61.↵
- 62.↵
- 63.↵


