

Abstract
BACKGROUND: Pulmonary mechanics may play a role in exercise intolerance in patients with congenital heart disease (CHD). A reduced FVC volume could increase the ratio between mid-flow (FEF25-75%) and FVC, which is termed high dysanapsis. The relationship between high dysanapsis and the response to maximum-intensity exercise in children with CHD had not yet been studied. The aim of this work was to examine whether high dysanapsis is related to the cardiopulmonary response to maximum-intensity exercise in pediatric subjects with CHD.
METHODS: We retrospectively collected data from 42 children and adolescents with CHD who had either high dysanapsis (ratio >1.2; n = 21) or normal dysanapsis (control) (n = 21) as measured by spirometry. Data extracted from cardiopulmonary exercise test reports included peak values of heart rate, work load, V̇O2, V̇CO2, and ventilation parameters and submaximum values, including ventilatory threshold and ventilatory equivalents.
RESULTS: There were no significant differences in demographic and clinical parameters between the groups. Participants with high dysanapsis differed from controls in lower median peak oxygen consumption (65.8% vs 83.0% of predicted, P = .02), peak oxygen pulse (78.6% vs 87.8% of predicted, P = .02), ventilatory threshold (73.8% vs 85.3% of predicted, P = .03), and maximum breathing frequency (106% vs 121% of predicted, P = .035). In the high dysanapsis group only, median peak ventilation and tidal volume were significantly lower than 80% of predicted values.
CONCLUSIONS: In children and adolescents with corrected CHD, high dysanapsis was associated with a lower ventilatory capacity and reduced aerobic fitness, which may indicate respiratory muscle impairments.
Introduction
In 1974, Green et al1 coined the term “dysanaptic growth” to explain inherent differences in airway size, which could account for much of the intersubject variability in maximum expiratory flow-volume curves. Mead2 showed that dysanapsis manifests itself by an inverse relationship between the ratio of maximum flow at 50% of vital capacity (VC) divided by the VC, multiplied by the static recoil pressure of the lung at 50% of VC (max50/VC × Pst[L]-50). The more common way of describing dysanapsis was the use of mid-flows (FEF25-75%) to FVC obtained from forced vital capacity maneuvers, which is expressed as FEF25-75%/FVC. To date, the study of abnormal dysanapsis has been confined to conditions of lower than normal dysanapsis. A low dysanapsis (FEF25-75%/FVC < 0.8) may have important pathophysiological and clinical implications in patients with obstructive lung disease.3 Low dysanapsis was also found in response to eucapnic hyperventilation4 and during bronchial provocation tests.5–8 The use of FEF25-75%/FVC has also been used to predict lung function deterioration in subjects with cystic fibrosis by our group.9 To the best of our knowledge, the pathophysiological and clinical importance of high dysanapsis has not been studied.
It is well established that congenital heart disease (CHD) and cardiothoracic surgery affect the airways and lungs. Restrictive changes have been described in patients with CHD, predicted by factors such as a history of thoracotomy, complex CHD, scoliosis, and arrhythmias.10,11 This restrictive pattern demonstrates smaller lung volumes, but normal or above normal flows, as compared with predicted values from the general population. From the physiological aspect, the reduced FVC may bring about a relatively higher than normal FEF25-75% rate, represented by a high FEF25-75%/VC value (high dysanapsis). The ventilatory capacity is reduced in 20–30% of patients with CHD,11–15 whereas the potential relevance of the high dysanapsis to the impaired ventilatory capacity remains unknown.
Cardiopulmonary exercise testing (CPET) measures the integrative exercise responses involving the pulmonary, cardiovascular, neuropsychological, and skeletal muscle systems. This noninvasive, dynamic physiological test also permits the evaluation of both submaximum and peak exercise responses. Many parameters obtained during CPET provide clinically useful information that is particularly relevant to the assessment of patients with CHD.16,17 Although the cardiovascular response to exercise in patients with CHD has been thoroughly studied,18 a possible relationship between high dysanapsis and the exercise response measured by CPET has not yet been examined.
We hypothesized that a high dysanapsis at rest could be associated with different cardiovascular and ventilatory dynamics in resting and exercise conditions. Such research would improve our understanding of the unique pulmonary characteristics and the exercise response in patients with CHD.
The aim of this study was to examine whether the presence of a high dysanapsis, represented by a high FEF25-75%/FVC, is associated with altered aerobic fitness and ventilatory responses to exercise in children and adolescents with CHD.
QUICK LOOK
Current knowledge
A low mid-flow/vital capacity ratio (termed low dysanapsis) was previously found to correlate with eucapnic hyperventilation, bronchial hyper-reactivity, and a lower response to exercise. There is growing interest in the ventilatory aspect of congenital heart disease (CHD) and following cardiothoracic surgery, because pulmonary restrictive changes have been described in patients with these conditions.
What this paper contributes to our knowledge
Children with CHD who had high dysanapsis on resting spirometry had lower aerobic fitness compared with participants with no dysanapsis and a low ventilatory capacity. Their median peak ventilation and VT values were significantly lower than expected, and their breathing frequencies were not elevated to higher-than-normal values as seen in controls. High dysanapsis could be related to an altered cardiopulmonary response to exercise in children with CHD.
Methods
Participants
This retrospective study included data from children and adolescents with CHD, younger than 18 y, having no other co-morbidities, who were referred to our center for CPET between the years 2011 and 2015. We excluded data from children with CHD who had undergone a univentricular repair, namely Glenn and/or Fontan procedures, because of their unique hemodynamic physiology. Spirometry reports from the day of the CPET test were reviewed consecutively to identify subjects with CHD with high FEF25-75%/FVC (high dysanapsis ratio, defined arbitrarily as >1.2) and an equal number of subjects with normal FEF25-75%/FVC as controls (“no dysanapsis,” defined as a ratio between 0.8 and 1.2). Clinical data extracted from the medical records were age, sex, type of CHD and the corrective procedures, age at first cardiac surgery, and the time elapsed since the last surgical intervention. We determined the degree of CHD correction status by the absence or presence of significant anatomical residua on a resting 2-dimensional echocardiogram, as performed previously.18 The study was approved by the institutional review board of Sheba Medical Center, Israel, and conducted according to the Declaration of Helsinki and its amendments (SMC-9628-12).
Measurements
Before each CPET session, height was measured using a wall-mounted stadiometer (Seca 206, Seca GmbH & Co, Hamburg, Germany), to the nearest 0.1 cm. Weight was measured using an electronic scale (BC418-MA, Tanita, Tokyo, Japan) to the nearest 0.1 kg. Body mass index was calculated as weight in kg divided by the square of height in meters.
Pulmonary Function Tests
All participants underwent spirometry tests performed according to American Thoracic Society/European Respiratory Society recommendations19 before the exercise test, using the ZAN ErgoSpiro 680 system (nSpire Health, Longmont, Colorado). Each spirometry session comprised 4–8 forced expiratory maneuvers to yield the best technically satisfactory forced expiratory flow-volume curves. Normal predicted spirometry values for each parameter were obtained from the Global Lung Function Initiative reference value tables.20 FEF25-75%/FVC values (measured and predicted) were calculated. Participants were excluded if they had technically unsatisfactory flow-volume curves suggestive of poor performance or exercise tests that were determined submaximum and of poor effort.
Cardiopulmonary Exercise Testing
The CPET protocol was an incremental progressive exercise test on an electronically braked cycle ergometer (Ergoselect 100, Ergoline GmbH, Bitz, Germany). After unloaded pedaling for 3 min, the work load was increased gradually by 5, 10, 15, or 20 W/min, according to the predetermined estimation of the individual's predicted peak work rate for children.21 The increase in work rate was calculated so that exercise duration would last between 8 and 12 min. Participants were instructed to maintain a pedaling rate of 60–65 rpm. The exercise test was terminated when the participant asked to stop, while reporting maximum ability and showing clinical signs of intense effort (eg, very heavy breathing or facial flushing), or when the required cadence could not be maintained for ≥5 s. The predicted age- and sex-dependent CPET values were obtained from recently published data.22
Gas Exchange Measurements and Definitions
Oxygen uptake (V̇O2), carbon dioxide production (V̇CO2), and minute ventilation were measured continuously throughout the CPET by a computerized breath-by-breath analyzer (ZAN ErgoSpiro 680, nSpire Health). An experienced exercise physiologist (OI) identified the ventilatory threshold. O2 pulse was calculated as V̇O2/heart rate/kg at peak exercise. Maximum voluntary ventilation (MVV) was estimated by multiplying FEV1 by 35, as has been shown to be suitable for children even with significant lung disease.23 The breathing reserve was calculated as MVV minus maximum ventilation at peak exercise (V̇E). The V̇E/carbon dioxide production (V̇E/V̇CO2) slope was measured at the early stage of exercise, where the curve has a linear progression. The dead space, expressed as VD/VT, was calculated from the end-tidal CO2 partial pressure. Low fitness was defined as peak V̇O2 <83% predicted.24 Other values <80% of predicted were considered abnormally low.
Statistical Analysis
Study participants were paired post hoc by age, with a median age difference between pairs of 3.8 months. Sample size calculation for a 2-sided paired analysis of peak oxygen consumption revealed that 21 participants in each group will provide 80% power and an alpha of 5%, following an observed SD of 9.3 and a correlation coefficient of 0.5. Continuous variables were compared using the Wilcoxon signed-rank test. The one-sample Wilcoxon signed-rank test was used to evaluate whether the medians of peak ventilation and VT expressed as percent predicted differed significantly from 80% and whether the median peak breathing frequency expressed as percent predicted was significantly different from 100%. Proportions were compared using the McNemar test. IBM SPSS 23 (IBM Corp, Armonk, New York) was used for statistical analyses. A probability value of P < .05 was regarded as significant.
Results
We identified 21 children and adolescents with CHD and high dysanapsis (study group) and compared their data with 21 consecutive children and adolescents with CHD and no dysanapsis from the database (control group). Table 1 shows the clinical characteristics of participants from both groups. There were no significant between-group differences in participant age, anthropometric characteristics, types of CHD, or the corrective procedures performed. Figure 1 shows representative flow-volume curves from each study group.
Clinical and Spirometry Data of the Study Participants
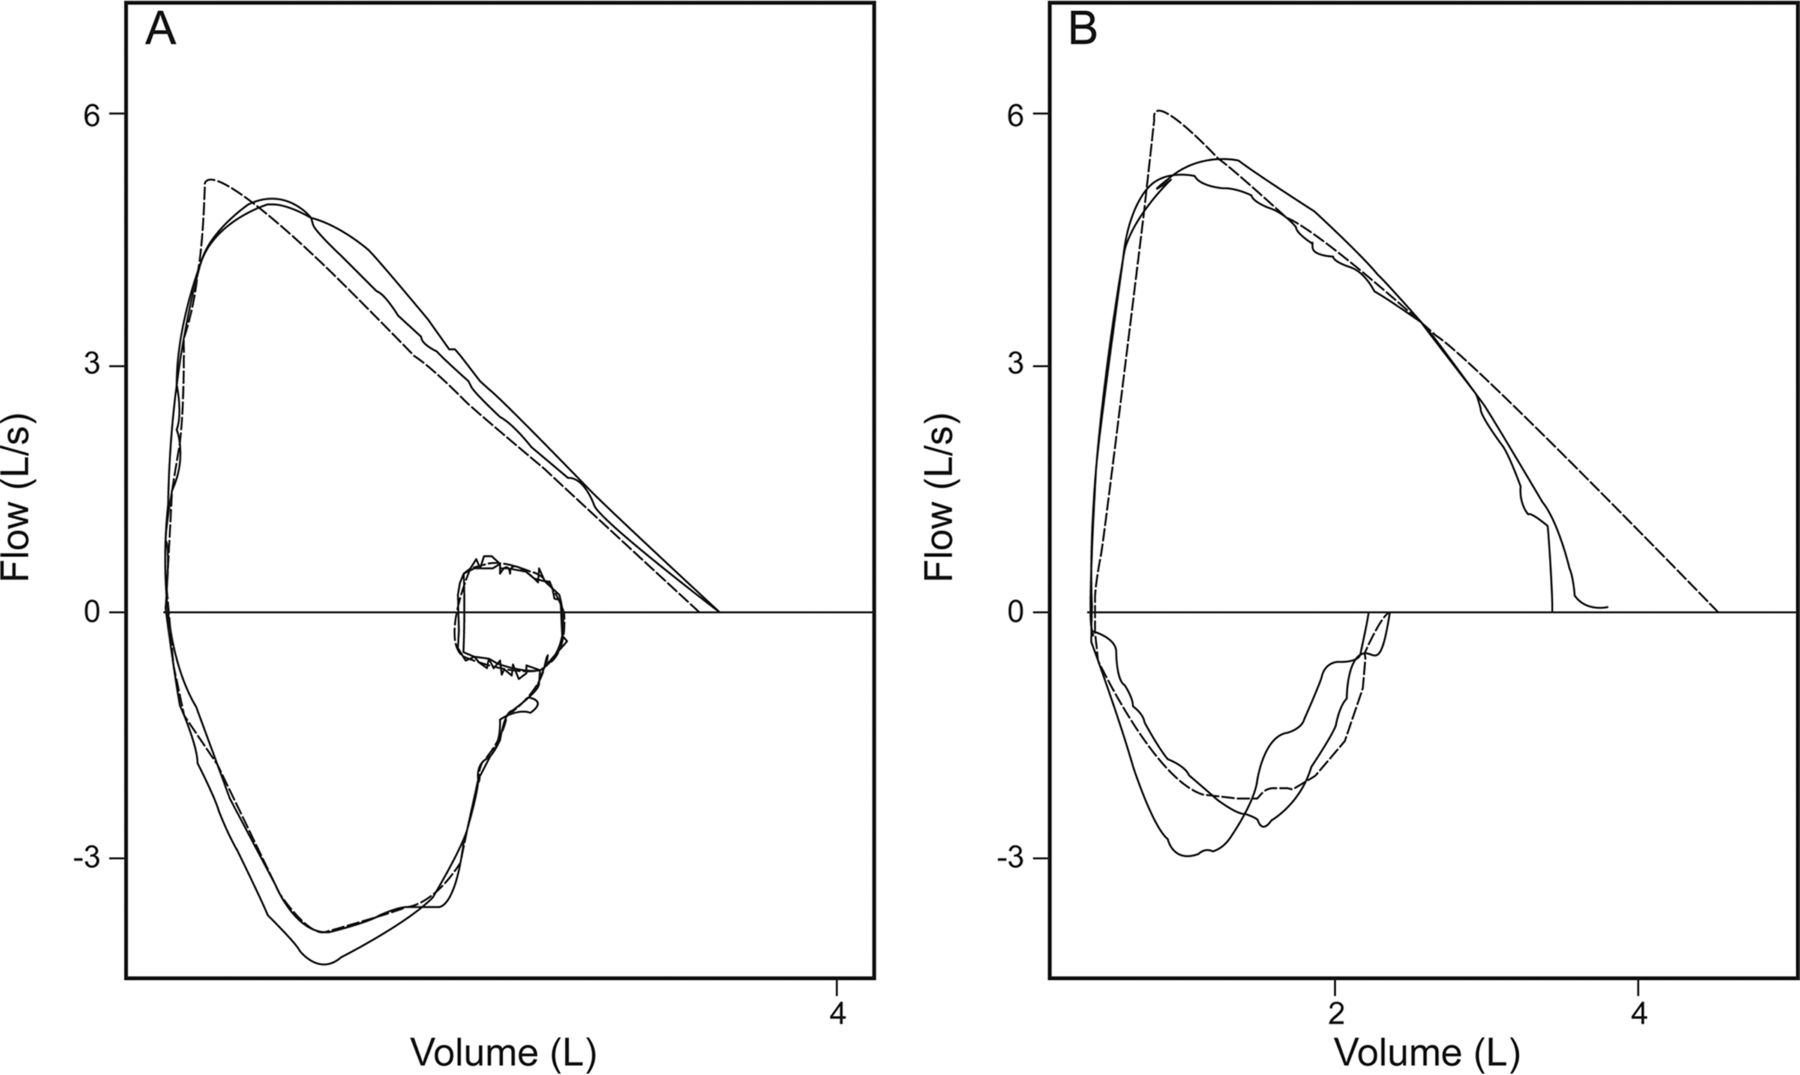
Representative flow-volume curves of a single subject from each of the study groups, exhibiting no dysanapsis (A) and high dysanapsis (B). The dashed line represents the predicted curve values.
Table 2 presents the results of spirometry tests in both study groups, expressed as a percentage from Global Lung Function Initiative predicted values. Median FVC values were comparable between groups, as was the prevalence of having a low FVC (<80% predicted) (7 of 21 (33%) in the high dysanapsis group vs 3 of 21 (15%) in controls, P = .34). Median FEV1 values were also comparable between groups, whereas the median FEV1/FVC expressed as percent predicted was higher in the high dysanapsis group. Median FEF25-75% expressed as percent predicted values was higher in the high dysanapsis group and higher than the calculated predicted values based on Global Lung Function Initiative norms. Median MVV did not differ significantly between groups; nor did the prevalence of having a lower than normal MVV (<80% predicted; 6 of 21 (29%) in the high dysanapsis group vs 3 of 21 (14%) in the control group, P = .51).
Lung Function Data of the Study Participants
Figure 2 presents the relationships between FEF25-75% and FVC (both expressed as percent predicted) values in both study groups. It can be seen that FVC values ranged between 40 and 127% predicted; therefore, participants with high dysanapsis did not necessarily have a decreased FVC. As noted above, only 7 subjects (33%) in the high dysanapsis group had an FVC <80% of predicted values.

The relationship between FEF25-75% and FVC, presented as percent predicted values, in both study groups. The dashed line represents FEF25-75%/FVC = 1.0.
Table 3 presents data on ventilatory parameters during the exercise tests in both study groups. The high dysanapsis group had a slightly lower peak ventilation compared with the no dysanapsis group, with borderline statistical significance. Median peak ventilation expressed as percent predicted was significantly lower than 80% only in the high dysanapsis group (P = .046). Median peak VT was lower than predicted values in both groups and did not differ significantly between them but was significantly lower than 80% of predicted only in the high dysanapsis group (P = .029). The high dysanapsis group had a lower median peak breathing frequency compared with the no dysanapsis group, both when expressed as absolute rate and as percent predicted. Peak breathing frequency was significantly higher than 100% only in the no dysanapsis group (P = .001). There were no significant between-group differences in measures of ventilatory efficiency, represented by ventilatory equivalents and end-tidal CO2 concentrations, or in the median dead space. All peak oxygen saturation values were normal (>95%) in both groups.
Ventilatory Parameters During Exercise in Both Study Groups
Table 4 presents data on cardiovascular parameters during exercise in both study groups. The high dysanapsis group had a significantly lower peak oxygen consumption, ventilatory threshold, and peak O2 pulse. There were no significant differences in peak heart rate or peak respiratory exchange ratio between groups.
Cardiovascular Parameters During Exercise in Both Study Groups
Discussion
In this study, we examined for the first time the significance of having a high FEF25-75%/FVC (high dysanapsis) in relation to the cardiovascular and ventilatory responses to maximum exercise in children and adolescents with CHD. We found that only 33% of participants in the high dysanapsis group had a lower than normal FVC, which was twice the proportion seen in the control group. The wide dispersion of FVC values in both study groups (Fig. 1) shows that the elevated FEF25-75%/FVC was not necessarily the result of a low FVC. Indeed, median FVC values did not differ significantly between groups; hence, collectively, it seems that the high dysanapsis group truly had large airways relative to the lung volume, and this is not merely an issue of small VC. Our findings complement previous studies that showed that an abnormally low FVC in patients with CHD was associated with reduced exercise capacity, possibly related to the effect of surgery.11,25–27
The major finding seen in the ventilatory response to exercise in the high dysanapsis group was that median peak ventilation was significantly lower than 80% of predicted values and also lower than in the no dysanapsis group with borderline statistical significance. There was no significant between-group difference in peak VT, yet it was significantly lower than 80% of predicted only in the high dysanapsis group. The main finding related to the cardiovascular response to exercise was a significantly lower aerobic fitness in the high dysanapsis group.
Peak ventilation and VT values were lower than predicted values in both study groups but were significantly lower than 80% predicted only in the high dysanapsis group. The lower peak ventilation seen in the high dysanapsis group, with borderline statistical significance, can be attributed to both low VT values and the lower breathing frequency compared with controls. This lower frequency can be explained by several potential mechanisms. First, it is possible that a decreased respiratory muscle strength, which was formerly described in young adults with congenital heart disease,28 resulted in not elevating the breathing rate to higher than normal values, as seen in the control group. Second, the primary heart defects and the surgical procedures that involved the chest wall and breathing regulation should also be taken into consideration. It has been shown previously that recipients of heart-lung or bilateral lung transplants have an altered regulation of breathing, with higher VT values and lower breathing frequency, possibly attributable to denervation and intrapulmonary receptors.29,30 We have recently shown that in CHD subjects with an incomplete repair of their heart defect, V̇E was significantly lower, and V̇E/V̇CO2 was significantly higher, compared with fully corrected CHD subjects and with controls.18 Hence, the unique cardiac anatomy and function of this population is also linked to ventilation characteristics and efficiency. Given that peak heart rate and respiratory exchange ratio did not differ significantly between the study groups, it can be inferred that maximum effort was equally achieved in subjects of both groups. The lower aerobic fitness seen in the high dysanapsis group could not, therefore, be attributed to lower exercise test effort.
In the present study, we found no significant differences between the groups in parameters relating to CHD type and level of correction. However, we acknowledge that not all aspects affecting cardiac function in CHD had been determined herein, such as diastolic function or the pulmonary vasculature. The significantly lower peak O2 pulse seen in the high dysanapsis group may indicate altered oxygen diffusion, transport, or uptake or a functional cardiac limitation. At present, we have no physiological explanation for the lower aerobic fitness seen in this population of young CHD subjects with high dysanapsis. It is also possible that high dysanapsis may be a marker of CHD severity, either before or after correction of the abnormalities, and not necessarily directly the cause of exercise limitation. Theoretically, the CHD in the high dysanapsis group could have led to differential growth of lung parenchyma and airways leading to high dysanapsis, for reasons yet unknown.
We acknowledge that this study has several limitations. We collected data from a relatively small sample, which restricted the depth of analyses that could be performed and probably hindered our ability to identify additional between-group differences. Our study was powered to detect differences in the main outcome measure of peak oxygen consumption and possibly not for other examined factors. Another limitation is that we did not measure lung volumes to formally establish the presence of restrictive lung disease and used the spirometry data obtained before the CPET. Since FEV1/FVC values were significantly higher in the high dysanapsis group, suggesting a higher elastic recoil, it is still possible that with a larger sample size, a statistically significant difference of the slightly lower FVC in the high dysanapsis group would be revealed. Hence, we cannot confidently exclude the possibility of greater pulmonary restriction in the high dysanapsis group. We acknowledge that we did not directly measure MVV and only calculated it from FEV1, and we do not have data on respiratory muscle strength. Further, we used noninvasive gas exchange, as routinely performed during CPET studies, and not direct blood gas measurements. Blood gas analyses would have yielded more accurate measurements of ventilation but would have required repeated blood sampling from exercising children and a prospective design. Our study may thus serve as a pilot study, through which sample sizes of future, larger studies can be determined, which should use a methodology more specific to restrictive ventilatory changes and respiratory mechanics.
Conclusions
In summary, in this study of dysanapsis in children with corrected CHD, it was found that participants with high dysanapsis had low aerobic fitness and maximum ventilation. It appears that participants with high dysanapsis did not compensate for the reduced peak VT by elevating breathing frequency above normal values, which may indicate respiratory muscle impairments or altered breathing regulation. Additional studies on ventilatory functions and respiratory muscle function in children after CHD correction are needed to better understand their limitations to exercise and pulmonary physiology.
Footnotes
- Correspondence: Daphna Vilozni PhD, Pediatric Pulmonary Unit, The Edmond and Lily Safra Children's Hospital, Sheba Medical Center, Tel Hashomer, Ramat-Gan 52621, Israel. E-mail: Daphna.Vilozni{at}sheba.health.gov.il.
This study was supported by the J Baum Foundation, Israel Lung Association. The authors have disclosed no conflicts of interest.
- Copyright © 2016 by Daedalus Enterprises


