

Abstract
BACKGROUND: Total lung capacity (TLC), forced expiratory flow between 25 and 75% (FEF25-75%), peak expiratory flow (PEF), or post-bronchodilator volume response is recommended to detect obstructive abnormalities in the lung. The present study was performed to evaluate the usefulness of these pulmonary function test (PFT) parameters to diagnose obstructive lung disease in subjects with a restrictive pattern of spirometry.
METHODS: A retrospective study was conducted in 64 subjects with a restrictive pattern of spirometry (normal FEV1/FVC and low FVC) out of 3,030 patients who underwent all pre- and post-bronchodilator spirometry and lung volume measurement between April 2008 and December 2010. After subjects were clinically classified into those with obstructive lung disease, restrictive lung disease, and mixed lung disease, the agreements between the clinical diagnosis and PFT classification according to TLC, FEF25-75%, PEF, and post-bronchodilator response criteria were compared.
RESULTS: Of 64 subjects, 18 (28.1%) were classified with obstructive lung disease, 39 (60.9%) had restrictive lung disease, 1 (1.6%) had mixed lung disease, and 6 (9.4%) had no clinical lung disease. Among the 58 subjects with clinical lung disease, 22 (37.9%), 37 (63.8%), 33 (56.9%), and 3 (5.2%) were classified as having obstructive pattern based on TLC, FEF25-75%, PEF, and post-bronchodilator response criteria, respectively. The kappa coefficients for the agreement between the clinical classification and PFT classification using TLC, FEF25-75%, PEF, and post-bronchodilator response criteria in 58 subjects were 0.59, 0.18, 0.17, and < 0.01, respectively.
CONCLUSIONS: The additional measurement of TLC is more useful than FEF25-75%, PEF, and post-bronchodilator response for diagnosis of obstructive lung disease in subjects with a restrictive pattern of spirometry, when obstructive lung disease is clinically suspected.
- airway obstruction
- maximal midexpiratory flow
- spirometry
- peak expiratory flow
- total lung capacity
- obstructive lung diseases
Introduction
Pulmonary function tests (PFTs) are fundamental noninvasive tests to assess obstructive and restrictive defects in patients with lung disease. However, some patients have obstructive lung disease and exhibit a restrictive spirometry pattern defined by normal forced expiratory volume in 1 second (FEV1)/forced vital capacity (FVC) and low FVC, which can cause false positive or false negative interpretations leading to inappropriate treatment selection in the absence of additional clinical information. The current interpretative strategy for PFT, as proposed by the American Thoracic Society/European Respiratory Society Task Force, recommends measurement of additional lung volume parameters to distinguish obstructive patterns from restrictive patterns in patients with normal FEV1/VC and low VC.1 In particular, total lung capacity (TLC) is considered as an important element to distinguish obstruction from restriction. In interpretative algorithms, the presence of a restrictive defect is suggested when both VC and TLC are below the lower limit of normal range.1 On the other hand, when VC is lower than the lower limit of normal and TLC is higher than the lower limit of normal, the presence of a restrictive defect can be excluded.1
The American Thoracic Society/European Respiratory Society Task Force suggests that additional PFT parameters, such as forced expiratory flow and post-bronchodilator improvement in FEV1 or FVC, may also be helpful in diagnosing obstructive lung disease in patients with a restrictive pattern. Likewise, several studies have shown that forced expiratory flow between 25 and 75% (FEF25-75%) is less effort-dependent and more reflective of small airway patency than FEV12–5 and that peak expiratory flow (PEF) may be a screening method for air flow obstruction.6,7 In addition, it has been well noticed that significant improvement in FEV1 or FVC after bronchodilator use is characteristic of reversible air flow limitation.1 Although a previous study investigated the clinical usefulness of TLC to identify obstructive lung disease, such as COPD and asthma, in subjects with restrictive pattern of spirometry,8 a comparison of the utility of TLC, FEF25-75%, PEF, and the post-bronchodilator response of FEV1 or FVC to identify obstructive lung disease in subjects with restrictive spirometry patterns has not yet been studied. Thus, the purpose of this study was to compare the agreement between clinical diagnoses and PFT interpretation using TLC, FEF25-75%, PEF, and post-bronchodilator response in subjects with restrictive spirometry patterns.
QUICK LOOK
Current knowledge
Pulmonary function tests are fundamental noninvasive tests to assess obstructive and restrictive defects in subjects with lung disease. However, some subjects have obstructive lung disease and exhibit a restrictive spirometry pattern. Several lung function parameters, such as total lung capacity, forced expiratory flow between 25 and 75%, peak expiratory flow, or post-bronchodilator volume response, are recommended to detect obstructive abnormalities in the lung, but comparison of lung function parameters to identify obstructive lung disease in subjects with restrictive spirometry patterns has not yet been studied.
What this paper contributes to our knowledge
Total lung capacity gives a strong relationship with clinical diagnosis of obstructive lung disease in subjects with restrictive spirometry patterns. The additional measurement of TLC is more useful than other lung function parameters, including forced expiratory flow between 25 and 75%, peak expiratory flow, and post-bronchodilator volume response, in diagnosing obstructive lung disease in subjects with a restrictive pattern of spirometry, when clinicians suspect obstructive lung disease.
Methods
Subjects
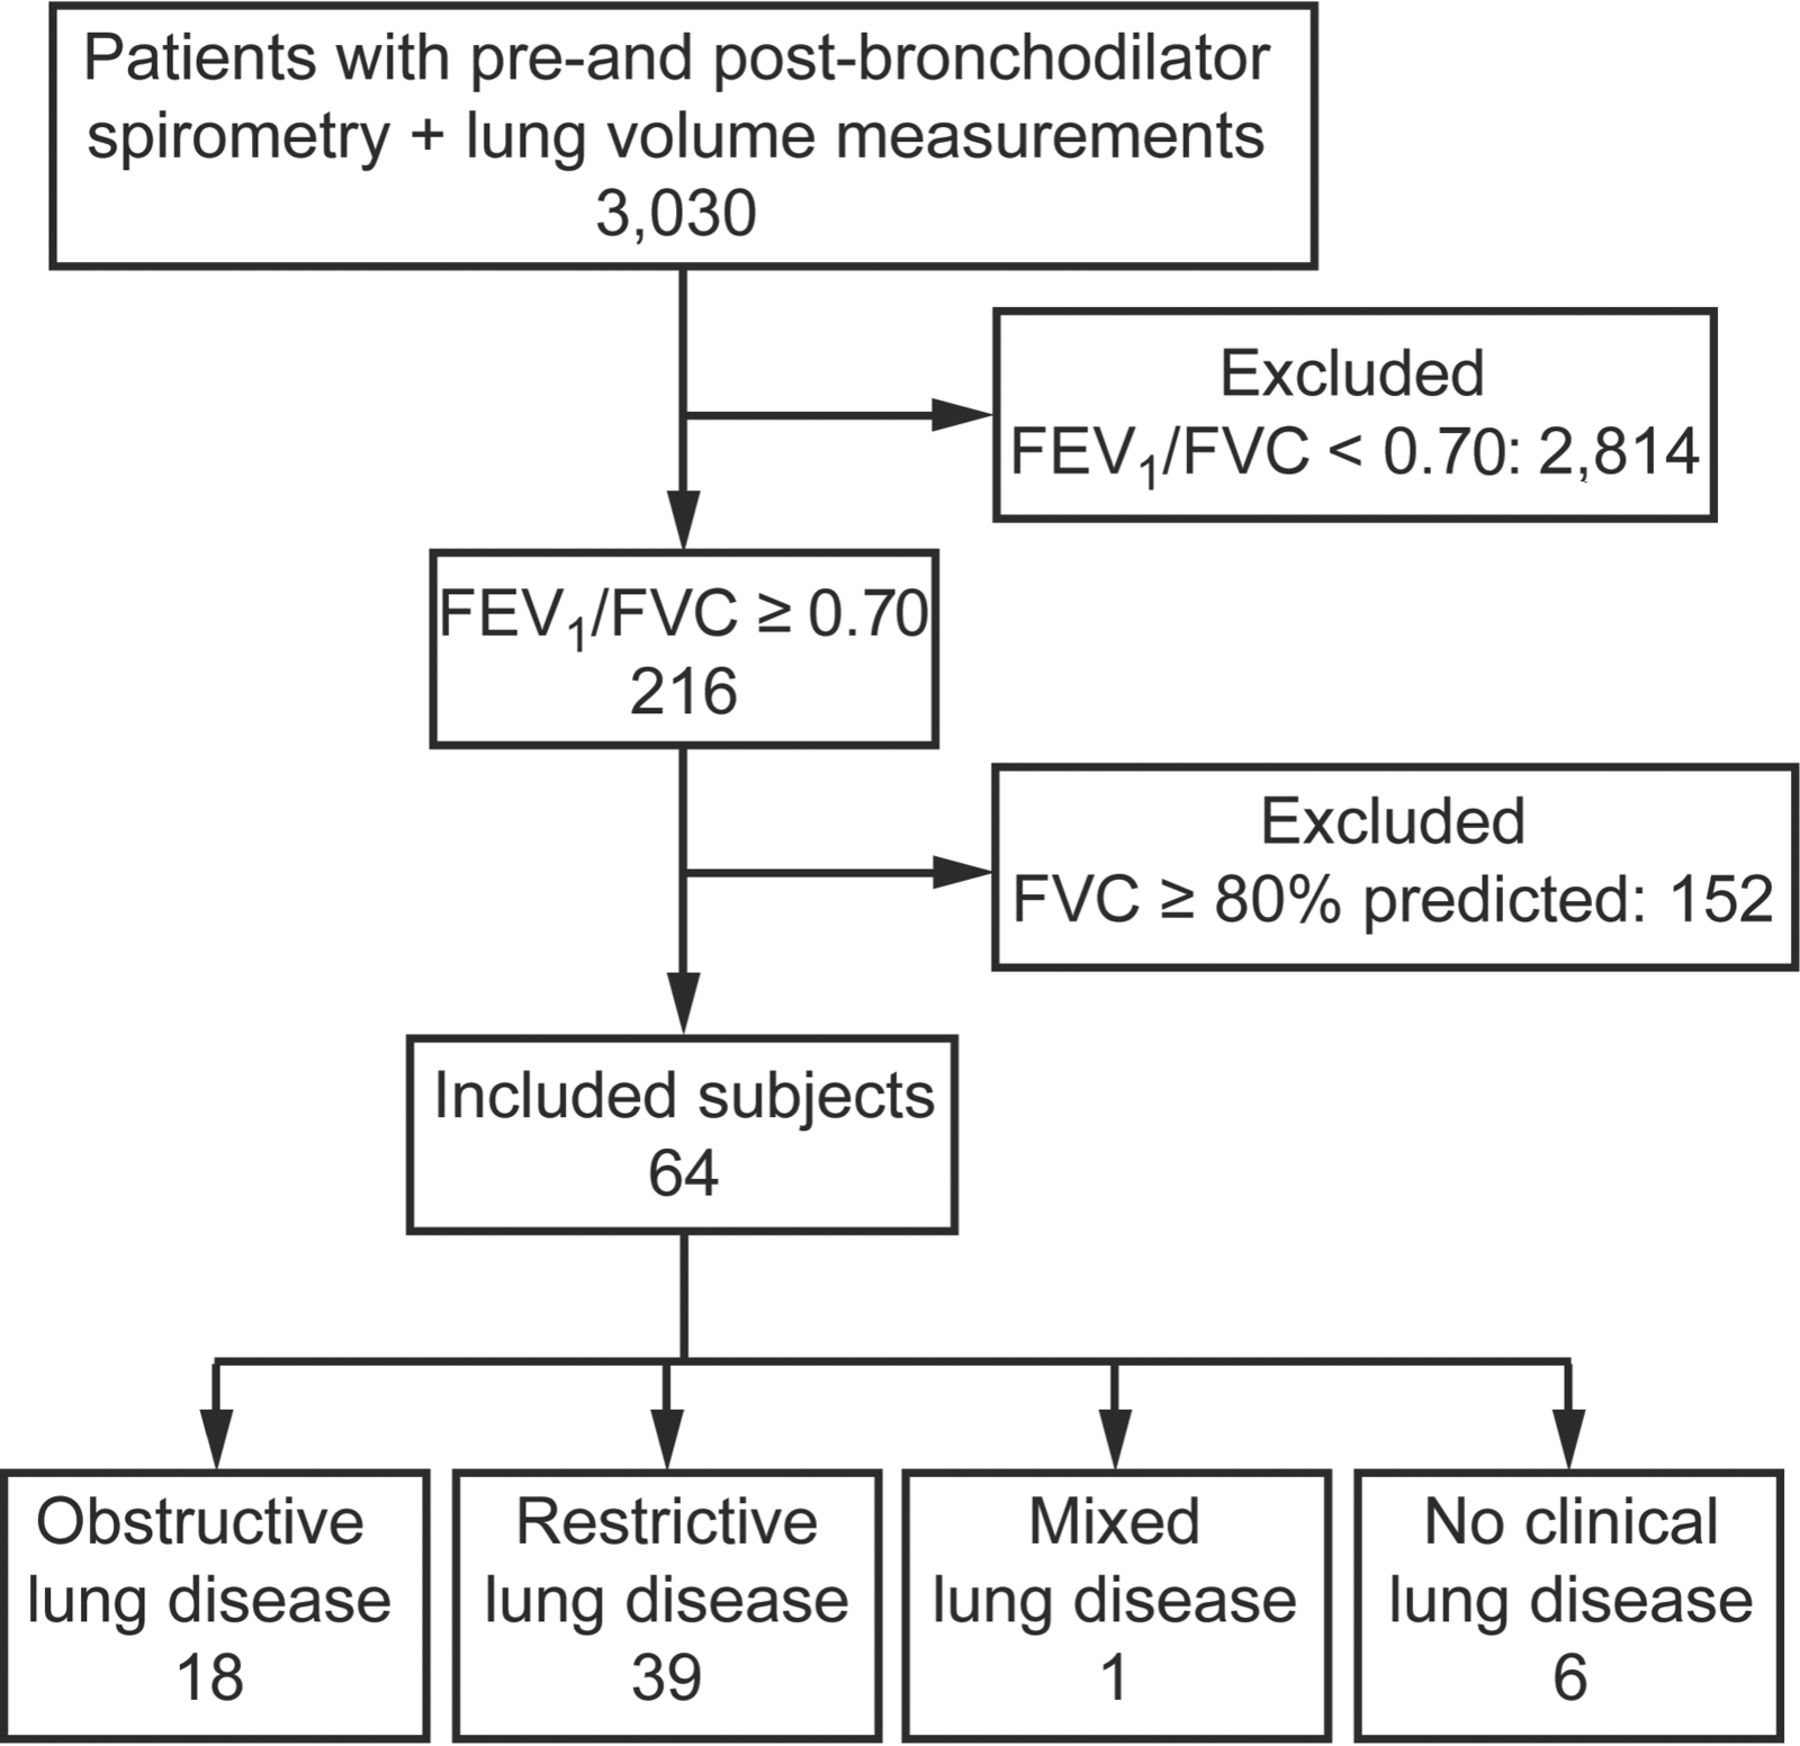
A total of 3,030 patients underwent PFT with pre- and post-bronchodilator spirometry and lung volume measurement at the Samsung Medical Center (a 1,961-bed referral hospital in Seoul, Korea) between April 2008 and December 2010. After excluding 2,966 patients including those with FEV1/FVC < 0.70 (n = 2,814) and those with FEV1/FVC ≥ 0.70 and FVC ≥ 80% predicted (n = 152), total 64 patients with FEV1/FVC ≥ 0.70 and FEV < 80% predicted were included (Fig. 1). When subjects underwent more than one PFT during the study period, data from only the first measurement were used in our analysis. This study was approved by the institutional review board of Samsung Medical Center; we were allowed to review and publish information obtained from patient records. The requirement for informed consent was waived.

Flow chart.
Measurement of Lung Function
Spirometry was performed as recommended by the American Thoracic Society9 using a Vmax 22 system (CareFusion, San Diego, California). Absolute values of FVC and FEV1 were obtained, and the percent predicted values for FEV1 and FVC were calculated using the reference equation obtained upon analysis of a representative Korean sample.10 TLC was measured using body plethysmography (V62J Body Box, CareFusion, San Diego, California), with predicted values calculated using the reference equations of the European Community for Coal and Steel,11 which have been shown to be the most suitable for determining lung volumes in Korean subjects.12
Classification of Clinical Diagnosis
Subjects were classified with obstructive, restrictive, mixed, and no clinical lung diseases by consensus between 2 pulmonary physicians who reviewed all medical records, chest x-rays, chest computed tomography scans, bronchoscopic findings, and treatments. Asthma, COPD, bronchiectasis, and bronchiolitis were classified as obstructive lung disease.13 Bronchial obstruction without atelectasis caused by endobronchial narrowing due to tuberculosis, endobronchial tumors, or extrinsic mass, were also classified as obstructive lung disease. Subjects who had idiopathic and connective tissue-associated interstitial lung disease, scoliosis, or neuromuscular diseases were classified as having restrictive lung disease. In addition, subjects who developed bronchiolitis obliterans organizing pneumonia after undergoing stem cell transplantation were classified as having restrictive lung disease.14 Lung cancers consisting of large tumors or having large amounts of pleural effusion or atelectasis were also diagnosed as restrictive lung disease. Post-lobectomy or pneumonectomy status, pleural disease, large volumes of ascites, diaphragmatic elevation, mitral valve disease,15 heart failure,16 benign atelectasis or lung volume loss, pneumonic consolidation, and multiple lung nodules were also included in the restrictive lung disease category. Subjects were designated as having mixed lung disease when criteria for both obstructive and restrictive disease were met. Subjects who were not defined by the criteria described above were classified as having no pulmonary disease.
PFT Interpretation
The presence of air flow limitation was assessed based on a fixed ratio; the criterion was defined as FEV1/FVC < 0.70. Of subjects with normal FEV1/FVC (≥0.70) and low FVC (<80% predicted),17 those with TLC ≥80% predicted,18 those with FEF25-75% <70% predicted,19 those with PEF <80% predicted,6,7 and those with a change in FEV1 or FVC of at least 12% and 200 mL1 were interpreted as having obstructive pattern by TLC, FEF25-75%, PEF, and post-bronchodilator response criteria, respectively.
Statistical Analysis
Data were presented as the number (percentage) of subjects for categorical variables and median with interquartile ranges for continuous variables. For the 4 PFT criteria, TLC, FEF25-75%, PEF, and post-bronchodilator response, kappa statistics were used to assess the concordance between obstructive lung disease diagnoses, for which mixed type disease was included as obstructive disease, and PFT classifications. In this analysis scheme, a kappa of >0.75 represented excellent agreement, 0.40–0.75 represented a fair to good agreement, and <0.40 was indicative of poor agreement.20 The performance of PFT classification in predicting clinically obstructive disease was also evaluated by sensitivity, specificity, positive predictive value, and negative predictive value. Concordance and prediction performance were compared between the PFT classification criteria using a bootstrapping-based nonparametric method that generated a null distribution of test statistics by resampling from the original data set with replacement data over a total of 1,000 iterations.21 All tests were 2-sided, and P values of <.05 were considered statistically significant. All analyses were performed using SAS version 9.4 (SAS Institute, Cary, North Carolina) and R 3.1.0 (R Foundation for Statistical Computing, Vienna, Austria).
Results
Clinical and PFT Classification
As shown in Table 1, the median age of the 64 subjects included in our final analysis was 57.0 y (interquartile range 45.0–65.0 y) and consisted of 35 men (54.7%) and 29 women (45.3%). All subjects were Korean. The baseline PFT results were as follows: median FEV1/FVC was 0.79 (interquartile range 0.74–0.84), median FVC was 2.3 L (67.0% predicted), median FEV1 was 1.8 L (70.0% predicted), median TLC was 3.8 L (77.0% predicted), median FEF25-75% was 1.8 L/s (61.5% predicted), and median PEF was 5.1 L/s (76.5% predicted), respectively. Of these subjects, 18 were classified as having obstructive lung disease, 39 as having restrictive lung disease, 1 as having mixed lung disease, and 6 as having no clinical lung disease (Table 2).
Baseline Characteristics of 64 Subjects With Restrictive Pattern
Clinical Diagnosis of 64 Subjects With Restrictive Pattern
Of the 58 subjects with clinical lung disease, 22 (37.9%), 37 (63.8%), 33 (56.9%), and 3 (5.2%) were classified as having obstructive pattern as determined by TLC, FEF25-75%, PEF, and post-bronchodilator response criteria, respectively (Table 3). Fifteen subjects met the criteria of obstructive pattern according to both TLC and FEF25-75% parameters, and 23 subjects met the criteria for both FEF25-75% and PEF parameters. Eleven subjects met the criteria of obstructive pattern according to 3 parameters, including TLC, FEF25-75%, and PEF parameters, whereas none met the criteria according to all 4 parameters.
Interpretation of Pulmonary Function Test Parameters of 58 Subjects With Clinical Lung Disease, Compared With Clinical Classification
Concordance Between Clinical and PFT Classifications
As noted in Figure 2, the PFT classification using TLC showed good agreement (κTLC = 0.59) with the clinical diagnosis of obstructive lung disease, whereas the PFT classifications obtained from the FEF25-75%, PEF, and post-bronchodilator response were in poor agreement (κFEF = 0.18, κPEF = 0.17, and κpost-BD < 0.01, respectively). As shown in Table 4, the difference in kappa values was significant between TLC and the other criteria (95% CI 0.10–0.71, P = .01 for κTLC vs κFEF; 95% CI 0.12–0.71, P = .01 for κTLC vs κPEF; 95% CI 0.32–0.85, P < .001 for κTLC vs κpost-BD). However, the difference among the other 3 criteria was not significant (P = .96 for κFEF vs κPEF, P = .17 for κFEF vs κpost-BD, P = .25 for κpost-BD vs κPEF).

The kappa coefficients for agreement in the diagnosis of obstruction between the clinical classification and the PFT classification using TLC, FEF25-75%, PEF, and post-bronchodilator response in 58 subjects with clinical lung disease. κTLC = the kappa coefficient for agreement in the diagnosis of obstructive disease between clinical diagnosis and total lung capacity (TLC) criteria; κFEF = the kappa coefficient for agreement in the diagnosis of obstructive disease between clinical diagnosis and forced expiratory flow between 25 and 75% of vital capacity (FEF25-75%) criteria; κPEF = the kappa coefficient for agreement in the diagnosis of obstructive disease between clinical diagnosis and peak expiratory flow (PEF) criteria; κpost-BD = the kappa coefficient for agreement in the diagnosis of obstructive disease between clinical diagnosis and post-bronchodilator response criteria.
Comparison of Kappa Value Between Various Pulmonary Function Test Parameters for the Diagnosis of Obstruction in 58 Subjects With Clinical Lung Disease
Prediction Performance of PFT Classifications
The sensitivity of the post-bronchodilator response criterion (5.3%) was significantly lower than TLC, FEF25-75%, and PEF criteria (79.0% for both TLC and FEF25-75% and 68.4% for PEF) (Table 5). The specificity of the post-bronchodilator response (94.9%) was slightly higher than the TLC (82.1%) criteria, although this difference was not statistically significant (P = .10). The FEF25-75% and PEF criteria exhibited significantly lower specificity (43.6 and 51.3%) compared with the other 2 criteria (all P < .001). Finally, the TLC criterion had a significantly higher positive predictive value (68.2%) than FEF25-75% and PEF (40.5%, P = .005 and 40.6%, P = .005) as well as a significantly higher negative predictive value (88.9%) compared with the post-bronchodilator response criterion (67.3%, P < .001).
Sensitivity, Specificity, Positive Predictive Value, and Negative Predictive Value of Total Lung Capacity, Forced Expiratory Flow Between 25 and 75% of Vital Capacity, and Post-Bronchodilator Response Criteria in the Diagnosis of Obstructive Lung Disease in 58 Subjects With Clinical Lung Disease
Discussion
In the present study, 29.7% of subjects with restrictive spirometry patterns were found to have clinically classified obstructive lung disease. The agreement of clinical diagnosis of obstructive lung disease with PFT interpretation using TLC was significantly higher than the agreements obtained with PFT interpretation using FEF25-75% or the post-bronchodilator response in subjects with restrictive patterns defined as normal FEV1/FVC and low FVC. In addition, the sensitivity and specificity of PFT interpretation using TLC for the diagnosis of clinical obstructive lung disease were 0.79 and 0.82, respectively, whereas the sensitivity and specificity of FEF25-75% were 0.79 and 0.44, and the sensitivity and specificity of the post-bronchodilator response were 0.05 and 0.95. Taken together, these results suggested that obtaining additional measurements for TLC might be useful for differentiating obstructive lung disease from other diseases that produce restrictive patterns of spirometry.
In general, air flow obstruction is diagnosed based on an FEV1/FVC <0.70 using spirometry alone. However, some subjects with obstructive lung disease have been reported to have restrictive patterns associated with normal FEV1/FVC and low FVC on spirometry due to concomitant decreases in FEV1 and FVC, which can cause false positive or false negative interpretations in the absence of other clinical information. One possible cause of this phenomenon is failure of the patient to inhale completely or exhale long enough to empty the lungs to the residual volume.1 In this situation, normal TLC will be recorded. In the present study, among 19 subjects with clinically classified obstructive lung disease (including 1 mixed disease), 15 subjects (78.9%) had concomitant decreases of FEV1 and FVC with normal TLC.
Another potential mechanism that may contribute to a restrictive spirometry pattern in patients with obstructive lung disease is patchy collapse of the small airways early in exhalation, which results in slowing in the terminal portion of the spirogram.1 To account for this possibility, the American Thoracic Society/European Respiratory Society Task Force suggested1 that TLC may be normal, and the FEF25-75% may be low. Moreover, when normal FEV1/FVC with concomitant low FEV1 and FVC persists upon sustained effort, the American Thoracic Society/European Respiratory Society Task Force also suggests repeating the spirometry after treatment with an inhaled bronchodilator in order to explore the presence of reversible air flow obstruction.1
The kappa coefficient between the clinical diagnosis of obstructive lung disease and PFT interpretation using FEF25-75% in the present study was poor. Although the sensitivity and negative predictive value of the FEF25-75% parameter were comparable with those of TLC, the specificity and positive predictive value of FEF25-75% were much lower than those of TLC. The FEF25-75% is the most commonly cited indicator of small airway obstruction. The FEF25-75% decreases more steeply at mild obstruction levels, which increases the sensitivity of FEF25-75% with respect to detection of air flow limitations. However FEF25-75% measurements can vary markedly and change in proportion to the FVC.22–24 In addition, abnormalities in mid-range flow measurements during forced exhalation are not specific for small airway disease in individual subjects.25 Interestingly, all of the subjects with asthma (n = 4, 6.3%) in this study, including 2 subjects with Churg-Strauss syndrome, exhibited a reduced FEF25-75%. Reduced FEF25-75% values are known to be associated with asthma severity, and several studies have shown that reduced FEF25-75% values are also associated with airway hyper-responsiveness21 and the bronchodilator response26 in subjects with asthma even with normal FEV1. In contrast, FEF25-75% was shown to play only a minor role in the early detection of COPD,27 and there was no correlation between FEF25-75% and other parameters used to measure air trapping (FVC and residual volume/TLC).27,28 Thus, the relatively small number of asthma subjects included in this study may have contributed to the poor performance of the FEF25-75% parameter.
The concordance and the prediction performance of PEF for the diagnosis of obstructive lung disease were comparable with those of FEF25-75% in this study. The PEF criterion showed poor kappa coefficient, lower specificity, and positive predictive value but had relatively higher sensitivity and negative predictive value. In line with our results, the previous study showed that reduced PEF can be useful to detect air flow obstruction in the general population,6 and another study revealed that the presence of severe COPD can be ruled out by a normal value of PEF.7 However, the overall performance of PEF for the diagnosis of obstructive lung disease was not as good as those of TLC, and the high degree of intrinsic variability of PEF should be taken into account for interpretation.6,29,30
Our results showed that use of post-bronchodilator response was poor with respect to differentiating obstructive lung disease from subjects with restrictive spirometry patterns. One study31 explored 21 subjects with concurrent restrictive spirometry patterns and post-bronchodilator responses and reported that 10 of the subjects had COPD or asthma, 1 had interstitial lung disease, and 2 had chronic inflammatory disease without evidence of lung involvement. In the present study, there were only 3 subjects with post-bronchodilator responses, 1 with lung cancer obstructing the left main bronchus and 2 with interstitial lung disease. There were no COPD or asthma subjects with concurrent restrictive patterns and post-bronchodilator responses, which was suggestive of a limitation of the clinical utility of the post-bronchodilator response.
In the present study, there were 6 subjects without evidence of pulmonary disease who exhibited restrictive spirometry patterns. All 6 of these subjects had clinical disease in the abdomen, comprising the mechanical ileus (n = 2), acute cholecystitis (n = 2), small bowel intussusception (n = 1), and ureteral injury (n = 1). These subjects underwent PFT to evaluate postoperative pulmonary complication risks. Incomplete inspiration and expiration due to abdominal pain may be a possible explanation for the restrictive spirometry patterns observed for these subjects.
A fixed ratio was selected over the lower limit of normal for the interpretation of PFT results in this study. First, a reference representing the midpoint of the normal range for healthy individuals of the same age, height, sex, and ethnicity is necessary to calculate the lower limit of normal. However, the reference data for lung volumes recommended by the American Thoracic Society/European Respiratory Society Task Force are based on data from individuals in European countries, and there are no available reference data for predicting the lower limit of normal range of lung volumes in Asia. Second, the fixed ratio (FEV1/FVC < 0.70) in Global Initiative for Chronic Obstructive Lung Disease guideline is more widely used than the lower limit of normal for the evaluation and management of obstructive lung disease.17
The present study had several limitations. First, the study was retrospective by design and was conducted at a single referral center. In addition, although 3,030 patients underwent all PFT with pre- and post-bronchodilator spirometry and lung volume measurements, there were relatively few subjects with restrictive spirometry patterns (2.8%) who met our criteria for inclusion in the study. Third, FVC instead of VC was used due to the lack of available reference values for FEV1/VC. Nevertheless, we believe that FVC is the most practical measurement (as an alternative to VC) in real clinical situations. Fourth, because it is not possible to obtain lung volume measurement in all clinics, the use of TLC may not be generalized to evaluate obstructive lung disease in all subjects with restrictive patterns of spirometry. Finally, although clinical diagnoses were made by consensus between 2 pulmonologists, there may have been information bias. To reduce this bias, we reviewed clinical information at follow-up visits; the median follow-up period after spirometry was 41.3 (interquartile range 6.2–56.6) months.
Conclusions
Obtaining an additional measurement of TLC is more useful than FEF25-75%, PEF, and post-bronchodilator response in diagnosing obstructive lung disease in subjects with normal FEV1/FVC and low FVC when clinicians suspect obstructive lung disease.
Acknowledgments
We thank Jiyu Sun (Biostatistics and Clinical Epidemiology Center, Samsung Medical Center, Seoul, Korea) for support of statistical analysis.
Footnotes
- Correspondence: Hye Yun Park MD PhD, Division of Pulmonary and Critical Care Medicine, Department of Medicine, Samsung Medical Center, Sungkyunkwan University School of Medicine, 81 Irwon-ro, Gangnam-gu, Seoul 135-710, Korea. E-mail: hyeyunpark{at}skku.edu.
The authors have disclosed no conflicts of interest.
- Copyright © 2016 by Daedalus Enterprises


