

Abstract
BACKGROUND: During O2 therapy at low flow in patients who breathe spontaneously, the fraction of delivered O2 (FDO2) is unknown. In recent years, FDO2 prediction formulas have been proposed. However, they do not take into account the effect of inspiratory flow (V̇I) on the FDO2. The aim of this study was to validate a new FDO2 prediction formula, which takes into account the V̇I and compares it with other FDO2 prediction formulas.
METHODS: During a bench study, spontaneous breathing was generated with a mechanical test lung connected to a mechanical ventilator set to volume control mode. O2 flow from a wall-mounted tube was delivered through a heat-and-moisture exchanger filter. A flow sensor recorded each breath of the V̇I in ambient temperature and barometric pressure conditions. Three parameters [O2 flow at 2, 3, 4, 5, 6 L/min; minute ventilation at 5, 10, 15, 20 L/min; and ratio of the inspiratory time (TI) to the total breathing cycle time (Ttot) (TI/Ttot) of 0.33 (TI/Ttot value) and 0.50 (TI/Ttot value)] were modified to generate many ventilatory patterns. An O2 analyzer continuously examined the FDO2.
RESULTS: When the O2 flow and/or TI/Ttot increased, the FDO2 increased. When the minute ventilation increased, the FDO2 decreased. The results of the Bland-Altman method for the FDO2, calculated by using our mathematical model and the measured FDO2, showed that the mean ± SD bias value was equal to 1.49 ± 0.84%, and the limits of agreement ranged from −0.17% to 3.14%. The intraclass correlation coefficients were 0.991 for TI/Ttot = 0.33 and 0.994 for TI/Ttot = 0.50, and the coefficient of variation was 2.1% for TI/Ttot = 0.33 and 1.3% for TI/Ttot = 0.50. The results of the Bland-Altman method for the FDO2 calculated by using the Shapiro formula and the FDO2 measured on the bench indicated that the bias value was 0.075 ± 8.66% and the limits of agreement ranged from −16.89% to 17.04%. For the Vincent formula, the bias value was 3.08% ± 8.56% and the limits of agreement ranged from −13.69% to 19.84%.
CONCLUSIONS: The V̇I has a major impact on FDO2 during O2 therapy at low flow. FDO2 comparisons between frequently used prediction formulas and FDO2 measured on the bench indicated greater differences. Uncritical use of these formulas should be used cautiously to predict FDO2. In this study, our prediction formula indicated a good accuracy for predicting FDO2 during supplemental oxygenation through a heat-and-moisture exchanger in patients who breathe spontaneously.
Introduction
When trying to wean the patient from mechanical ventilation, spontaneous breathing trials assess the patient's ability to breathe while receiving no ventilatory support. In general, these patients receive oxygen to avoid hypoxemia. During this period, the fraction of delivered O2 (FDO2) must be maintained within strict limits to avoid arterial oxygen variations. However, as reported by several studies, the FDO2 varies according to the O2 flow and/or the patient's respiratory pattern (eg, frequency, tidal volume).1,2,3 This raises the question about FDO2 prediction in patients who are intubated or tracheotomized oxygenated patients who breathe spontaneously with a Heat Moisture Exchanger (HME). In recent years, FDO2–validated formulas have been promoted.4,5 However, they only take into account the administered O2 flow and are only applicable in resting adult patients who breathe spontaneously and are oxygenated through a nasal cannula, transtracheal catheters, or a tracheostomy or endotracheal tube.4–6
Moreover, these formulas do not take into account the influence of the inspiratory flow (V̇I) on the variability of FDO2 when the patient receives O2 at low flow.7–19 Our hypothesis is that the V̇I has a major impact on FDO2 during O2 therapy at low flow and that these formulas are not accurate in clinical situations. The aim of this study was to validate a new FDO2 prediction formula that takes into account the V̇I and compares it with other formulas for use in patients who were tracheostomized or intubated and spontaneously breathing.
QUICK LOOK
Current knowledge
During O2 therapy at low flow when using a heat moisture exchanger, the fraction of delivered O2 (FDO2) can be estimated with prediction formulas. However, these formulas do not consider the effect of inspiratory flow on FDO2. The true FDO2 delivered in these cases is not precisely known.
What this paper contributes to our knowledge
Comparisons with prediction formulas typically used by clinicians show major differences between the FDO2 calculated and the FDO2 measured on the bench. Indiscriminate use of prediction formulas exposes the practitioner to errors in O2 administration assessment. Our study proposed a new prediction formula that takes into account minute ventilation and the ratio of the inspiratory time to the total breathing cycle time during oxygen delivery via a heat-and-moisture exchanger.
Methods
Part 1
The following FDO2 prediction formula was developed (FDO2 calculated [see the supplementary materials at http://www.rcjournal.com]) and compared with the FDO2 measured in a bench study (FDO2 measured).

 with O2 flow in L/min, minute ventilation (V̇E) in L/min, inspiratory time (TI) in seconds; and total inspiratory and expiratory time (Ttot) in seconds.
Model and Settings.
Spontaneous breathing was generated in ambient temperature and barometric pressure conditions with a mechanical test lung (Model 5600i Dual Test Lung, Michigan Instruments, Grand Rapids, Michigan), which included 2 independent artificial lungs. With a special lung coupling clip, one lung was used to drive the second lung to achieve spontaneous breathing simulation. The settings of the artificial lung were as follows: resistance: ±5 cm H2O/L/s and compliance of 0.06 L/cm H2O. The first lung was driven by a mechanical ventilator, Servo-i (Maquet, Getinge group, Getingue, Sweden), set to volume control mode (continuous flow without auto-flow, time pause, and an inspiratory rise time at 0%; PEEP of 0 cm H2O; the trigger was set at −10 cm H2O to avoid self-triggering). The O2 flow from a wall-mounted Thorpe Tube (0 to 15 L/min; Air Liquide RTM3, Technologie medicale, Noisy Le Sec, France) was delivered through an HME filter (dead space volume: 16 mL; Tracheolife I Filter HME Kendall-Covidien, 353U19004, Medtronic, Dublin, Ireland). The HME filter was directly fixed to a flow sensor. The flow sensor was directly connected to the entry of the lung port inlet of the second Dual Test Lung (Fig. 1). An O2 analyzer port was located on the top plate of the second artificial lung. The 3 parameters were modified as followed:
O2 flow: 2, 3, 4, 5, 6 L/min.
V̇E: 5, 10, 15, 20 L/min.
TI/Ttot: 0.33 and 0.50.

Study schematic.
Note: With these V̇E and TI/Ttot values, V̇I ranges from 10 to 60 L/min (Table 1).
Inspiratory flow value (L/min) as regard of Minute ventilation and TI/Ttot
Variables.
The main measured variable was FDO2 (expressed as the volumetric percentage of O2 in the steady-state dual test lung). FDO2 was measured with a Datex Ohmeda O2 Monitor (Model 5120, Louisville, Kentucky) calibrated with room air (21%), then at 30%, 35%, and 50%, with certified O2 gas (sensor type, galvanic fuel cell reference 0237–2034–700; accuracy, ±2% of full scale; response time, 9 s; measuring range, 0–100%). FDO2 was measured as the mean of 15 breaths after a stabilization period of at least 1 min.
O2 flow was measured continuously with a Thermal O2 Mass Flow Meter (Red Y Vögtlin Instruments, Switzerland, Aesch) (accuracy, ±1.5% of full scale; repeatability, ±0.1% of full scale). The V̇E and TI/Ttot were measured with a data acquisition system IX-214 (iWorx Systems, New Hampshire), which included an SP-304 (iWorx Systems, New Hampshire) flow sensor and a data-acquisition hardware connected to a Software Labscribe 3 (Iworx). The flow sensor was calibrated by using a 1-L calibration syringe (Hans Rudolph, Inc., Shawnee, Kansas) and ambient air. During this step, the gap between the required value and read value was a maximum of ±30 mL. All measurements were done in triplicate.
Part 2
The calculated FDO2 values were compared with the FDO2 values obtained through the following 2 previously validated formulas:
The Shapiro formula,4

The Vincent formula,5

Statistical Analysis
Data were analyzed by using the Sigma plot software (Version 12.0 Systat Software Inc., San Jose, California). The values are expressed as mean ± SD. The agreement between FDO2 calculated by the mathematical model and the FDO2 measured during the bench test measurements was expressed as proposed by Bland and Altman.20 As such, the bias and the limits of agreement were reported for each TI/Ttot (95% CI for the difference between measurements). An intraclass correlation coefficient was calculated to measure the relationship between FDO2 calculated and FDO2 measured for each TI/Ttot. To analyze the variability between the FDO2 calculated with our formula and the FDO2 measured, a coefficient of variation was calculated for each TI/Ttot. Finally, an agreement between FDO2 calculated by using the prediction formulas (Shapiro and Vincent), and the FDO2 measured during the bench test measurements was calculated.
Results
In this bench study, when the O2 flow and/or the TI/Ttot increased, the FDO2 increased. When the V̇E increased, the FDO2 decreased (Fig. 2).

Graphic values of the fraction of delivered O2 (FDO2) calculated (A, C) and the FDO2 measured (B, D) for O2 flow, ranging from 2 to 6 L/min, Minute ventilation from 5 to 20 L/min for the ratio of the inspiratory time (TI) to the total breathing cycle time (Ttot) (TI/Ttot) = 0.33 (A, B) and TI/Ttot = 0.50 (C, D), and between the FDO2 obtained with the Shapiro and Vincent formulas. Inspiratory flow (V̇I), ranging from 10–60 L/min.
Part 1
The results of the Bland-Altman method between FDO2 calculated by using our mathematical model and the FDO2 measured showed that the bias value was 1.49 ± 0.84%, and the limits of agreement ranged from −0.17% to 3.14% (Fig. 3). The intraclass correlation coefficient results were 0.991 for TI/Ttot = 0.33 and 0.994 for TI/Ttot = 0.50, and the coefficient of variations were 2.1% for TI/Ttot = 0.33 and 1.3% for TI/Ttot = 0 .50 (Fig. 3).
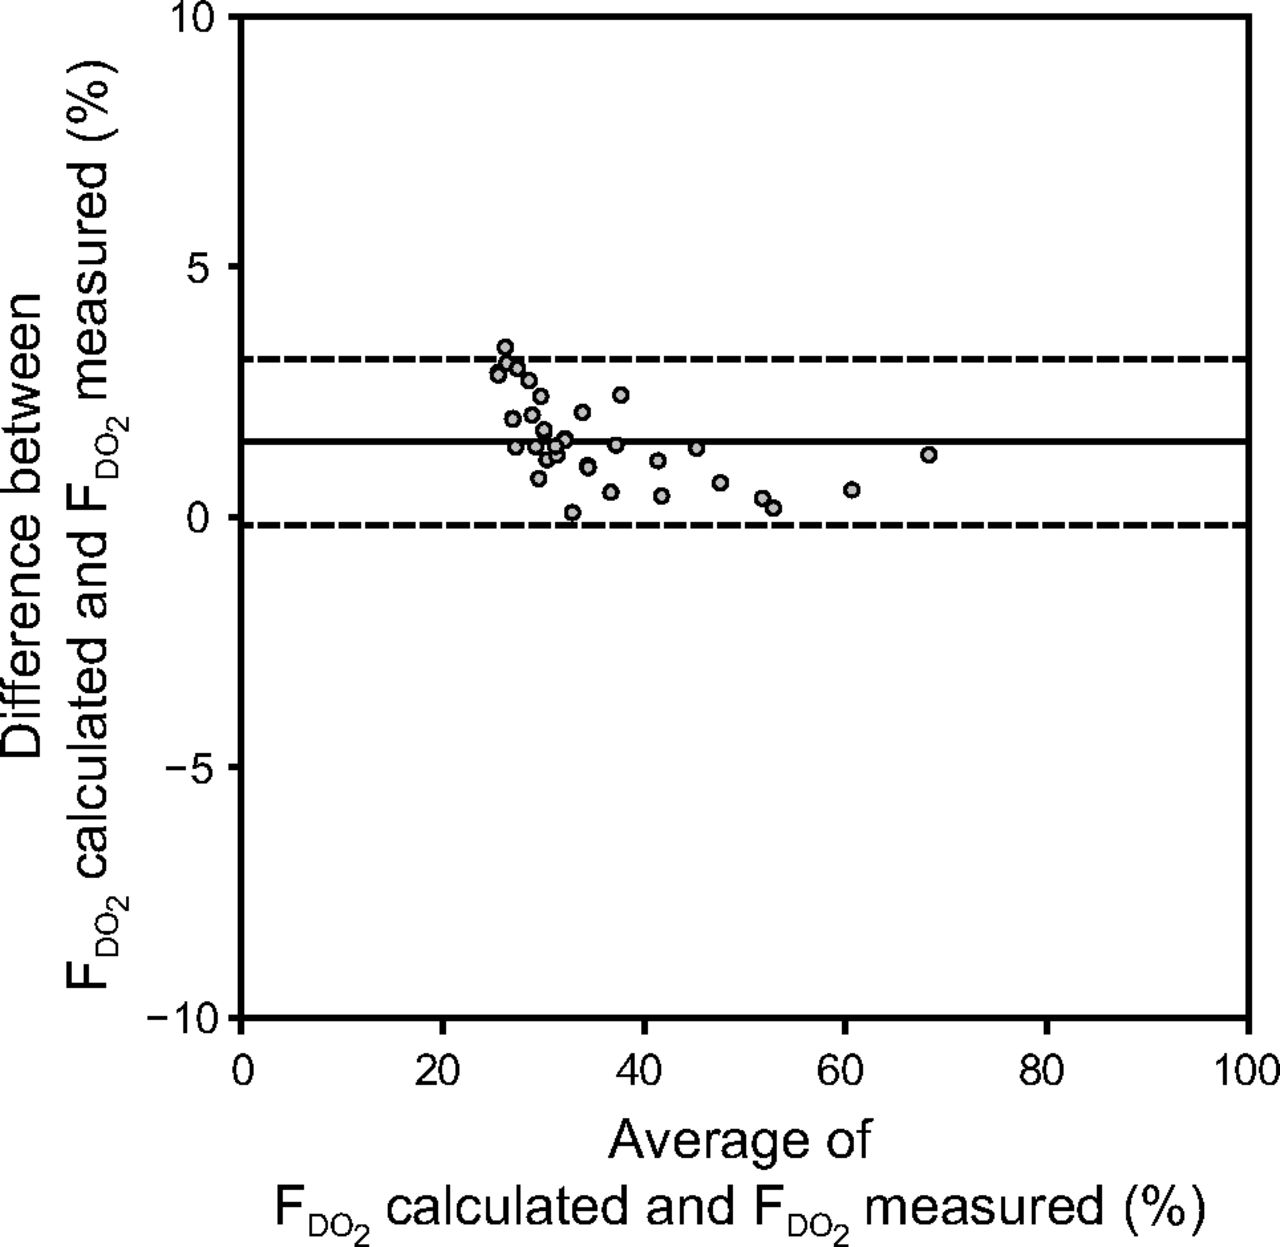
Bland-Altman graph comparing the fraction of delivered O2 (FDO2) calculated with our formula and the FDO2 measured on the bench for an O2 flow of 2–6 L/min, a minute ventilation that ranged from 5 to 20 L/min), and the ratio of the inspiratory time (TI) to the total breathing cycle time (Ttot) (TI/Ttot) of 0.33 (TI/Ttot value) and 0.50 (TI/Ttot value). Inspiratory flow (V̇I) that ranged from 10 to 60 L/min. The center line denotes mean, dashed lines show ±1.96 SD.
Part 2
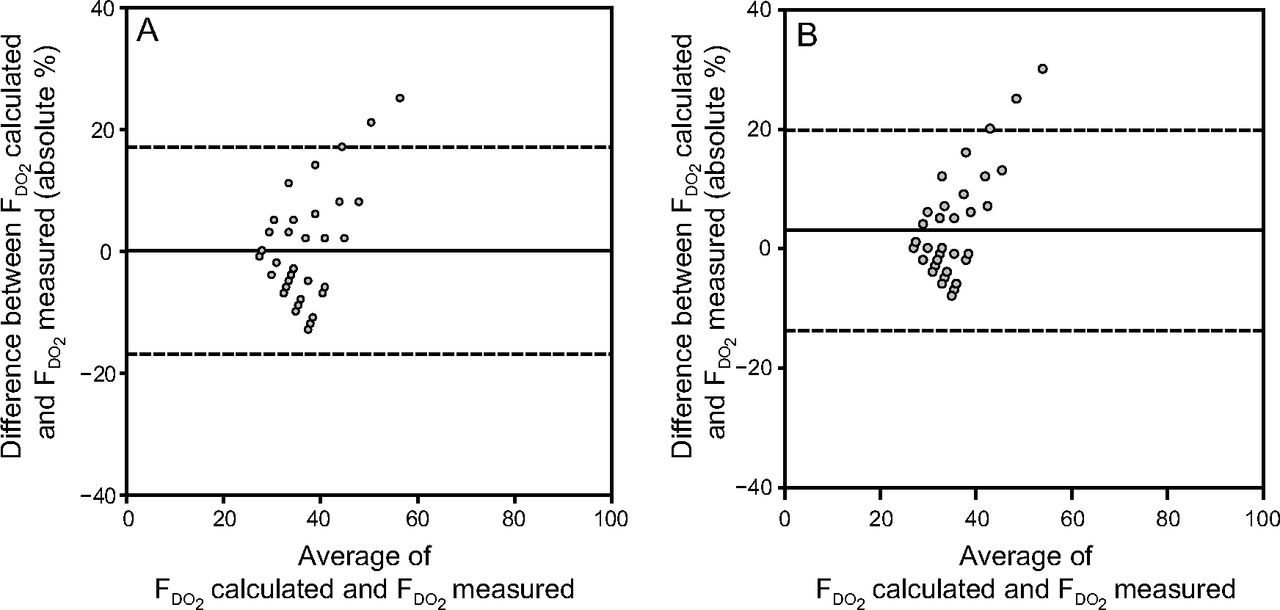
The results of the Bland-Altman method for the FDO2 calculated by the Shapiro formula and the FDO2 measured on the bench showed that the bias value was 0.075 ± 8.66%,4,20 and the limits of agreement ranged from −16.89% to 17.04%. For the Vincent formula, the bias value was 3.08 ± 8.56% and the limits of agreement ranged from −13.69% to 19.84% (Fig. 4).

Bland-Altman graph compares FDO2 calculated with the Shapiro formula and the FDO2 measured (A) and Vincent formula and the FDO2 measured (B) for an O2 flow that ranges from 2 to 6 L/min, minute ventilation that ranges from 5 to 20 L/min) and the ratio of the inspiratory time (TI) to the total breathing cycle time (Ttot) (TI/Ttot) of 0.33 and 0.50. Inspiratory flow (V̇I) range from 10 to 60 L/min.
Discussion
During O2 administration through an HME in patients with tracheostomy and who breathed spontaneously, slight absolute differences were found between the FDO2 calculated with our formula and the FDO2 measured on the bench. The bias (with its limits of agreement), the intraclass correlation coefficient, and the coefficient of variation were low between the FDO2 measured and the FDO2 calculated, which indicated the suitable validity of our prediction formula. However, when the FDO2 increased, this bias varied, in an inversely proportional manner, and was probably due to the turbulence during high O2 flow.21 Bias between the FDO2 calculated and the FDO2 measured of both prediction formulas (Shapiro and Vincent) were small and showed slight differences (bias for the Shapiro formula, 0.075 ± 8.66%; and for the Vincent formula, 3.08 ± 8.56%). However, the SD of these biases and the limits of agreement were wider compared with the values obtained with our formula.
According to our calculations, both prediction formulas were well suited for a healthy adult patient breathing at rest (V̇E = ±8 L/min and TI/Ttot = 0.33). This meant that these formula minute volumes were less suitable when the VE values differed from this threshold. Therefore, the Shapiro and the Vincent formulas should be used cautiously. Indeed, not considering these facts could lead to an over-or underestimation of oxygenation. The V̇I value is equal to the ratio between the minute volume and the TI/Ttot (V̇I = [f×Vt]/[TI/Ttot]). According to our formula, the FDO2 was roughly equal to the ratio between the O2 flow and V̇I. So, in adult patients, because the V̇I value was much higher than the O2 flow value, the impact of V̇I on FDO2 was higher. However, in small patients, it was the opposite: the O2 flow was higher than the V̇I. In this case, small variations of O2 flow will have a major impact on FDO2. According to our research, this variation appears in several studies.1,10,11,19,22 Thus, for instance, when taking into consideration two V̇E values, the gap between both FDO2 values increases when the O2 flow increases (Fig. 2). Consequently, during O2 therapy, if the ventilatory pattern was not constant, then the FDO2 would not be constant either. When the O2 flow is constant:
If the V̇I increases, then the FDO2 will decrease, for example, under conditions of stress, hyperthermia, agitation, metabolic acidosis, pain, or exercise (eg, COPD rehabilitation).1,23 Similar observations were found by Couser and Make12 with subjects oxygenated through a transtracheal catheter. These investigators observed that a decrease in V̇I increased PaO2.
If the V̇I decreases, then the FDO2 will increase. For example, under some sedative medications and/or instances of drug abuse, as well as in reassuring and relaxing atmospheres, or when patients are in a deep sleep and are receiving O2 by low flow.11,15,24
If the V̇I is small, then the FDO2 value will be high, even with low O2 flow (eg, during O2 therapy in preterm infants).
These situations should encourage us to be cautious when V̇I varies during oxygenation at low flow because this can lead to a risk of over or under oxygenation. Indeed, if hypoxemia (or hyperoxemia) is only due to ventilatory pattern variations, it is enough to modify the O2 flow to adjust the value of arterial pressure in O2. There are other considerations with regard to the dead space of the HME. Indeed, first, during spontaneous ventilation with HMEs, the mixture with expired air could affect the O2 fraction of inspired air. However, the dead-space value of these devices generally varies from 9 to 29 mL25 and was 16 mL in the HME used in our study.
Second, a tracheostomy tube reduces the upper-airway anatomic dead space by up to 150 mL, or 50%.26 In these cases, the CO2 contained in the anatomic dead space is lower than in normal physiologic ventilation. Therefore, the impact on the FDO2 decrease would be limited. Third, during oxygenation with an O2 administration device, during the expiratory phase, the continuous O2 flow washout reduces the dead space, which limits the impact of CO2 rebreathing.14 The clinical utility of knowing the formula is that it could be helpful for the therapist to be aware of the initial setup for O2 therapy for specific situations. For example, for small patients (or lower VE), low O2 flow can deliver high FIO2, for tall people (or high V̇I), high O2 flow delivers less FIO2 than with normal V̇I, and during high O2 flow in adults, any variation of V̇I will change the FIO2 drastically.
The aim of this bench study was to validate a new formula to predict FDO2 during oxygenation through an HME. The V̇E and the analyzed O2 flow ranged from 5 to 20 L/min (Table 1) and from 2 to 6 L/min, respectively. However, we draw attention to the risk of under humidification of inspired gas during high O2 flow through an HME in patients who are able to breathe spontaneously.25
Study Limitations
The present study had some limitations. In practice, use of our prediction formula was difficult because the exact patient V̇I value was unknown and O2 flow meters have a low accuracy.27–29 Moreover, in this study, the V̇I used was continuous (rectangular form). However, the human V̇I wave is not continuous (waveform). As such, determining the exact value of FDO2 is difficult in clinical situations. In addition, our model had limitations because it did not reproduce anatomic dead space. Also, the HME used was Tracheolife I, other systems exist with different dead spaces, which could affect results.
Conclusions
During supplemental oxygenation at low flow in a model of spontaneous breathing with an artificial airway, the FDO2 was influenced by the O2 flow and the V̇I. According to our observations, the V̇I had a substantial impact on the FDO2 and, therefore, could lead to over or under oxygenation without careful monitoring. FDO2 comparisons between the prediction formulas typically used by clinicians and FDO2 measured on the bench had larger differences. Caution should be exercised when using these formulas for predicting FDO2. Indeed, during the calculation of the PaO2/FIO2 with the Shapiro or Vincent formulas, there was a high risk of overestimating the FIO2, especially if the patient's inspiratory rate was high. This paper proposed a new prediction formula that takes into account O2 flow and V̇I values. Our prediction formula showed good accuracy when predicting FDO2 during supplemental oxygenation at low flow through an HME.
Acknowledgments
The authors thank Céline Bugli [Support en Méthodologie et Calcul Statistique (SMCS), Université Catholique de Louvain, Belgium] for her assistance during the statistical analysis phase.
Footnotes
- Correspondence: Frédéric Duprez MSc PT, Hôpital Epicura, 63 rue de Mons, 7301 Hornu, Belgium. E-mail: frederic.duprez{at}epicura.be.
The authors have disclosed no conflicts of interest.
Supplementary material related to this paper is available at http://www.rcjournal.com.
- Copyright © 2018 by Daedalus Enterprises


