

Abstract
BACKGROUND: Portable oxygen concentrators (POCs) deliver oxygen in intermittent pulses. The challenge of establishing equivalence between continuous flow oxygen and nominal pulse flow settings on different POCs is well known. In vitro bench measurements and in silico mathematical modeling were used to compare the performance of 4 POCs versus continuous flow oxygen by predicting the FIO2 at the trachea and entering the acini.
METHODS: Each of the 4 POCs was connected to a 3-dimensional printed replica of a human adult nasal airway via nasal cannula. A test lung simulated 3 breathing patterns representative of a patient with COPD at rest, during exercise, and while asleep. POCs were tested for each breathing pattern at all integer pulse flow settings. Volume-averaged FIO2 was calculated by analyzing oxygen concentrations and inhalation flow over time. In vitro oxygen waveforms were then combined with a single-path mathematical model of the lungs to assess oxygen transport through the conducting airways. In vitro experiments and mathematical modeling were repeated for continuous flow oxygen.
RESULTS: Continuous flow oxygen consistently delivered more (>2% absolute) oxygen in terms of volume-averaged FIO2 for all nominally equivalent pulse flow settings of >2. Differences were also observed when comparing performances between different POCs, particularly at high device settings (5 and 6). Simulations showed that efficiency of delivery to the acinar region of the lungs was higher in pulse flow than in continuous flow oxygen but that continuous flow oxygen generally delivered a higher absolute volume of oxygen. Differences in absolute oxygen delivery per breath between continuous flow oxygen and pulse flow were smaller for acinar delivery than for tracheal delivery.
CONCLUSIONS: Significant differences in POC performance based on volume-averaged FIO2 were found between pulse flow and continuous flow oxygen, and among pulse flow modes in different POCs. Although pulse flow was a more efficient mode of delivery than continuous flow oxygen, continuous flow oxygen delivered a greater absolute volume of oxygen per breath.
- long-term oxygen therapy (LTOT)
- ambulatory oxygen
- portable oxygen concentrator (POC)
- lung simulator
- nasal cannula
- chronic obstructive pulmonary disease
- oxygen therapy
- lung model
- trumpet model
- pulse
Introduction
Long-term oxygen therapy has been shown to prolong life in patients with COPD and severe daytime hypoxemia.1,2 Oxygen has historically been provided as a continuous flow supplied to the patient interface, but, more recently, intermittent delivery methods triggered by a patient's breathing have been developed as portable or cost-saving alternatives.3–5 Portable oxygen concentrators (POCs) are the latest class of devices in the intermittent delivery paradigm.3,6 Because these devices concentrate existing atmospheric oxygen, they do not require a stationary oxygen source and provide a portable option for supplemental oxygen therapy. Although some POCs can deliver oxygen continuously at limited flows, many recent-generation devices deliver oxygen exclusively by using pulse flow, in which a short-duration flow, or pulse, of oxygen is provided only when patient inspiration is detected.7 A recent study showed that subjects with COPD who required long-term oxygen therapy generally preferred a single-source POC instead of a combined stationary and portable oxygen source, citing the practicality of the system as its main advantage.8 However, the same study showed that insufficient oxygenation (SpO2 < 90%) was more frequent among users of single-source POC.
The challenge of establishing equivalence between continuous flow oxygen and nominal pulse flow device settings on different devices is well known5,9 and provides motivation for the development of physiologically representative in vitro testing methods. Chen et al10 recently outlined a methodology to compare pulse flow oxygen delivery from a commercially available POC with continuous flow oxygen delivery from a stationary cylinder by using a set of 15 realistic airway replicas. Use of these replicas, together with a lung simulator in in vitro experiments allowed for precise control of simulated breathing parameters in anatomically representative models of the upper airways and made it possible to account for potential intersubject variability due to variance in airway geometries as well as allowing modes of failure to be assessed when a POC failed to detect an inspiratory effort.
By measuring the real-time oxygen concentration at the airway replica outlet (representative of the trachea) during inspiration, a volume-averaged FIO2 was obtained that represented the fraction of oxygen contained in a given inhaled tidal volume (VT).10 In other words, these volume-averaged FIO2 values represent the ratios between the total volume of inhaled oxygen (including both supplemental oxygen and oxygen in the entrained air) and the inhaled VT, and provide a common basis for comparison between pulse flow and continuous flow oxygen.10
In building on this recent work, the present study had 2 primary objectives. The first was to compare the performance of several POCs against each other and against continuous flow oxygen by using volume-averaged FIO2 at the trachea as a measure of oxygen delivery. The second objective was to characterize the transport of oxygen pulses from the trachea through the conducting airways via mathematical modeling. This enabled the assessment of the impact of continuous flow oxygen flows, pulse flow settings, and breathing parameters on transport of oxygen through the conducting airways to the gas-exchange region of the lung.
QUICK LOOK
Current knowledge
Long-term oxygen therapy prolongs life in patients with COPD and severe daytime hypoxemia. Portable oxygen concentrators (POCs) that deliver pulsed oxygen intermittently are purported to be more oxygen-efficient than continuous flow oxygen. Performance differences between pulse flow and continuous flow oxygen and among different POCs operated at the same numerical setting have been reported.
What this paper contributes to our knowledge
FIO2 at the trachea, assessed in vitro in a benchtop model that incorporated a realistic upper airway replica and simulated breathing, was higher for continuous flow oxygen compared with pulse flow at nominally equivalent flows and/or POC numerical settings. Differences in FIO2 were also observed among the different POCs operated at the same numerical setting. When the in vitro data were combined with in silico modeling, it was predicted that pulse flow, compared with continuous flow oxygen, delivers oxygen more efficiently to the acinar region of the lung. However, for the POCs evaluated, the absolute volume of oxygen delivered to the acini per breath was predicted to be greater for continuous flow oxygen than for pulse flow across the majority of cases studied.
Methodology
Selection of a Representative Airway Replica
In Chen et al,10 testing was limited to a single POC evaluated at 2 integer pulse settings, one high (6) and one low (2). It was found that intersubject variability among 15 airway geometries had only a small (<5% coefficient of variation) impact on volume-averaged FIO2 values.10 Therefore, it was deemed reasonable to use only a single representative replica for comparative testing in the present work. A single replica was selected on the criterion that the volume-averaged FIO2 value obtained by using this replica (for either continuous flow oxygen or pulse flow) was closest to the average value obtained across the set of 15 replicas. Volume-averaged FIO2 values obtained for the selected airway replica (Subject MRI2) are compared in Figure 1, with average and standard variation of values obtained across all replicas. The selected replica had a total interior volume of 44.6 mL and an interior surface area of 287 cm2. These values were obtained by using MeshLab (Visual Computing Laboratory, Istituto di Scienza e Tecnologie dell'Informazione, Pisa, Italy) and ParaView (Kitware, Clifton Park, New York).
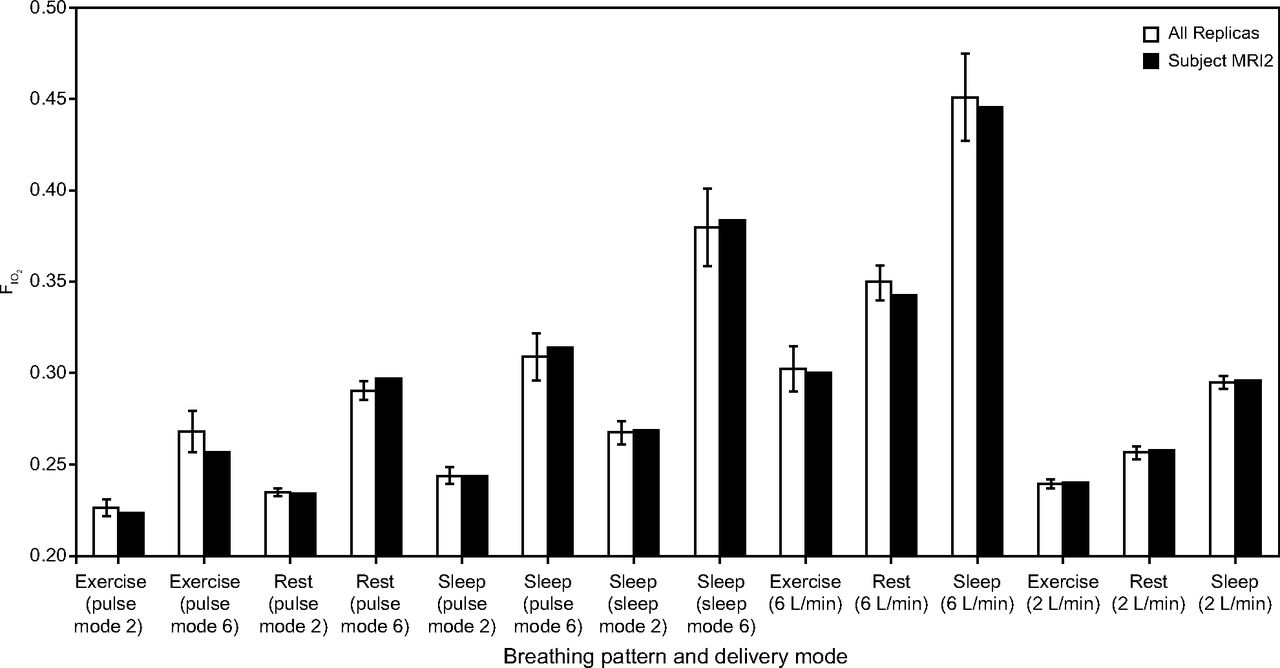
Comparison of volume-averaged FIO2 by using Subject MRI2, with a mean volume-averaged FIO2 across 15 airway replicas. Data for both pulse deliveries from a SimplyGo portable oxygen concentrator and continuous flow oxygen from a stationary source of compressed oxygen are included. Error bars indicate ±1 SD.
Airway Experiments
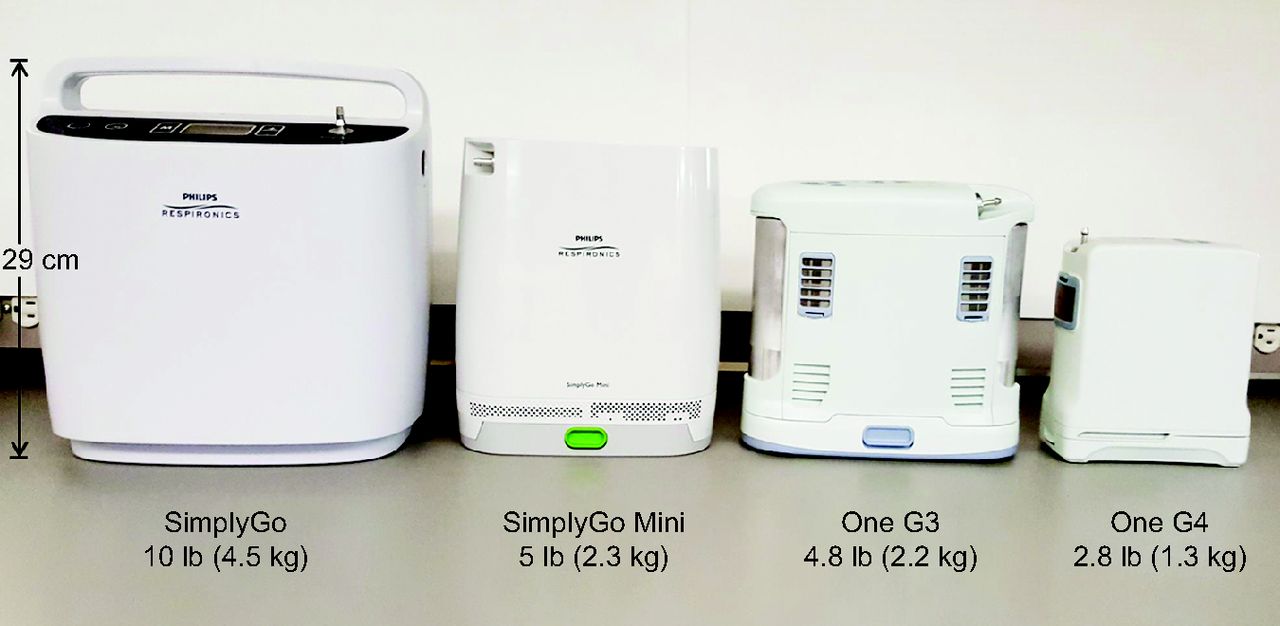
Experiments were performed by using the experimental apparatus described in Chen et al.10 The test set of POCs consisted of a SimplyGo (Philips Respironics, Murrysville, Pennsylvania), a SimplyGo Mini (Philips Respironics, Murrysville, Pennsylvania), a One G3 (Inogen, Goleta, California), and a One G4 (Inogen, Goleta, California). A photograph of the tested POCs, the weight of each device, and a visual comparison of device sizes are shown in Figure 2. Specifications for each device are shown in Table 1. To account for the variety of use conditions that a patient with COPD may experience in his or her everyday life and to explore the effect of varying breathing frequencies and VT on POC performance and FIO2, 3 different breathing patterns were chosen, representative of a patient with COPD at rest, while asleep, and during light exercise.

Commercial portable oxygen concentrators tested in this study.
Specifications for Portable Oxygen Concentrators Used in This study
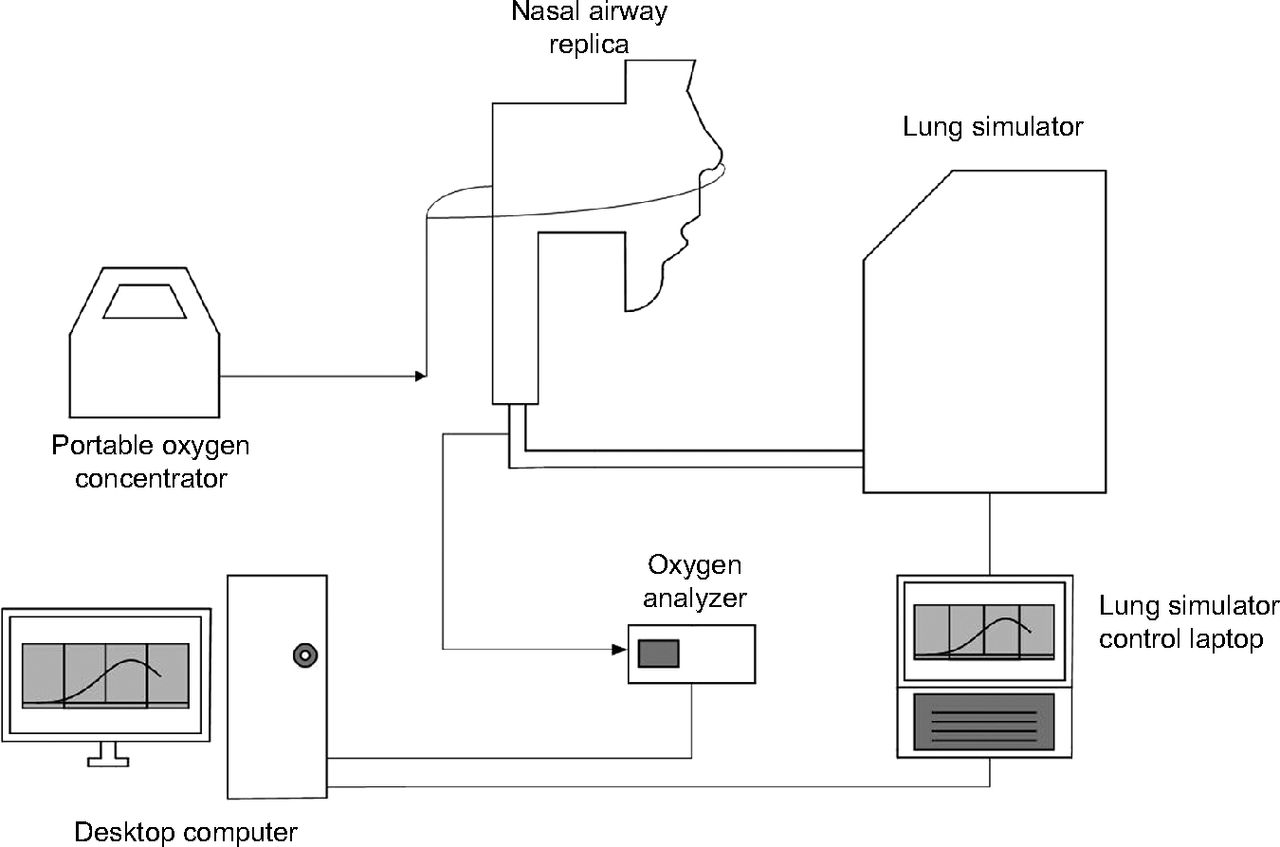
The inspiration and expiration flow waveforms were each modeled by using a half-sinusoid and actuated by using a lung simulator (ASL 5000 Breathing Simulator, IngMar Medical, Pittsburgh, Pennsylvania). A schematic of the experimental apparatus is shown in Figure 3. Breathing parameters for each of these patterns (at rest, while asleep, and during light exercise) are provided in Table 2. The rest and exercise breathing parameters were chosen based on average values reported previously by Chatila et al11 for 10 subjects with COPD at baseline (rest) and while on continuous flow oxygen (2.5–6 L/min) while performing light exercise on a cycle ergometer. Parameters for the sleep breathing pattern were chosen based on average values measured by Hudgel et al12 for 13 subjects with COPD while asleep.

Schematic of apparatus used in experiments that involve airway replicas. Arrows indicate direction of oxygen flow. From Reference 10, with permission.
Breathing Parameters of Representative Breathing Profiles for Patients With COPD at Rest, Doing Light Exercise, and While Asleep
Calculation of Volume-Averaged Tracheal FIO2
Example flow and oxygen fraction waveforms are shown in Figure 4. The flow of oxygen passing through the trachea over time was calculated by multiplying inspiration flow with measured oxygen concentrations at the same point in time. The beginning and the end of inspiration were identified as times when oxygen flow crossed 0 mL/s. These oxygen flows were then numerically integrated via the trapezoidal rule from the start to the end of inspiration to determine a volume of oxygen inspired for that breath. Finally, volume-averaged FIO2 was obtained by dividing the inspired volume of oxygen by VT. FIO2 for each combination of device, device setting, and breathing pattern was taken as the average of 5 consecutive breaths after a steady state in the end-expiratory oxygen concentration was observed. The variability among FIO2 values obtained in experiments repeated on separate days was found in preliminary testing to be of similar magnitude as variability between individual breaths. One-way analysis of variance was performed to compare the differences in volume-averaged tracheal FIO2 by analyzing the simple main effects of device setting–continuous flow oxygen flow and mode of delivery (4 POCs and continuous flow oxygen). Multiple post hoc comparisons were then done by using the Tukey test, with P < .05 considered significant.

Sample flow and oxygen fraction waveforms generated by the experimental apparatus for pulsed delivery of oxygen. From Reference 10, with permission.
Measurement of Pulse Characteristics
An O2 Conserver Testing System (1,130 series, Hans Rudolph, Shawnee, Kansas) was used to obtain oxygen pulse volumes, durations, and delays for each setting and each POC. POCs were connected to the testing system by using standard oxygen tubing. Data were recorded as the average of 20 successive pulses for each breathing pattern–setting combination. Average pulse characteristics were calculated only from breaths when the device was properly triggered.
Prediction of Pulse Flow Volume-Averaged FIO2
Chen et al10 previously published an algebraic model that predicts in vitro volume-averaged FIO2 in realistic airway replicas based on pulse characteristics. The model uses airway replica internal volume, measured pulse volumes, ambient oxygen concentration, and pulse oxygen concentration to first calculate an internal oxygen concentration in the chamber of the test lung or, equivalently, the amount of oxygen passing the entrance to the chamber of the test lung:
 (1) where XO2, c is the test lung chamber oxygen fraction, XO2, ambient is the fraction of oxygen in ambient air, Vpulse is the volume of the oxygen pulse, VT is the tidal volume, VAW is the total volume of the airways (both upper and lower respiratory tracts), and XO2, pulse is the oxygen fraction (0.94 for the Philips devices, 0.95 for the Inogen devices) of the pulse.
In vitro volume-averaged FIO2 is then predicted by using the following equation:
 (2)
(2)
Mathematical Modeling of Oxygen Transport Through the Conducting Airways
Oxygen flowing past the trachea enters the conducting airways and may eventually be transported to alveolar regions of the lung where gas exchange occurs. To describe the transport of the oxygen pulse through the conducting airways to the acini, a modified version of a mathematical model previously described by Martin et al13 for assessing nitric oxide transport and uptake was used. The model, written in MATLAB (Mathworks, Natick, Massachusetts), assumes a simplified single-path, single-alveolar compartment lung structure, with no oxygen exchange occurring in the conducting airways.
By using oxygen concentration waveforms measured at the trachea over time from the in vitro measurements described above as a boundary condition, the present model simulated the transport of oxygen to the acini by a combination of bulk convection and axial dispersion through the conducting tracheobronchial airways, which were modeled as a series of branching tubes whose dimensions become smaller with each branching generation. The mathematical model assumed these tubes to be rigid, cylindrical, and bifurcating between each airway generation. Baseline dimensions were taken from an adult airway model provided by Finlay et al14 based on airway data from Phillips et al15 for an adult with a functional residual capacity of 3000 mL (Table 3). Additional details that pertain to the mathematical model are described in the supplementary material (see the supplementary materials at http://www.rcjournal.com).
Cylindrical Airway Dimensions of Tracheobronchial Airways at Each Generation in the Lung Model
Inputs to the model consisted of the following:
Comma-separated value (.csv) versions of individual oxygen concentration waveforms over the course of inhalation (one per breathing pattern–device setting combination), which were extracted manually from raw oxygen concentration data.
Simulation breathing parameters, including VT, breathing frequency and the ratio of inhalation to exhalation time. Values of inhalation to exhalation ratio were 0.515 for the exercise breathing pattern, 0.538 for the rest breathing pattern, and 0.613 for the sleep breathing pattern. These were used to generate the same idealized breathing patterns as those used in the in vitro experiments.
Pre-inhalation oxygen concentration in the conducting airways. Because the present analysis considered only the transport of oxygen through conducting airways during a single inhalation and not uptake of oxygen to the blood, the oxygen concentration throughout the conducting airways was set to zero at the beginning of each simulation. Under this condition, only the transport of oxygen freshly inhaled through the upper airway was considered.
Outputs of the model included time-varying oxygen concentrations at individual airway generations distal to the trachea, the total volume of oxygen delivered to the acini, and the ratio between the oxygen volume delivered to the acini and that delivered to the trachea, which represented acinar delivery efficiency. Because the initial concentration of oxygen in the conducting airways was set to zero at the start of inhalation, the acinar delivery efficiency can be viewed as the fraction of oxygen passing the trachea that also passes into the acini during an inhalation. Based on preliminary simulations, the coefficient of variation in delivered oxygen volume between simulations performed for different individual breaths ranged from approximately 0.1 to 4% of the mean. Therefore, it was sufficient to use only a single breath from each breathing pattern-device–pulse setting combination in the model calculations.
Results
Comparisons of POC Performance
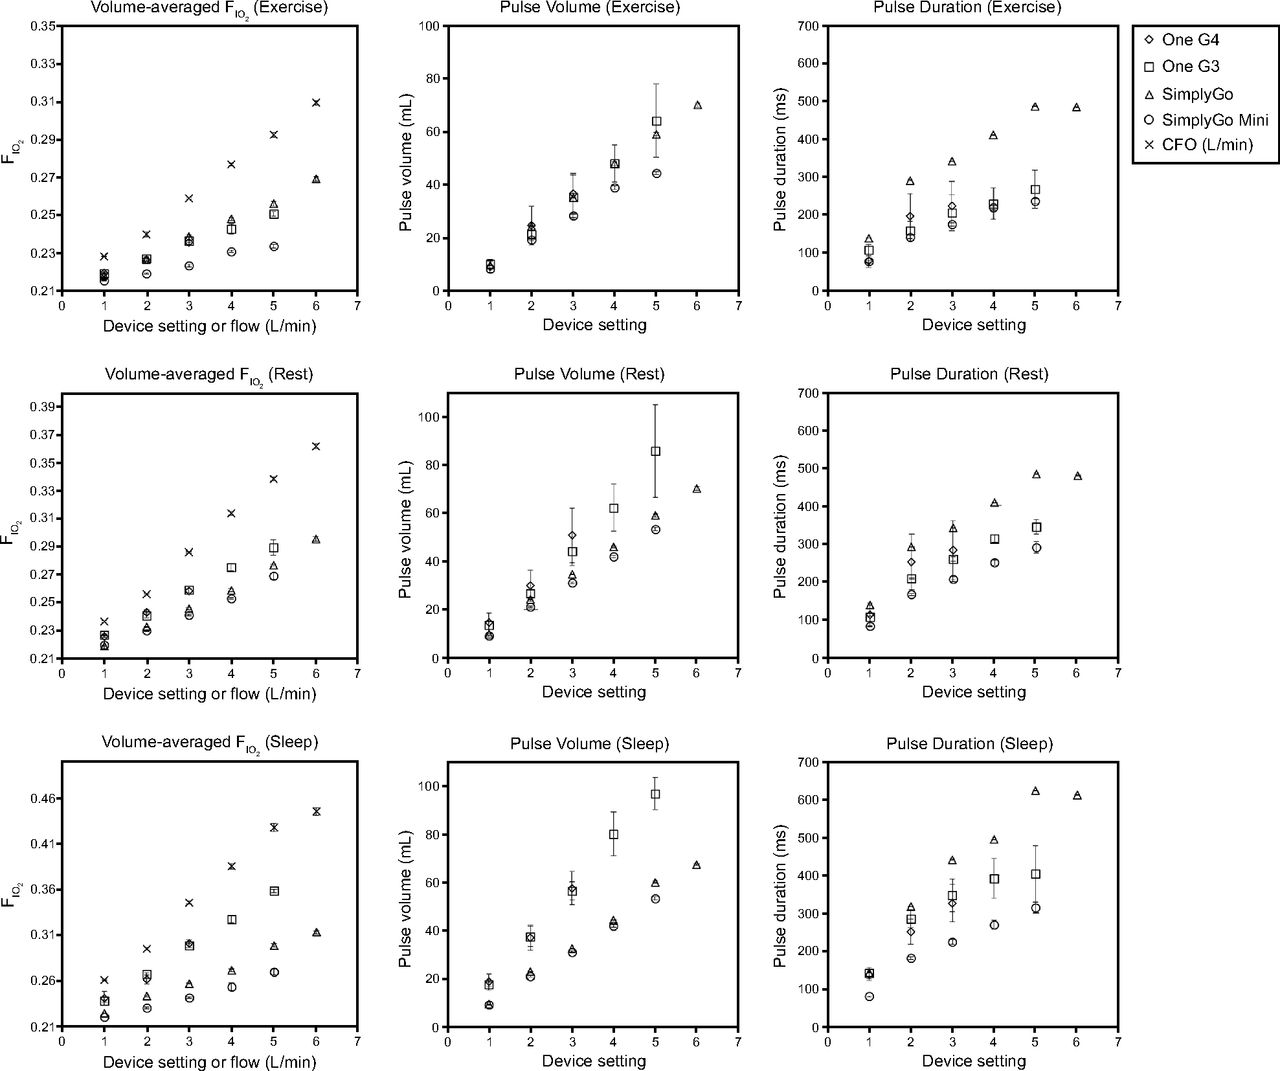
The comparisons of volume-averaged FIO2, pulse volume, and pulse duration for continuous flow oxygen from a compressed oxygen source versus pulse flow from each of the POCs are shown in Figure 5. The differences between each device, by showing pulse flow profiles over time at pulse setting 2 for each of the POCs, are illustrated in Figure 6.

Volume-averaged FIO2 and pulse characteristics for each of the tested portable oxygen concentrators and continuous flow oxygen across 3 breathing patterns. FIO2 values were averaged over 5 consecutive breaths. Other pulse characteristics averaged >20 consecutive breaths. Error bars indicate ±1 SD.

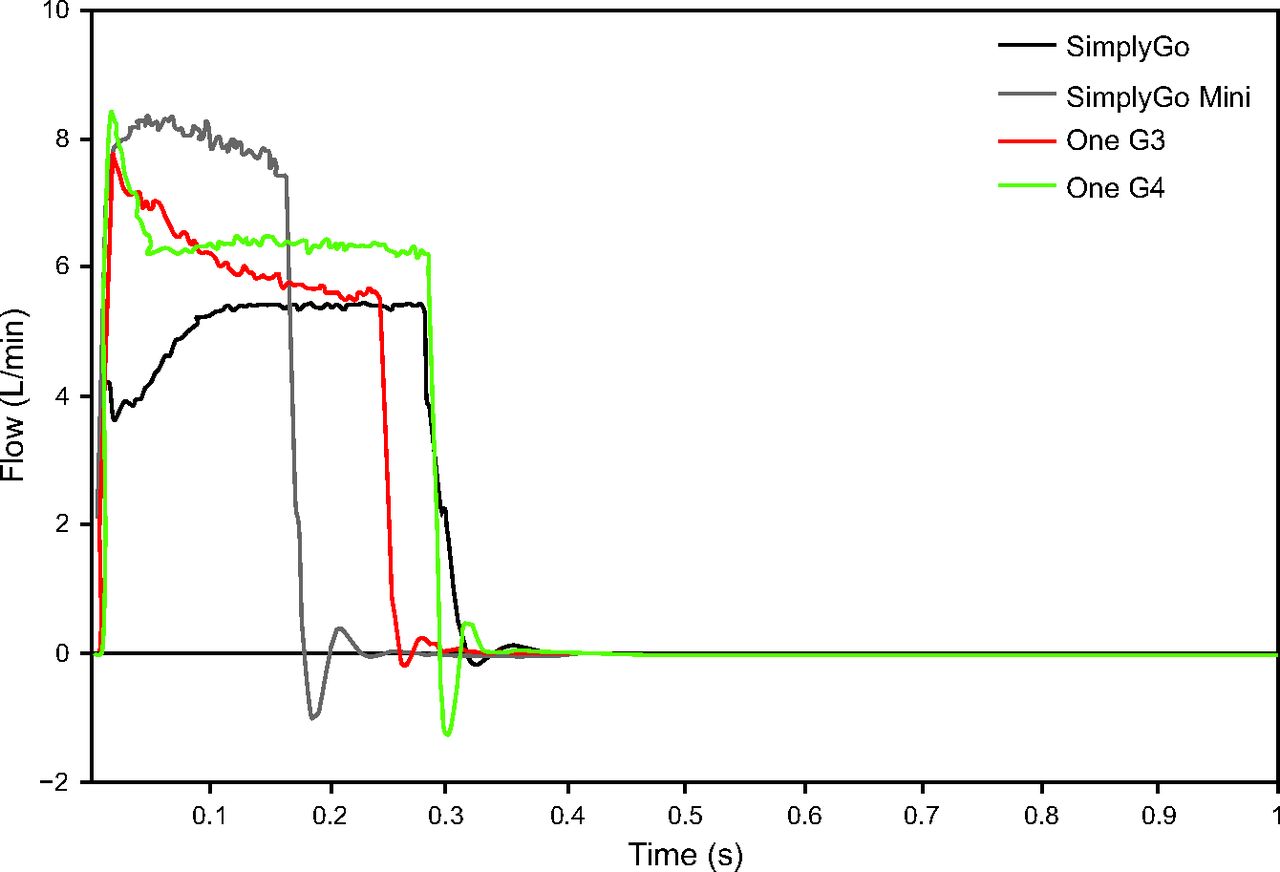
Pulse flow curves generated by the O2 Conserver Testing System for each portable oxygen concentrators (POC) at setting 2 for each device and breathing frequency of 17 breaths/min.
Statistical analysis showed that, when the mode of delivery was held constant, there were statistically significant differences (P < .001 in every case) among all device settings–continuous flow oxygen flows for each mode of delivery in all the breathing patterns. With device setting–continuous flow oxygen held constant, several homogeneous subgroups (groups of delivery modes with statistically similar performance) emerged under post hoc analysis, which are listed in Table 4.
Subgroups With Statistically Similar Volume-Averaged Tracheal FIO2 (P > .05) Segregated by Device Setting, CFO, and Breathing Pattern
Due to the high repeatability of the in vitro test methods used in some cases, very small differences in FIO2 were statistically significant. Therefore, in addition to statistical significance, a threshold for a practical or anticipated clinically important difference in FIO2 was defined to be > 2% (absolute percentage oxygen) when following Zhou and Chatburn.16 By using this more-demanding threshold, continuous flow oxygen still delivered a significantly higher FIO2 than pulse flow in at least one of the devices at all nominally equivalent device settings of ≥2. The magnitude of this difference decreased as minute volume (which in our model included an increase in both VT and breathing frequency) increased.
For the 2 Philips devices, the SimplyGo consistently delivered more oxygen than the SimplyGo Mini, although FIO2 values were within 2% (absolute) for the majority of breathing pattern–setting number combinations, with the exception of setting 5 in the sleep and exercise breathing patterns. For the Inogen devices, no anticipated clinically important FIO2 difference was observed among the devices when operated at the same device setting for any of the 3 breathing patterns. Although the Inogen devices delivered similar FIO2 as the SimplyGo for the exercise breathing pattern, FIO2 was greater for the Inogen devices than for the SimplyGo devices for the rest and sleep breathing patterns.
Prediction of Volume-Averaged Tracheal FIO2 When Using Measured Pulse Characteristics
At a given nominal device setting, different POCs provided different oxygen volumes per breath (Fig. 5). For a given POC, pulse volume increased approximately linearly with the device setting number across each breathing pattern. In general, increasing pulse volumes were correlated with increasing values of volume-averaged FIO2. The longest pulse durations were observed in the SimplyGo, whereas the shortest pulse durations were observed in the SimplyGo Mini (Fig. 5). At the frequencies considered (13 to 22 breaths/min), pulse durations correlated positively with the setting number but correlated negatively with breathing frequency.
A comparison of volume-averaged tracheal FIO2 derived from airway experiments with those calculated from pulse characteristics when using Equation 2 are shown in Figure 7. For the sleep breathing pattern, there were no anticipated clinically important differences between the 2 sets of FIO2 predictions (ie, absolute difference of <2%) for any of the device settings in any of the devices. For the rest and exercise cases, only setting 5 of the One G3 resulted in a significant difference between the airway experiment FIO2 and pulse characteristics–derived FIO2. More generally, increasing the minute volume resulted in a higher absolute difference between the 2 FIO2 sets, although most of these differences did not meet the threshold for anticipated clinical importance.
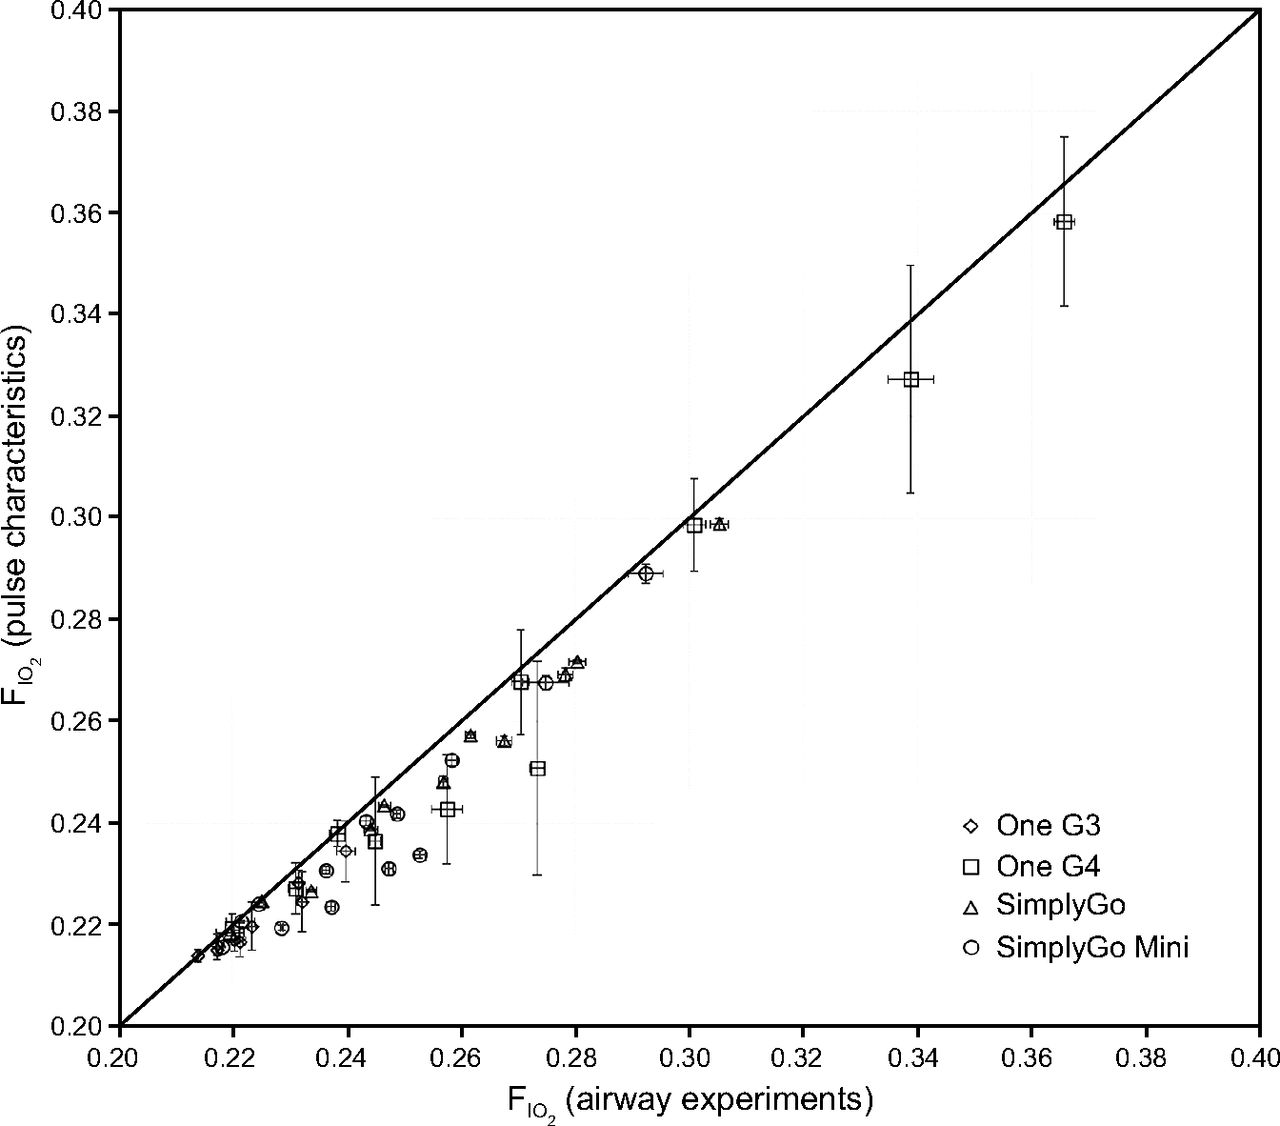
Comparisons of volume-averaged FIO2 measured in airway experiments with volume-averaged FIO2 predicted by using pulse characteristics. Vertical error bars indicate ±1 SD of FIO2 determined from airway experiments over 5 consecutive breaths. Horizontal error bars indicate ±1 SD of FIO2, determined by using pulse characteristics over 20 consecutive breaths. Identity line shown for comparison.
Mathematical Modeling
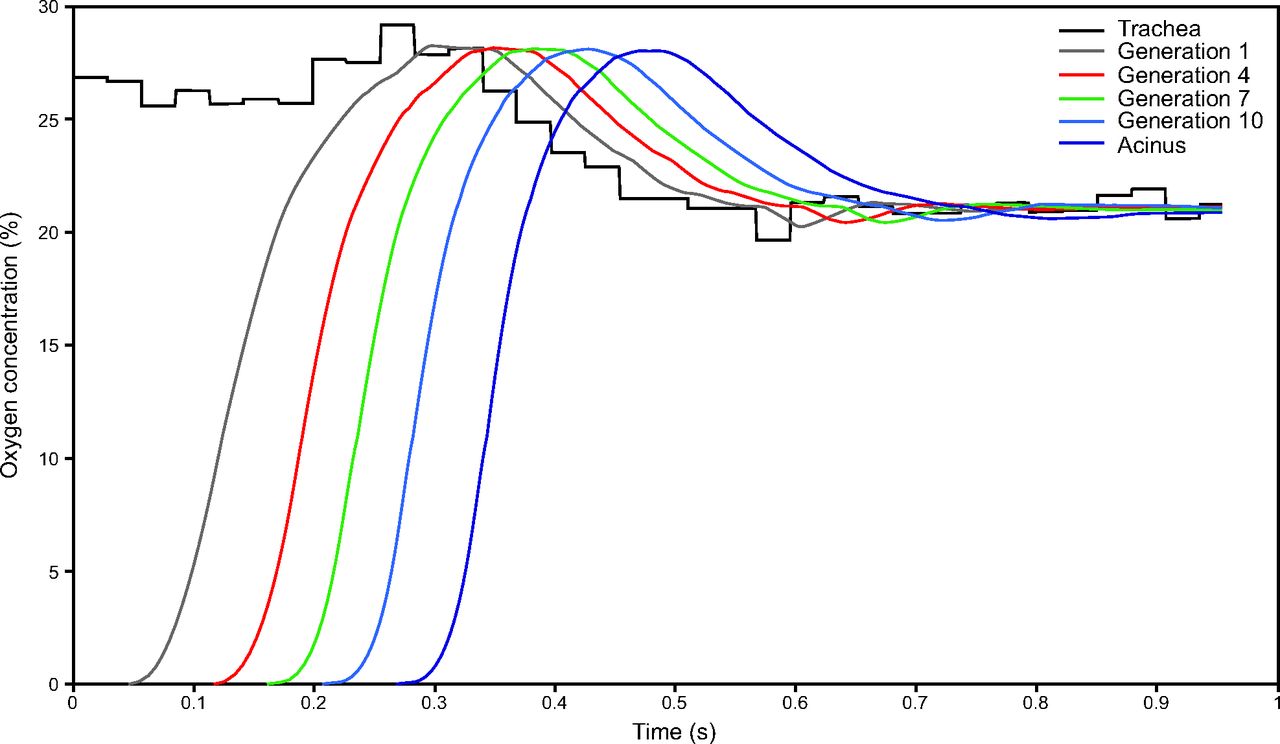
A sample output of the mathematical model for oxygen transport in the lower airways is shown in Figure 8. The “trachea” curve is an oxygen waveform as measured in the in vitro airway replica experiments. Each subsequent curve shows the oxygen fraction waveform that varies in time as it is transported through the airways up to the terminal bronchioles (generation 14) that mark the boundary with the acini. Simulation results, which show the volume of oxygen delivered to the trachea, the volume of oxygen transported to the acini, and the ratio of acinar to tracheal volume of oxygen delivered (ie, the acinar oxygen delivery efficiency) are summarized in Figure 9.

Sample output of MATLAB simulation (SimplyGo Mini, exercise breathing pattern, device setting 5). The trachea line represents oxygen concentration passing the trachea over time determined by the in vitro experiments. Oxygen passing generation 14 enters the gas exchange regions of the lung.
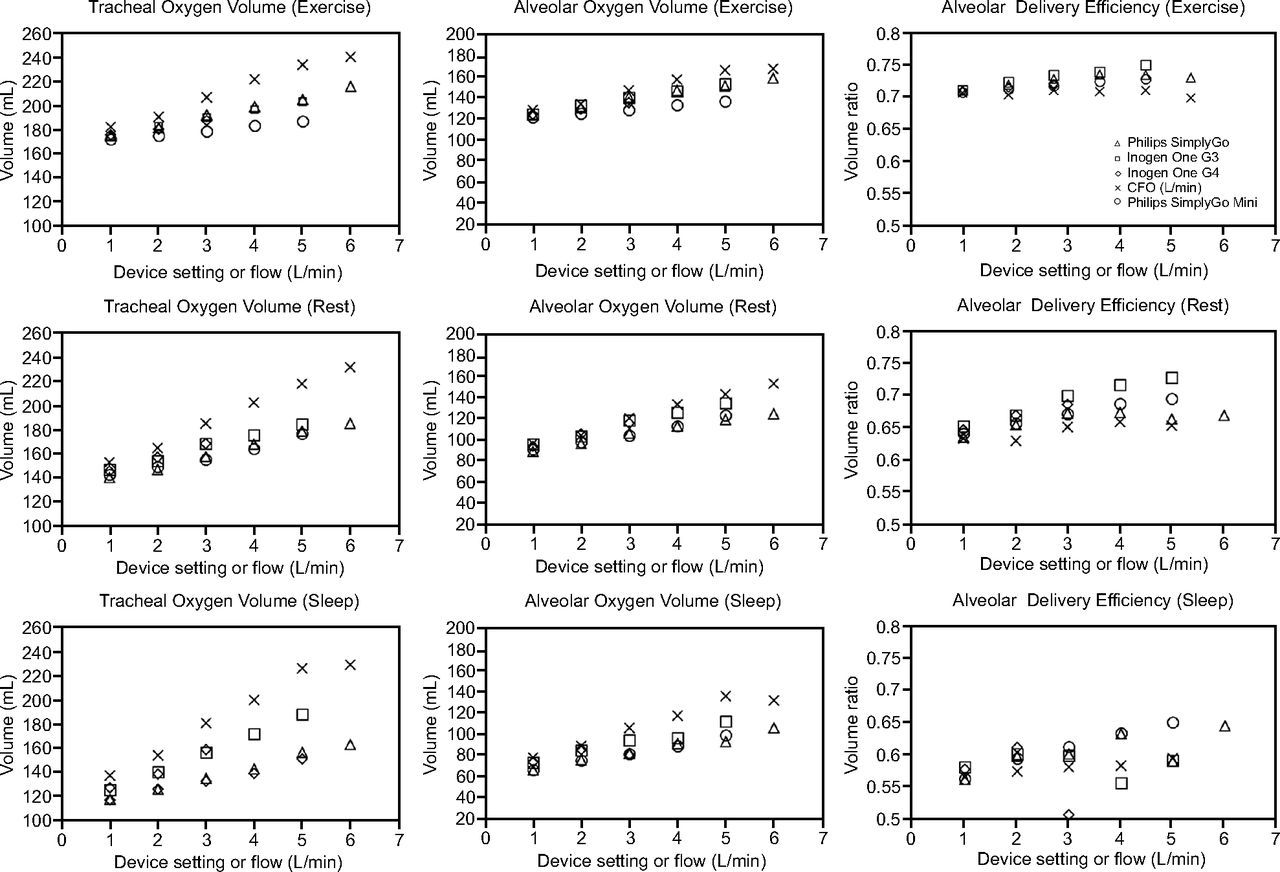
Volumes of oxygen passing through the trachea, passing into the alveolar region, and the ratio of these 2 numbers (ie, a measure of the fraction of the oxygen passing the trachea that reaches the alveolar region) for all tested portable oxygen concentrators and continuous flow oxygen.
Generally, acinar oxygen delivery efficiencies were positively correlated with increasing minute volume. Although all of the devices showed an increase in efficiency with increasing device setting in the exercise and rest cases, for the sleep case, the SimplyGo Mini was the only device in which this trend persisted. Efficiencies for pulse flow were generally higher than those for continuous flow oxygen. However, absolute oxygen delivery to the gas exchange region remained lower for pulse flow than for continuous flow oxygen at nominally equivalent settings and flows (Fig. 9). Differences in oxygen delivery between continuous flow oxygen and pulse flow were smaller at the acinar region than at the trachea. On average, lower minute volumes resulted in higher differences in delivered oxygen volume.
Discussion
In this study, we compared the performance of pulse flow oxygen delivery from POCs to continuous flow oxygen delivery from a stationary cylinder source. Overall, the results corroborated conclusions from previous studies16–18 in that there was no general equivalence in oxygen delivery between continuous flow oxygen in L/min and any of the nominally equivalent pulse flow settings for the POCs that we tested. At most numerical pulse settings, volume-averaged tracheal FIO2 was significantly lower, in both a statistical and an anticipated clinical sense, for pulsed delivery than for a nominally equivalent continuous flow oxygen flow (Fig. 5). Statistically, differences in FIO2 among the 4 POCs studied occurred more frequently at higher device settings (Table 4), which indicated that differences in performance among the devices become more pronounced as oxygen delivery increases. This is corroborated by the fact that anticipated clinically important differences in FIO2 also tended to occur more frequently at higher device settings–continuous flow oxygen flows.
Large differences in pulse volumes among POCs at the same numerical device setting tended to result in large differences in volume-averaged FIO2. It was observed that the Inogen devices modulated pulse volumes based on breathing frequency to maintain relatively similar volumes of oxygen delivered per minute, whereas the SimplyGo and SimplyGo Mini maintained relatively constant pulse volumes for the range of frequencies considered in this study. This resulted in differences in volume-averaged FIO2 between, for example, the One G3 and the SimplyGo. The magnitudes of the differences in volume-averaged FIO2 between the One G3 and the SimplyGo are primarily the result of 2 factors: (1) slower breathing, which causes the One G3 to increase its per-breath output, and (2) shallow breathing, which causes supplemental oxygen to represent a higher fraction of the total inhaled oxygen. Because slow breathing is also associated with shallow breathing in this study, these 2 effects acted synergistically to generate large FIO2 differences for the sleep breathing pattern (Fig. 5). Conversely, for deep, fast breathing (exercise), the FIO2 difference is essentially nonexistent.
Variation in measured tracheal FIO2 among POCs at a given setting could largely be predicted from pulse characteristics (Fig. 7). Under the present test conditions, and for the POCs tested, pulse timing had a relatively minor influence on oxygen delivery compared with pulse volume; in other words, the POCs tended to function as intended and delivered pulses early in the inspiratory phase of the breath. Although previous experiments in the literature that compared FIO2 between pulse flow and continuous flow oxygen modes of delivery exist,16,17 the choice in the present work to measure oxygen over time at the trachea of a realistic airway model (instead, for example, of oxygen concentration inside the test lung) is a key methodological difference from past studies. In previous studies, the conducting airways were represented by using a length of tubing of constant diameter.16–18 In reality, the tracheobronchial tree consists of a series of branching airways, with a highly variable diameter, depending on depth in the lung.13,19 Therefore, in the present work, a more complex, although still idealized, multi-generational mathematical model of the conducting airways was adopted to assess transport from the distal end of the trachea into the acini of the lung.
In the present mathematical model, the initial oxygen concentration in the conducting airways must be independently specified. The choice of a concentration of zero was made so to model, in absolute terms, the amount of freshly delivered oxygen passing the trachea that was transported in a single inhalation to the acini. The present combination of in vitro and in silico, or mathematical, modeling approaches inherently included the influence of pulse timing on efficiency of delivery to the acini because POCs are tested under realistic triggering conditions. Efficiency of delivery tended to be positively correlated with minute volume (Fig. 9). That is, efficiencies of the exercise breathing pattern were higher than those of the rest breathing pattern, which were, in turn, higher than those of the sleep breathing pattern. The arrival of fresh oxygen can be identified in Figure 8 as the time at which oxygen concentration increases from zero. Because the model accounts for both convection and diffusion, a greater inhalation velocity transports gas and, therefore, oxygen, more quickly, which leads to an earlier arrival time at each generation of the airway and a higher delivery efficiency as a result. Predicted efficiency of pulse delivery to the acini (Fig. 9) still varied to some extent between POCs and POC settings for the same breathing pattern. This variability resulted from differences observed in the in vitro experiments in the timing with which pulses arrived at, and swept past, the trachea, and from differences in the volume of the oxygen pulse delivered.
Overall, pulse flow was predicted to offer advantages in efficiency of delivery, in that the fraction of oxygen delivered to the trachea that reaches gas exchange lung regions was predicted in general to be greater for pulse flow than for continuous flow oxygen (Fig. 9). This was due to the oxygen that remained in the anatomic dead space at the end of inhalation in continuous flow oxygen and never reached the gas exchange regions. But efficiency does not necessarily imply efficacy; volumes of oxygen delivered to the acini by using continuous flow oxygen were still in most cases higher than those that used pulse flow. As noted by McCoy,3 oxygen delivery must first and foremost meet the therapeutic needs of the patient. Differences in oxygen delivery reported herein between continuous flow oxygen and pulse flow settings highlight the need to titrate delivery settings to achieve a target oxygen saturation when using the same delivery device as used at home.2 Results of in vitro experiments and in silico analysis, such as those presented here, may inform this process by anticipating differences in oxygen delivery among devices and modes of administration, thereby aiding health practitioners in selecting the optimal devices for their patients.
Conclusions
In this study, in vitro experiments that used a realistic upper-airway replica were performed to compare continuous flow oxygen delivery with pulse flow from 4 commercial POCs. The volume-averaged FIO2 measured at the trachea was evaluated for 3 simulated breathing patterns, representative of patients with COPD at rest, during light exercise, and while asleep. FIO2 was not equivalent between pulse flow and continuous flow oxygen flow, and differences in oxygen delivery were greatest when high pulse flow settings were combined with low minute volume. Anticipated clinically important differences (>2% absolute difference in FIO2) were observed at all nominally equivalent pulse flow settings higher than 2. Significant differences in oxygen delivery were also measured among the different POCs operated at identical numerical pulse flow settings, with the clinically important differences occurring at the highest setting numbers (3 or 5, depending on the device).
By coupling in vitro measurements with a mathematical model of oxygen transport through the conducting airways, it was predicted that pulse flow is generally more efficient than continuous flow oxygen at delivering oxygen from the trachea to the acini. However, acinar oxygen delivery remained lower for pulse flow than for continuous flow oxygen, at nominally equivalent settings and flow. Significant differences in oxygen delivery persisted to the acini among POCs operating at identical pulse flow settings.
Acknowledgments
The authors thank Kelvin Duong at the University of Alberta for his contributions to data collection and analysis.
Footnotes
- Correspondence: John Z Chen, 2–9 Mechanical Engineering Building, University of Alberta, Edmonton, AB T6G 2G8, Canada. E-mail: jzc{at}ualberta.ca.
This study was performed at the University of Alberta in Edmonton, Alberta, Canada.
Drs Katz, Pichelin, Zhu, and Caillibotte are current employees of Air Liquide, a major provider of home oxygen therapy. The authors report no other conflicts of interest in this work.
This work was funded by Air Liquide and by Alberta Economic Development and Trade, and benefited from an equipment grant from the Canadian Natural Sciences and Engineering Research Council. Portable oxygen concentrators were supplied for testing by VitalAire Canada and by Inogen.
Supplementary material related to this paper is available at http://www.rcjournal.com.
See the Related Editorial on Page 230
- Copyright © 2019 by Daedalus Enterprises


