

Abstract
BACKGROUND: Widespread use of transcutaneous PCO2 (PtcCO2) monitoring is currently limited by concerns many practitioners have regarding accuracy. We compared the accuracy of PtcCO2 with that of PaCO2 measurements in critically ill children, and we investigated whether clinical conditions associated with low cardiac output or increased subcutaneous tissue affect this accuracy.
METHODS: We performed a single-center prospective study of critically ill children placed on transcutaneous monitoring.
RESULTS: There were 184 children enrolled with paired PaCO2 and PtcCO2 values. Subjects had a median age of 31.8 mo (interquartile range 3.5–123.3 mo). Most children were mechanically ventilated (n = 161, 87.5%), and many had cardiac disease (n = 76, 41.3%). The median PaCO2 was 44 mm Hg (interquartile range 39–51 mm Hg). The mean bias between PaCO2 and PtcCO2 was 0.6 mm Hg with 95% limits of agreement from −13.6 to 14.7 mm Hg. The PtcCO2 and PaCO2 were within ±5 mm Hg in 126 (68.5%) measurements. In multivariable modeling, cyanotic heart disease (odds ratio 3.5, 95% CI 1.2–10, P = .02) and monitor number 2 (odds ratio 3.8 95% CI 1.3–10.5, P = .01) remained associated with PtcCO2 ≥ 5 mm Hg higher than PaCO2. Serum lactate, fluid balance, renal failure, obesity, vasoactive-inotrope score, and acyanotic heart disease were not associated with high or low PtcCO2 values. In 130 children with a second paired PtcCO2 and PaCO2 measurement, predicting the second measured PaCO2 by subtracting the initial observed difference between the PtcCO2 and PaCO2 from the subsequent measured PtcCO2 decreased the mean bias between observed and predicted PaCO2 to 0.2 mm Hg and the 95% limits of agreement to −9.4 to 9.7 mm Hg.
CONCLUSIONS: PtcCO2 provides an acceptable estimate of PaCO2 in many critically ill children, including those with clinical conditions that may be associated with low cardiac output or increased subcutaneous tissue, although it does not perform as well in children with cyanotic heart disease. PtcCO2 may be a useful adjunct monitoring method, but it cannot reliably replace PaCO2 measurement.
- capnography
- carbon dioxide
- pediatric intensive care unit
- monitoring
- physiologic
- respiration
- artificial
- heart disease
Introduction
Continuous monitoring of PCO2 is indicated in many critically ill patients to gauge the adequacy of gas exchange and to guide mechanical ventilation decisions in respiratory failure. Although arterial CO2 (PaCO2) is considered to be the most accurate PCO2 measurement, it is not suitable for continuous monitoring because it is invasive and requires a blood draw. In mechanically ventilated children, end-tidal PCO2 (PETCO2) can provide a breath-to-breath estimate of PaCO2, but this requires an invasive cuffed airway, can only be used during conventional ventilation, and often does not reflect PaCO2 in situations of cardiopulmonary disease.1 Critical care practice would benefit from an accurate, noninvasive method for continuous CO2 monitoring.
Transcutaneous PCO2 (PtcCO2) monitors have been available since the 1980s to continuously monitor CO2 levels, but their widespread use has been limited by the concerns many practitioners have regarding their accuracy. These monitors utilize methodology first described by Severinghaus to estimate PaCO2 by measuring the diffused PCO2, after warming the skin, through a pH glass electrode.2 Clinicians have been concerned specifically with the accuracy of PtcCO2 in situations that may compromise CO2 washout from tissue or increase the distance over which CO2 molecules travel to the probe (eg, low cardiac output, poor skin perfusion, obesity, edema). There are a few small studies in critically ill children assessing the accuracy of PtcCO2 monitors in general, and to our knowledge there are none that have assessed the impact of specific clinical conditions on accuracy. Recent reviews have called for additional study in this area.3
We sought to determine the accuracy of PtcCO2 measurements in comparison to measurements of PaCO2 in critically ill children and the clinical conditions that may affect this accuracy. We hypothesized that variables associated with low cardiac output and a large amount of subcutaneous tissue would be associated with higher PtcCO2 values in children compared to PaCO2.
QUICK LOOK
Current knowledge
There are many clinical situations in which an accurate noninvasive continuous estimate of PaCO2 could be helpful in critically ill children. In small studies, transcutaneous CO2 (PtcCO2) measurements have acceptable accuracy and may meet this need. However, certain clinical conditions (eg, low cardiac output, increased subcutaneous tissue) may affect the accuracy of PtcCO2 measurements in critically ill children.
What this paper contributes to our knowledge
In a large cohort of critically ill children with a variety of clinical conditions, PtcCO2 provided an acceptable estimate of PaCO2. Children with cyanotic congenital heart disease were more likely to have a falsely high PtcCO2 measurement. High lactate level, vasoactive-inotrope score, acyanotic heart disease, fluid balance percentage, renal failure, breathing frequency, high bilirubin level, and obesity were not associated with either falsely high or low PtcCO2 levels.
Methods
We enrolled subjects from the pediatric and cardiothoracic ICUs at Children's Hospital Los Angeles for this single-center, prospective, observational cohort study from October 2013 through March 2017. Children <21 y old with an arterial line and scheduled arterial blood gases were eligible for inclusion. Exclusion criteria included children with a skin condition precluding probe placement. This study was approved by the Institutional Review Board at Children's Hospital Los Angeles. A convenience sample was enrolled as the subjects, parents, or legal guardians were approached for informed consent based on investigator availability.
Measurements
PtcCO2 was monitored with the V-Sign Sensor 2 (VS-A/P/N), which was operated by the SenTec Digital Monitor with software versions MPB-SW:V05.01.03/SMB-SW:V07.01.5 (SenTec AG, Therwil, Switzerland) in accordance with manufacturer recommendations. The sensor was placed on the chest preferentially; however, other sites were occasionally used, based primarily on parent preference or if surgical dressings impeded placement. After an initial warming phase, sensors were maintained at 42°C. Unit respiratory therapists were trained in monitor management and were responsible for calibration of the monitor and recording data. Calibration was performed at a minimum of every 8 h. PaCO2 measurements from arterial blood gases, performed at the bedside using an EPOC blood gas analyzer (Alere, Waltham, Massachusetts), were done at the discretion of the primary medical team. The first paired PaCO2 and PtcCO2 levels obtained after study enrollment were used for analysis. Drift-corrected values of PtcCO2, accounting for PtcCO2 drift over the monitoring period, were also obtained from the SenTec VSTATS software after the data were downloaded from the monitor. Drift-corrected values cannot be obtained in real time and are not available immediately to the bedside clinician. The PtcCO2 trend was evaluated in the 5 min prior to and after the arterial blood gases. If there was a change of > 1.5 mm Hg in PtcCO2 during the 10 min surrounding the arterial blood gas measurement, the PtcCO2 was discarded and the subsequently measured paired PtcCO2 and PaCO2 (if available) were used for that subject.
Respiratory therapists and nurses in the ICUs are trained to obtain arterial blood gases during periods of relative stability and not within 15 min of endotracheal tube suctioning or ventilator changes. From the electronic medical record, we obtained information on demographics, diagnoses, respiratory support, vasoactive medications, fluid balance, and laboratory values.
Variable Definition
Primary admission diagnosis was categorized as post-surgical, congenital heart disease, respiratory failure, sepsis, neurologic, and other. Subjects were classified as having cyanotic heart disease if they had a right-to-left intracardiac shunt. Subjects with surgically corrected cyanotic congenital heart disease or other cardiac abnormalities were classified as having acyanotic heart disease. Fluid balance was summed over the days of hospitalization prior to the paired set of CO2 levels used for analysis. For subjects hospitalized > 7 d, we limited the fluid balance analysis to the 7 d of hospital admission prior to the analyzed CO2 levels. Fluid balance percentage was defined as ([fluid in − fluid out]/ICU admission weight) × 100. Subjects with a body mass index > 25 kg/m2 were considered to be obese (yes/no). Vasoactive inotrope score (VIS) was calculated as VIS = dopamine dose + dobutamine dose + 100 × epinephrine dose + 10 × milrinone dose + 10,000 × vasopressin dose + 100 × norepinephrine dose; all doses were considered as μg/kg/min except for vasopressin, which was considered as units/kg/min. Renal failure (yes/no) was defined as either a creatinine > 1.5 mg/dL or requiring either hemofiltration or dialysis. A high serum lactate was defined as > 20 mg/dL (yes/no). A high serum bilirubin was defined as ≥ 2 mg/dL (yes/no). Children who did not have an available lactate level or bilirubin were considered to have a normal serum lactate or bilirubin.
Statistical Analysis
Statistical analysis was performed using STATA (version 15, StataCorp, College Station, Texas). Bland-Altman analysis and graphs were created with GraphPad Prism (version 5, GraphPad Software, La Jolla, California). A descriptive initial analysis of the data was performed. Our primary outcome was the bias (mean difference) and 95% limits of agreement (mean difference ± 1.96 SD) between PaCO2 and PtcCO2. A Bland-Altman plot was created to demonstrate the relationship between PaCO2 and PtcCO2. A Spearman's correlation coefficient was calculated between PaCO2 and PtcCO2 (data were not normally distributed) to assess the strength of the relationship between the variables.
As the covariates associated with a PtcCO2 value higher than the PaCO2 value were hypothesized to be different than those associated with a PtcCO2 value lower than the PaCO2 value, measurements were categorized as PtcCO2 ≥ 5 mm Hg higher than PaCO2, PtcCO2 ± 5 mm Hg of PaCO2, and PtcCO2 ≥ 5 mm Hg lower than PaCO2. These categories were used to analyze the association with covariates of low cardiac output (high lactate, VIS, cyanotic heart disease, acyanotic heart disease), increased subcutaneous tissue (fluid balance, obesity, renal failure, age), monitor performance/other (time from calibration, probe site, monitor number, study year, breathing frequency, high bilirubin) using a Kruskal-Wallis test (continuous variables) or a chi-square test (categorical variables). Multivariable modeling was used to determine the influence of covariates on the difference between PtcCO2 and PaCO2. We built separate logistic regression models for the dependent variables: 1) PtcCO2 ≥ 5 mm Hg higher than PaCO2 and 2) PtcCO2 ≥ 5 mm Hg lower than PaCO2. To meet assumptions of linearity in the models, VIS (0, 0–10, ≥ 10), age (< 2 y, 2–10 y, ≥ 10 y), fluid balance percentage (negative, 0–10%, 10–20%, ≥ 20%), and breathing frequency (< 30 breaths/min, 30–50 breaths/min, ≥ 50 breaths/min) were analyzed as categorical variables (categorization groups determined empirically). PaCO2 was analyzed using categories (< 35 mm Hg, 35–55 mm Hg, ≥ 55 mm Hg) to define a low and high PaCO2 category (< 25th percentile and > 75th percentile, respectively). Variables with a univariate association of P < .20 were considered for a multivariable model. Variables with a significance level of P < .05 remained in the final multivariable model. Confounding variables were included in the final multivariable model if they changed the ß estimate by > 15%. Goodness of fit was assessed with a Hosmer-Lemeshow chi-square test.
In subjects with available subsequent paired PaCO2 and PtcCO2 measurements, a secondary analysis examined whether the relationship between PtcCO2 and PaCO2 remained consistent among individual subjects over time. We approached this analysis in 2 ways. First, we used the difference between the first paired measurement of PtcCO2 and PaCO2 to predict the second measurement of PaCO2 by subtracting the first measurement difference from the second measurement of PtcCO2. For example, if the PtcCO2 was 50 mm Hg when the PaCO2 was 45 mm Hg, then the assigned difference was +5 mm Hg. If the subsequent PtcCO2 was 60 mm Hg, we would then predict that the PaCO2 would be 55 mm Hg, maintaining this difference. Second, we considered the values for the initial difference between PtcCO2 and PaCO2 in the first paired measurement, the second measurement of PtcCO2, and other covariates for a linear regression prediction model for the second gas PaCO2. We reported the bias and 95% limits of agreement between the observed and predicted PaCO2 values using the above 2 methods.
Results
There were 200 critically ill subjects enrolled in the study. Those without a paired PtcCO2 and PaCO2 measurement after study enrollment (n = 9) or without paired measurements during a period of stable PtcCO2 (n = 7) were excluded. Therefore, paired PtcCO2 and PaCO2 measurements obtained from 184 subjects were used for the analysis. The first recorded paired measurements were used in 153 subjects (83.2%), and in 31 subjects (16.8%) a subsequent paired measurement was used for the analysis (due to a change of > 1.5 mm Hg in PtcCO2 during the 10 min surrounding the first arterial blood gas). The primary reasons for ICU admission included congenital heart disease (34.2%), respiratory failure (25%), post-surgery (12.5%), sepsis (11.4%), neurologic issue (5.4%), and other (11.4%). The median age and interquartile range (IQR) of the included subjects was 31.8 months (IQR 3.5–123.3 mo) (Table 1). Most subjects were mechanically ventilated (n = 161, 87.5%), and many had cardiac disease (n = 76, 41.3%). The median VIS was 5 (IQR 0–10.4), and 13% of subjects (n = 24) had a high serum lactate (> 20 mg/dL). There were 30 subjects (16.3%) with a > 20% positive fluid balance for their hospital stay at the time of the paired PtcCO2 and PaCO2 measurements.
Carbon Dioxide Levels and Clinical Characteristics of Children at the Time of Measurement
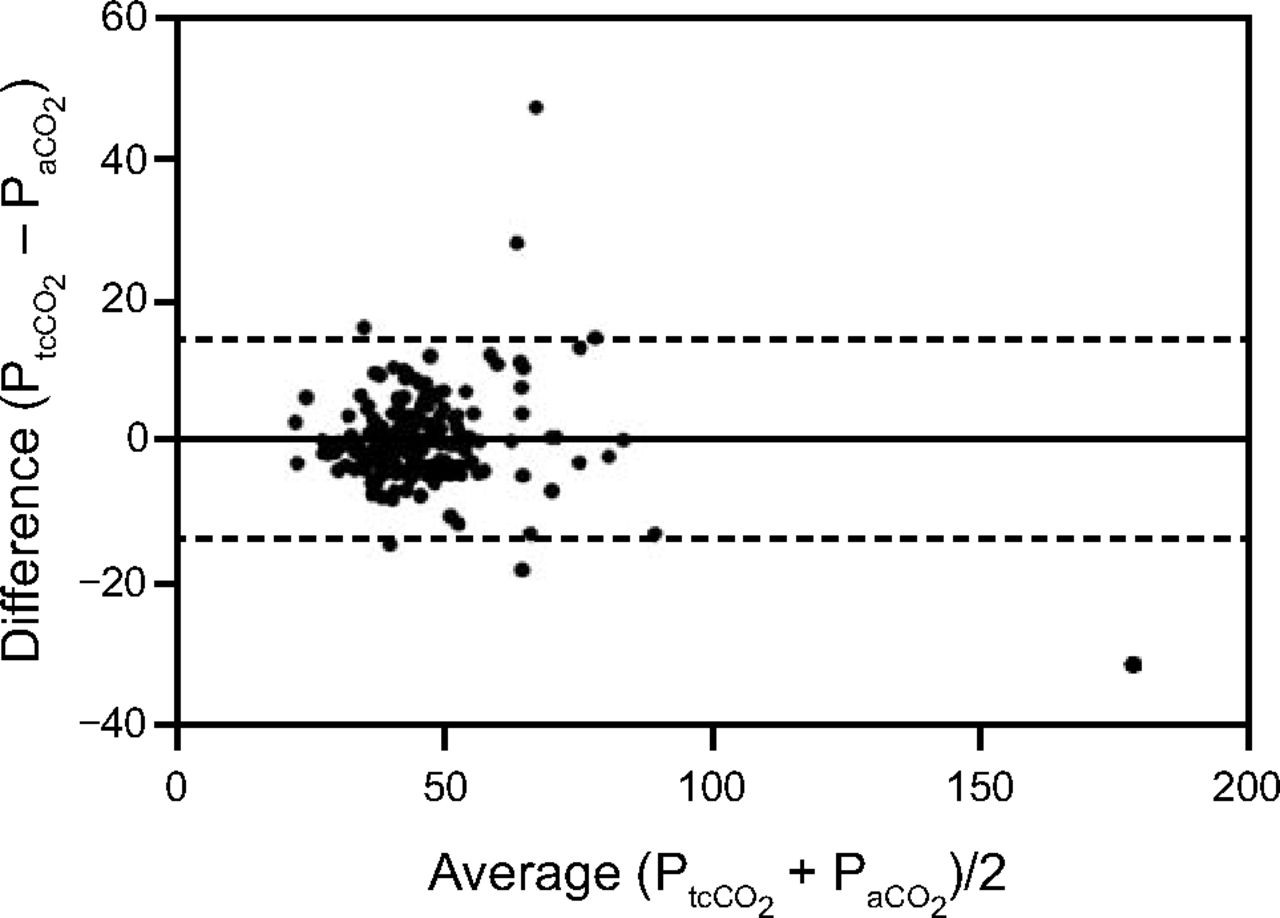
The median PaCO2 was 44 mm Hg (IQR 39–51 mm Hg), with a range 21–194 mm Hg. The median PtcCO2 was 45 mm Hg (IQR 38–51 mm Hg) with a range of 21–163 mm Hg. In 126 (68.5%) measurements, the PtcCO2 was within ± 5 mm Hg of the PaCO2. In 39 (21.1%) measurements, the PtcCO2 was ≥ 5 mm Hg higher than the PaCO2, and in 19 (10.3%) measurements, the PtcCO2 was ≥ 5 mm Hg lower than the PaCO2. In 153 measurements (83.2%), the PtcCO2 was ± 7.5 mm Hg of the PaCO2.
The mean bias between PaCO2 and the PtcCO2 was 0.6 mm Hg with 95% limits of agreement from −13.6 to 14.7 mm Hg (Fig. 1). The correlation between PaCO2 and PtcCO2 was high (rs = 0.83).

Bland-Altman plot showing the difference between PtcCO2 and PaCO2 plotted against the average of the PtcCO2 and the PaCO2. The horizontal line represents the bias (mean difference), and the dashed lines indicate the limits of agreement (± 1.96 SD).
Drift-Corrected PtcCO2 Measurements
In the 162 (88%) subjects with drift-corrected data, 114 subjects (70.4%) had a drift-corrected PtcCO2 ± 5 mm Hg of the PaCO2. This was not significantly more than the 108 subjects (66.7%) in this subgroup who had a real-time PtcCO2 ± 5 mm Hg of the PaCO2 (P = .17). The mean bias between PaCO2 and the drift-corrected PtcCO2 was 0.4 mm Hg with 95% limits of agreement from −11 to 11.8 mm Hg. The correlation between PaCO2 and the drift-corrected PtcCO2 was high (rs = 0.86).
Logistic Regression Models
Univariate risk factors for PtcCO2 ≥ 5 mm Hg higher than PaCO2 included cyanotic heart disease, monitor number 2, and age < 2 y (P < .05). Cyanotic heart disease (odds ratio 3.5, 95% CI 1.2–10, P = .02) and monitor number 2 (odds ratio 3.8, 95% CI 1.3–10.5, P = .01) remained independently associated with PtcCO2 ≥ 5 mm Hg higher than PaCO2 after controlling for age, which did not maintain an independent association (reference range 2–10 y; < 2 y: odds ratio 2.7, 95% CI 0.96–7.7, P = .06; ≥ 10 y: odds ratio 1.2, 95% CI 0.36–4.2, P = .73) but did meet a priori criteria as a confounding variable.
The only identified univariate risk factor for producing a PtcCO2 at least 5 mm Hg lower than the PaCO2 was PaCO2 ≥ 55 mm Hg (odds ratio 3.5 (95% CI 1.2–10), P = .02). There were no confounding variables that affected this relationship.
Probe location, time from monitor calibration, study year, breathing frequency, high lactate level, high bilirubin level, VIS, acyanotic heart disease, fluid balance percentage, renal failure, and obesity were not associated with either high or low PtcCO2 levels (all P > .05). In post hoc sensitivity analysis, using multiple different cutpoints, VIS remained unassociated with either high or low PtcCO2 levels (P > .05).
Of the 4 monitors used for this study, one monitor was associated with high PtcCO2 values (odds ratio 3.4, 95% CI 1.3–9.1, P = .01). This monitor was used on 27 subjects (14.7%). When the primary analysis was repeated without the subjects studied on this monitor, the results were similar.
Prediction Modeling
For the purpose of prediction modeling, 130 subjects (70.7%) had a second paired PtcCO2 and PaCO2 measurement. The median time between gases used for this analysis was 6 h (IQR 3−11 h). Most subjects (n = 97, 74.6%) remained in the same category (PtcCO2 ≥ 5 mm Hg higher than PaCO2, ± 5 mm Hg of PaCO2, or ≥ 5 mm Hg lower than PaCO2) from the first paired measurement to the second paired measurement (Table 2).
Category of First Paired PaCO2 and PtcCO2 Measurement and Second Paired Measurement
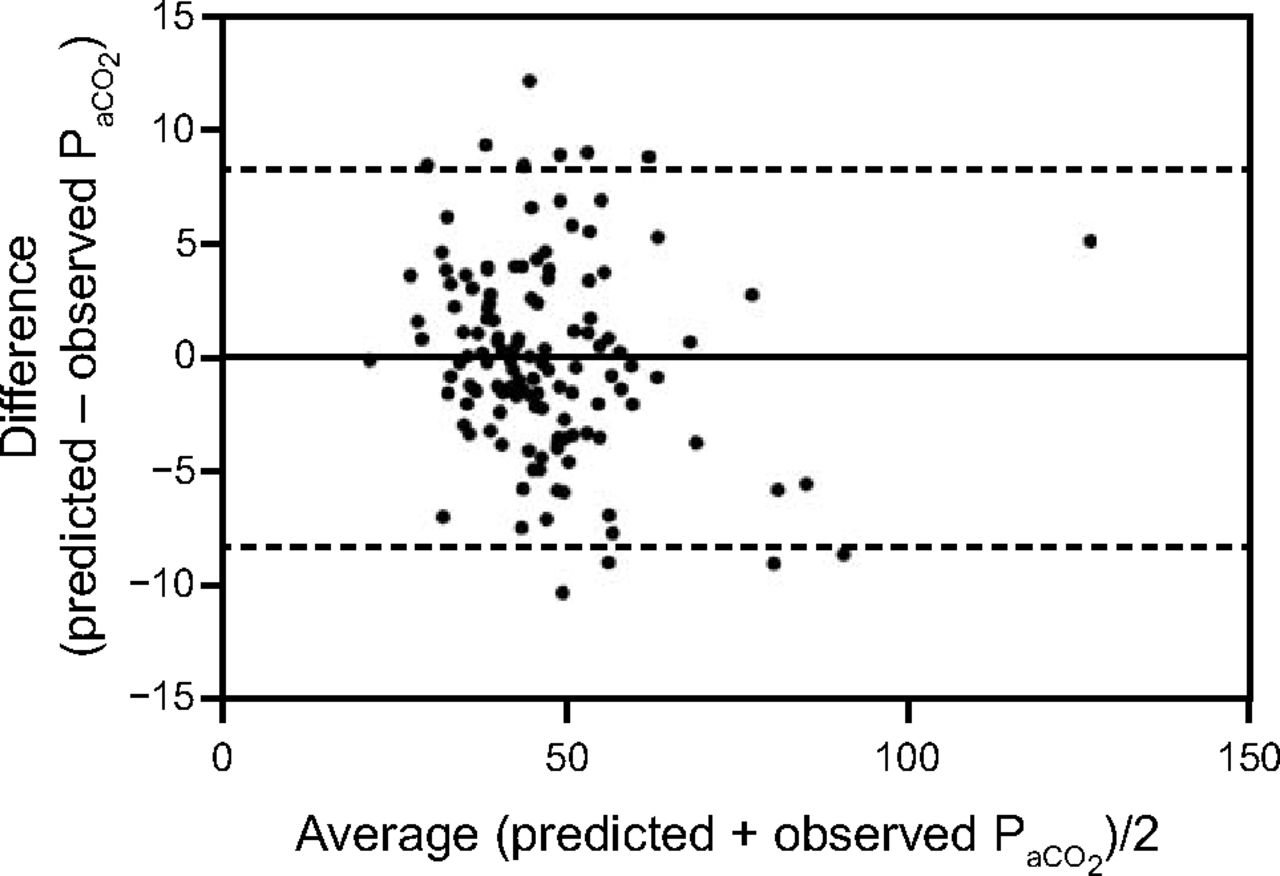
The mean bias between the observed and predicted PaCO2 when adding the initial measurement difference between PaCO2 and PtcCO2 to the second paired measurement PtcCO2 was 0.2 mm Hg, with 95% limits of agreement from −9.4 to 9.7 mm Hg. In multivariable linear regression modeling, including a variable for the change in PtcCO2 from the first to the second measurement, we further narrowed the 95% limits of agreement between the predicted PaCO2 and the observed PaCO2 (bias 0 mm Hg, 95% limits of agreement from −8.3 to 8.3 mm Hg) (Table 3, Fig. 2).
Multivariable Predictive Linear Regression Model for Second Measurement of PaCO2

Bland-Altman plot of predicted PaCO2 and observed PaCO2 using the developed multivariable predictive linear regression model. The difference between the predicted PaCO2 and observed PaCO2 is plotted against the average of the predicted PaCO2 and the observed PaCO2. The horizontal line represents the bias (mean difference), and the dashed lines indicate the limits of agreement (± 1.96 SD).
Discussion
We analyzed the accuracy of PtcCO2 monitoring in a large diverse population of critically ill children with an extensive range of PaCO2 values, finding that PtcCO2 provides a clinically useful estimate of PaCO2 (± 5 mm Hg) in most clinical conditions, including many that are associated with low cardiac output or increased subcutaneous tissue. We found that subjects with cyanotic heart disease are more likely to have PtcCO2 values ≥ 5 mm Hg higher than PaCO2. The specific monitor used was also important in our analysis because one of the 4 monitors we used was associated with a PtcCO2 value ≥ 5 mm Hg higher than PaCO2. In secondary analyses we demonstrated that the PtcCO2 and PaCO2 difference can be used to improve the prediction ability of subsequent PtcCO2 measurements.
Our findings are similar to previous studies in newborns, adults, and children, demonstrating a small bias and poor precision with wide limits of agreement between PaCO2 and PtcCO2.4–10 Urbano et al5 found similar results in 11 critically ill children monitored with the SenTec monitor, a bias of −2.1 mm Hg with 95% limits of agreement of ± 10.6 mm Hg. This previous study used a range of ± 7.5 mm Hg as acceptable and found that 81.2% of measurements fell within this range.5 This was similar to the 83.2% of measurements in our study where the PtcCO2 was within ± 7.5 mm Hg of the PaCO2.
Measurement of PtcCO2 requires warming of the skin to hyperperfuse capillaries and facilitate diffusion of CO2 through the skin. Children with cyanotic heart disease, particularly in the perioperative period, often have low cardiac output with decreased skin perfusion. Decreased skin perfusion causes reduced removal of CO2 from the skin through the blood, so it is not surprising that PtcCO2 levels ≥ 5 mm Hg higher than PaCO2 were associated with children with cyanotic heart disease.1 We did not find a significant association between other markers of poor cardiac output such as high lactate level, VIS, or acyanotic heart disease and a PtcCO2 ≥ 5 mm Hg higher than PaCO2. Lactate can be elevated for reasons other than poor perfusion, which may have led to nonsignificance. In previous studies, doses of epinephrine as high as 0.3 μg/kg/min were required to observe a diminished correlation between PaCO2 and PtcCO2.11 We did not see this association in our data, although in our study only 5 subjects were on doses of vasoconstrictors this high. It is possible that many of the children in our study with acyanotic heart disease did not have low cardiac output at the time of measurement, and only the children with cyanotic heart disease had compromised cardiac output to the degree necessary to affect skin perfusion.
In 10.9% of the measurements the PtcCO2 was ≥ 5 mm Hg lower than PaCO2. For some of the measurements this was in the situation of a very high PaCO2, as demonstrated by the significant association between a PaCO2 ≥ 55 mm Hg and a PtcCO2 ≥ 5 mm Hg lower than PaCO2 in the multivariable analysis. The primary theoretical reason for this type of discrepancy in other measurements would be problems with either probe placement or technical drift of the measurement. Although all respiratory therapists were trained in appropriate probe placement, it was not required that they check probe placement prior to recording data. The accuracy of PtcCO2 measurements may improve with more frequent monitoring of probe placement or calibration, although this would also make the monitors more cumbersome to use in a clinical setting.
An accurate, noninvasive, and continuous method to estimate PaCO2 is desirable for optimal patient care in most critically ill children. Although noninvasive continuous oxygenation monitoring is universally clinically accepted with pulse oximetry, no such method is universally accepted for CO2 monitoring. Assessment of both oxygenation and ventilation are necessary to determine the respiratory status of a patient. High PaCO2 increases blood flow to the brain and decreases blood flow to the lungs. It is imperative in situations such as increased intracranial pressure or pulmonary hypertension that clinicians closely monitor PaCO2 levels as a reflection of changing pH. While PtcCO2 monitoring does not have the precision to replace PaCO2 measurement routinely, our data suggest that in many children it may be a useful adjunct continuous PCO2 monitoring method.
Most mechanically ventilated children are monitored with end-tidal capnography because it provides breath-to-breath PCO2 values, confirming appropriate endotracheal tube placement; and for some children it provides an acceptable continuous estimate of PaCO2. However, PETCO2 may be inaccurate and highly variable in periods of incomplete exhalation when dynamic hyperinflation is present.12 Furthermore, critically ill children (particularly those with significant lung or cardiac disease) often have elevated alveolar dead space (ie, alveoli that are ventilated without perfusion).13–15 This results in a PETCO2 that is lower than PaCO2. In small infants, some clinicians argue against using PETCO2 monitoring at all because the monitor adds airway dead space to the ventilator circuit. Furthermore, clinicians are more commonly choosing noninvasive modes of respiratory support such as high-flow humidified nasal cannula or bi-level positive airway pressure. Children on noninvasive respiratory support often have changing cardiorespiratory pathophysiology and are a population in which close monitoring of respiratory status is imperative for the detection of clinical deterioration and timely intervention. Continuous monitoring of CO2 levels with PtcCO2 has the potential to address many of the known problems with PETCO2 monitoring in some children.
In mechanically ventilated children with ARDS, concerns regarding ventilator-induced lung injury have led to guidelines that recommend permissive hypercapnia.16 Currently, blood gases are the primary method for ventilation assessment in children with ARDS, and ventilator changes occur infrequently.17 To prevent periods of overventilation, and thus abide by permissive hypercapnia, more frequent and accurate measurements of CO2 to prompt ventilator changes are necessary. The limits of agreement we found for PtcCO2 are likely sufficient for this purpose. Moreover, in critically ill children with acute hypoxemic respiratory failure, elevated dead space has been associated with increased mortality.13,14 Using PtcCO2-based prediction modeling of PaCO2 for dead space calculation could be feasible for noninvasive monitoring of dead space for prognostic purposes in some children.
Although some may disagree on how close a PtcCO2 measurement should be to a PaCO2 measurement for clinical use, values ± 5 mm Hg are close to the acceptable error of measurement within point-of-care devices for PaCO2 measurements.18 There are limits to accuracy for all measurement devices. Some of the devices that intensivists rely on heavily to be accurate often have surprisingly wide limits of agreement. For example, while pulse oximetry is considered accurate by most clinicians, research has demonstrated that, when pulse oximetry oxygen saturation values are below normal, the limits of agreement can be quite wide and are comparable to the range we found for PtcCO2 in this study.19,20
Our study had several limitations. We chose to operate the V-Sign Sensor 2 at 42°C to limit the risk of skin blistering or burning (no patients experienced either in our study). However, a higher monitoring temperature may have improved the accuracy of PtcCO2 measurements.21 Our analysis was limited by the sample size, which may have led to a lack of power to detect some associations. For example, it is possible that, in a larger sample size, age < 2 y old may have retained an independent association in the multivariable model for PtcCO2 ≥ 5 mm Hg higher than PaCO2. Furthermore, we did not measure cardiac output or subcutaneous tissue in the subjects, relying instead on surrogate measures. It is possible that measured cardiac output or subcutaneous tissue would have been more strongly associated with accuracy. We did not perform blood gases for the purposes of the study, therefore there was a variable time from monitor set up and calibration to blood gas. However, the time from calibration was not associated with accuracy in our analysis. The subjects who were selected for our study all had an arterial line in place for blood gas monitoring. In general, children with an arterial line have a higher severity of illness. It is possible that PtcCO2 monitoring would perform differently in the larger population of critically ill children without an arterial line, although we would anticipate PtcCO2 to perform better in this population due to the lower severity of illness, not worse. We limited our study to the SenTec PtcCO2 monitor. It is possible that other monitors perform with higher or lower accuracy.
Conclusions
PtcCO2 provides an acceptable estimate of PaCO2 in many critically ill children, including those with clinical conditions that may be associated with low cardiac output or increased subcutaneous tissue, although it does not perform as well in children with cyanotic heart disease. PtcCO2 monitoring may be useful as a noninvasive continuous method of estimating PaCO2 in critically ill children. However, it cannot be used reliably in place of PaCO2 measurements.
Footnotes
- Correspondence: Anoopindar K Bhalla, 4650 Sunset Blvd MS#3, Los Angeles, CA 90027. E-mail: abhalla{at}chla.usc.edu.
Dr Bhalla presented a version of this paper at the 2015 meeting of the Pediatric Academic Societies held April 25–28, 2015, in San Diego, California.
The authors have disclosed a relationship with SenTec AG (Therwil, Switzerland). Dr Bhalla has disclosed a relationship with NCATS. Dr Khemani has disclosed a relationship with Orange Med and Nihon Kohden. Dr Newth has disclosed a relationship with Philips and Covidien.
- Copyright © 2019 by Daedalus Enterprises


