

Abstract
BACKGROUND: There are few reports in the literature supporting the understanding of the physiological mechanisms of intolerance in patients with COPD to perform unsupported upper limb activities. The aims of this study were to quantify the electrical activity and oxygenation of inspiratory and upper limb muscles, and to investigate whether electromyographic manifestations of muscle fatigue are related to upper limb function as assessed by the 6-min pegboard and ring test (6PBRT) in subjects with COPD and in healthy subjects.
METHODS: Thirty subjects with COPD (FEV1 42.1 ± 16.4% predicted; 68.0 ± 7.6 y old) comprised the COPD group, and 34 healthy subjects (66.8 ± 8.0 y old) comprised the control group. Both groups were assessed for body composition with dual-energy radiograph absorptiometry and spirometry. The 6PBRT was performed with simultaneous assessment of electromyography, near-infrared spectroscopy, and gas analyses (expiratory minute volume).
RESULTS: Differences were observed between groups for performance (number of rings) in the 6PBRT, with the COPD group achieving lower values than the control group (P < .001). The ventilatory demand (expiratory minute volume/maximum voluntary ventilation) and root mean square amplitude of the sternocleidomastoid muscle were higher in the COPD group than in the control group (P < .04). Lower values for oxyhemoglobin and total hemoglobin were found in intercostal muscles of the COPD group compared to the control group. The root mean square amplitude of the intercostal muscles was lower in the COPD group, while it was similar between groups for anterior deltoid and trapezius muscles. Median frequency of anterior deltoid muscles presented a decreased in both groups.
CONCLUSIONS: Our results indicate that the 6PBRT was performed at a higher electrical activity in the accessory inspiratory muscles, such as the sternocleidomastoid muscle, and a lower oxygenation profile in the intercostal muscles in subjects with COPD compared with healthy controls, but without muscle fatigue signs. These findings suggest that the higher ventilatory demand presented in subjects with COPD could have contributed to the worse performance in this group without signals of peripheral muscle limitation.
- upper extremity
- minute ventilation
- surface electromyography
- respiratory muscles
- near-infrared spectroscopy
Introduction
Patients with COPD usually present with a reduction in exercise tolerance that is associated with peripheral muscle dysfunction. However, the literature suggests that upper limb function is relatively preserved in patients with COPD due to the constant use of the upper limbs in activities of daily living (ADL).1–3 Nevertheless, patients with COPD often report difficulties in performing upper limb activities, especially during unsupported arm activities due to higher metabolic and ventilatory demand when performing these activities, triggering fatigue and dyspnea symptoms.3–5
Donaldson et al6 reported that subjects with COPD also presented with upper limb peripheral muscle dysfunction, despite more significant deficits in the lower limbs. Velloso et al7 noted that subjects with COPD exhibited high oxygen consumption in comparison with healthy subjects when performing 4 ADLs that required using upper limbs, which might be related to the early onset of muscle fatigue during ADLs in COPD. Furthermore, the higher ventilatory demand in patients with COPD could be related to higher dyspnea during ADLs.7 Meijer et al8 observed increased trapezius muscle effort in subjects with COPD during ADLs compared to healthy controls, which might be related to the dual tasks of this muscle to provide postural support while acting as an accessory muscle of inspiration.
In addition to muscular impairments, current literature suggests that patients with COPD have decreased cardiorespiratory responses when compared to control subjects during peak arm exercise, associated with increased dyspnea symptoms, hyperinflation, and higher upper limb muscle effort.1,9–12
Therefore, the intolerance found in patients with COPD to ADL performance involving unsupported upper limb activities can be caused by a variety of associated factors.12 However, to our knowledge, no studies have investigated the integrated physiological responses of subjects with COPD during unsupported upper limb activities to determine the mechanisms related to ADL intolerance in this population.
We chose to use the 6-min pegboard and ring test (6PBRT) because it is an arm exercise test, developed by Celli et al13 and validated by Zhan et al,14 that assesses the functional capacity of the upper limbs through unsupported arm activities. It is both easy to apply and reliable for the assessment of patients with COPD, thus predicting ADL performance and upper limb function in this population.15,16 In addition, the 6PBRT has discriminatory properties because it is able to differentiate the performance between subjects with COPD and healthy subjects paired by age.17
To explain the poorer performance that was expected of subjects with COPD during the 6PBRT compared to healthy controls, our study investigated the electrical activity and muscular oxygenation of the upper limb and inspiratory muscles, assessed with electromyography (EMG) and near-infrared spectroscopy (NIRS). This provided a valuable physiological insight into the occurrence of dyspnea and early fatigue during unsupported upper limb activities in subjects with COPD.
The main study hypothesis was that subjects with COPD would perform more poorly on the 6PBRT compared to healthy participants, secondary to higher muscle activation and lower muscle oxygenation during the test. To test these hypotheses, the primary aim of this study was to quantify the myoelectric activity and oxygenation of the inspiratory and upper limb muscles during the 6PBRT in subjects with COPD and healthy controls. The secondary aim was to investigate whether electromyographic manifestations of muscle fatigue are related to upper limb function assessed by the 6PBRT to further understand the physiological mechanisms underlying the upper limb function limitations observed in subjects with COPD.
QUICK LOOK
Current knowledge
Patients with COPD report significant dyspnea and fatigue symptoms, which directly affect the performance of unsupported arm activities. These activities can be assessed with the 6-min pegboard and ring test (6PBRT).
What this paper contributes to our knowledge
Our results indicate that the limitation in subjects with COPD to perform the 6PBRT was caused by the ventilatory demand imposed by unsupported arm activities, with higher electrical activity and a lower oxygenation profile in respiratory muscles, without any muscle fatigue signs.
Methods
Design and Subjects
This was a cross-sectional study approved by the local Ethics and Research Committee (55591216.9.0000.5504), and all subjects signed a written informed consent. The study was performed in the Department of Physical Therapy, Biological and Health Sciences Center, Federal University of São Carlos, São Carlos, Brazil. The sample included subjects of both genders, ≥ 40 y old. The COPD group included subjects diagnosed according to GOLD18, with comparison to healthy controls, matched by gender and age.
The subjects with COPD were clinically stable for at least 2 months. Individuals were excluded if they presented any respiratory (other than COPD in the COPD group), cardiovascular, or musculoskeletal diseases, or with neurological or orthopedic sequelae that would prevent them from performing the experimental protocols. Individuals were also excluded if they did not complete the 2 nonconsecutive days of assessments, or if EMG data were missing due to a loss of electrode contact or movement artifacts.
Experimental Procedures
The experimental procedures were performed over 2 nonconsecutive days. On the first day, all subjects performed clinical and physical assessments along with the maximum voluntary ventilation test. Subjects in the control group also performed pulmonary function testing to confirm normal spirometric values.19 Subjects with diagnosed COPD had previously performed spirometry with a pulmonologist. The pulmonary function test was performed by using a portable spirometer (Easy One, ndd Medical, Zurich, Switzerland), according to the standards of the American Thoracic Society/European Respiratory Society.20
Height was obtained with a calibrated anthropometric scale (Filizola, São Paulo, Brazil). In addition, a dual-energy radiographic absorptiometry device (Discovery QDR Series, 88385, Hologic, Bedford, Massachusetts) was used to obtained the total, fat, and lean mass for the whole body and for each upper limb.21 Body mass index was also calculated.
A familiarization protocol consisting of 1 min of 6PBRT movements was also performed on the first day. On the second day, subjects performed the 6PBRT with simultaneous assessments of myoelectrical activity and muscle oxygenation (as described below).
The 6PBRT was performed according to Zhan et al,14 with a board containing 4 pegs, 2 of them positioned at the shoulder level of the subjects and the other 2 positioned 20 cm above them. Ten rings were placed on each lower peg. The subjects were seated in a chair with column support and feet resting on the floor in front of the board, and they were instructed to move two rings at a time with both hands (one on each side) from the higher to the lower peg. When the 20 rings were placed from the lower pegs to the upper levels, subjects returned the rings to the lower level; this sequence was repeated successively for 6 min. The number of rings moved during the test was used as the final score, representing performance. Two 6PBRTs were performed with a 30-min rest interval between tests. The highest score between the 2 6PBRTs (ie, interpreted as the best performance) was considered for further analysis, including the signals related to myoelectric activity and muscle oxygenation. During the 6PBRT, expiratory minute ventilation was obtained with a metabolic cart (MedGraphics VO2000, St Paul, Minnesota) composed of a bi-directional low-flow pneumotachograph connected to a face mask. Subjects were encouraged verbally every minute during the test. The verbal command was standardized.
Surface EMG
Surface electromyographic (sEMG) signals were recorded at 2,000 Hz using a portable system (Myomonitor IV, DelSys, Boston, Massachusetts). Active differential electrodes (Model DE-2.3, DelSys) were affixed to the skin with double-sided adhesive (DelSys). The electrodes have a detection geometry of 2 parallel bars (1 mm× 1 cm) arranged 1 cm apart, with the following characteristics: IRMC > 92 dB; input impedance > 1015 Ω in parallel, with 0.2 pF; voltage gain of 10; noise ratio of 1.2 μV (root mean square [RMS]). Before electrode placement, the skin was rubbed lightly with 70% ethyl alcohol and shaved to reduce the impedance and eliminate possible interference. The signals were conditioned by the main amplifier (16 bits of resolution and noise of 1.2 μV RMS), providing a gain of 1,000.
Four muscle groups were assessed with EMG: respiratory muscles (ie, sternocleidomastoid muscle and intercostal muscles) and upper limb muscles (ie, anterior deltoid and trapezius muscles). The sternocleidomastoid muscle electrode was placed at 5 cm in the mass of muscle between the insertion and the origin of the mastoid process.22,23 The intercostal muscle electrode was placed in the second intercostal space, 3 cm parasternal.24,25 The anterior deltoid muscle electrode was placed 2 finger-widths below the acromion process,26 and the trapezius muscle electrode was placed 2 cm lateral to the midpoint between C7 and the acromion process.26 The reference electrode (adhesive, square, 5 × 5 cm) was placed on the manubrium sternae (Fig. 1).

Location of electromyography surface electrodes and near-infrared spectroscopy probes.
To normalize the sternocleidomastoid muscle and intercostal muscle signals, 3 maximum voluntary contractions using the maximum inspiratory pressure maneuver were performed and measured with a digital manovacuometer (MVD300, Globalmed, Porto Alegre, Brazil).27 Anterior deltoid and trapezius signals were normalized through submaximum voluntary contractions. Three repetitions, each with 5-s duration and an interval of 1 min between them, were performed for each muscle, with subjects in a sitting position and 1 kg of resistance (halter). For the anterior deltoid muscles, subjects elevated their arms at 90° of forward flexion, with their thumb facing upwards.28 For the trapezius, subjects elevated their arms at 90° of abduction on the frontal plane, with their hand facing down and their neck in neutral position.29 EMG signal was obtained for 6 min while the subject was performing the 6PBRT.
NIRS
Noninvasive muscle oxygenation was investigated with a NIRS device (OXYMON MK III, Artinis Medical System, Elst, The Netherlands). Each muscle group (ie, intercostal muscles and anterior deltoid muscles) received an optode composed of 2 light-emitting optical fibers, both emitting light at 844 and 762 nm wavelength) and 1 receptor. The average distance between the light sources and the receptor was 35 mm. The intercostal muscle optode was placed on the sixth intercostal space, in the anterior axillary line,30,31 and the anterior deltoid muscle optode was placed 2 cm below the acromion-clavicular joint32 (Fig. 1). The EMG surface electrodes and NIRS probes were positioned on contralateral sides, so that all electrodes were placed on one side and all optodes were placed on the opposite side. The sides were randomized among subjects.
The NIRS device calibration and procedures were conducted following the manufacturer's recommendations. Capillary blood concentrations of oxyhemoglobin and deoxyhemoglobin were measured at 250 Hz during the entire experiment for each light source in each muscle group (ie, intercostal muscles and anterior deltoid muscles). The local blood volume was estimated by the total hemoglobin (Hb), calculated as the sum of oxyhemoglobin and deoxyhemoglobin.
Data Analysis
sEMG Processing
The sEMG signals were processed using Matlab R2014a (Mathworks, Natick, Massachusetts). All signals were corrected for offset and band-pass filtered using an eighth order zero-lag Butterworth filter in the 30–450 Hz band. A preliminary analysis supported the application of a notch filter at 60 Hz, and the first two harmonics (120 and 180 Hz) with the eighth order zero-lag Butterworth filter with a 5-Hz window was used.
Signals were then converted into RMS using 1-s moving windows without overlapping. The highest sEMG peak amplitude of the maximum voluntary contractions and the mean sEMG amplitude of the submaximum voluntary contractions were considered for normalization. The normalization signals were converted into RMS using 100-ms moving windows without overlapping.
The RMS and the normalized RMS (nRMS) were averaged for every 1 min of the 6PBRT. The median frequency of the signal was derived with a Fast-Fourier transform analysis and was performed to verify evidence of fatigue. Angular coefficients (slope) and the intercept of linear regression equations were obtained from median frequency and RMS values over time.
NIRS Data Processing
Data from the NIRS software (Oxysoft, Artinis Medical Systems) were downsampled and exported at 1 Hz to a computer for further analysis. Capillary blood concentration of oxyhemoglobin, deoxyhemoglobin and total Hb for each light source were averaged and then normalized by the average of the signals during the minute before the 6PBRT onset (resting). Finally, capillary blood concentration of oxyhemoglobin, deoxyhemoglobin and total Hb signals were averaged for every 1 min during the 6PBRT.
Statistical Analysis
SigmaPlot 11.0 (Systat Software, San Jose, California) was used for statistical analyses. Data distribution was verified with the Kolmogorov-Smirnov test. Demographic, anthropometric, pulmonary function variables, and performance of the test (ie, the number of rings moved) were normally distributed, so data were expressed as mean ± SD. The independent Student t test was utilized for the comparison between groups (control group vs COPD group). NIRS and EMG variables presented non-normal distribution, thus nonparametric tests were performed; however, for the sake of better data visualization, graphs were built with mean ± SD values. NIRS and EMG variables were presented as median and interquartile ranges (see the supplementary materials at http://www.rcjournal.com). The Mann-Whitney U test was used to compare groups (control group vs COPD group) within each minute of the test. The Friedman test was used to compare the variables within each group between the minutes of the 6PBRT (minutes 1, 2, 3, 4, 5, and 6). If significant differences were detected, pairwise comparisons were performed with the Dunnett post hoc test. The significance level was set at P < .05.
Results
Thirty subjects with COPD and 34 healthy subjects were included in the analysis (Figure 2). The characteristics of the sample are summarized in Table 1. No between-group differences were observed in demographic, anthropometric, and composition variables, except for pulmonary function values. According to the GOLD criteria, the distribution was not uniform: 10 subjects had moderate obstruction, 11 subjects had severe obstruction, and 9 subjects had very severe obstruction. Statistical differences were observed between groups for performance in the 6PBRT (ie, the number of rings moved), with the COPD group presenting a lower value than the control group (Table 1).

Flow charts.
Characteristics of Subjects (Control Group; Copd Group) and Performance in the 6PBRT
The upper limb muscle mass was similar between the groups, thus, after correcting the performance of the 6PBRT by muscle mass, muscle efficiency was lower in the COPD group. The ventilatory demand (ie, percentage of expiratory minute volume/maximum voluntary ventilation) calculated at minute 6 of the test was higher for the COPD group than for the control group (P < .001) (Table 1).
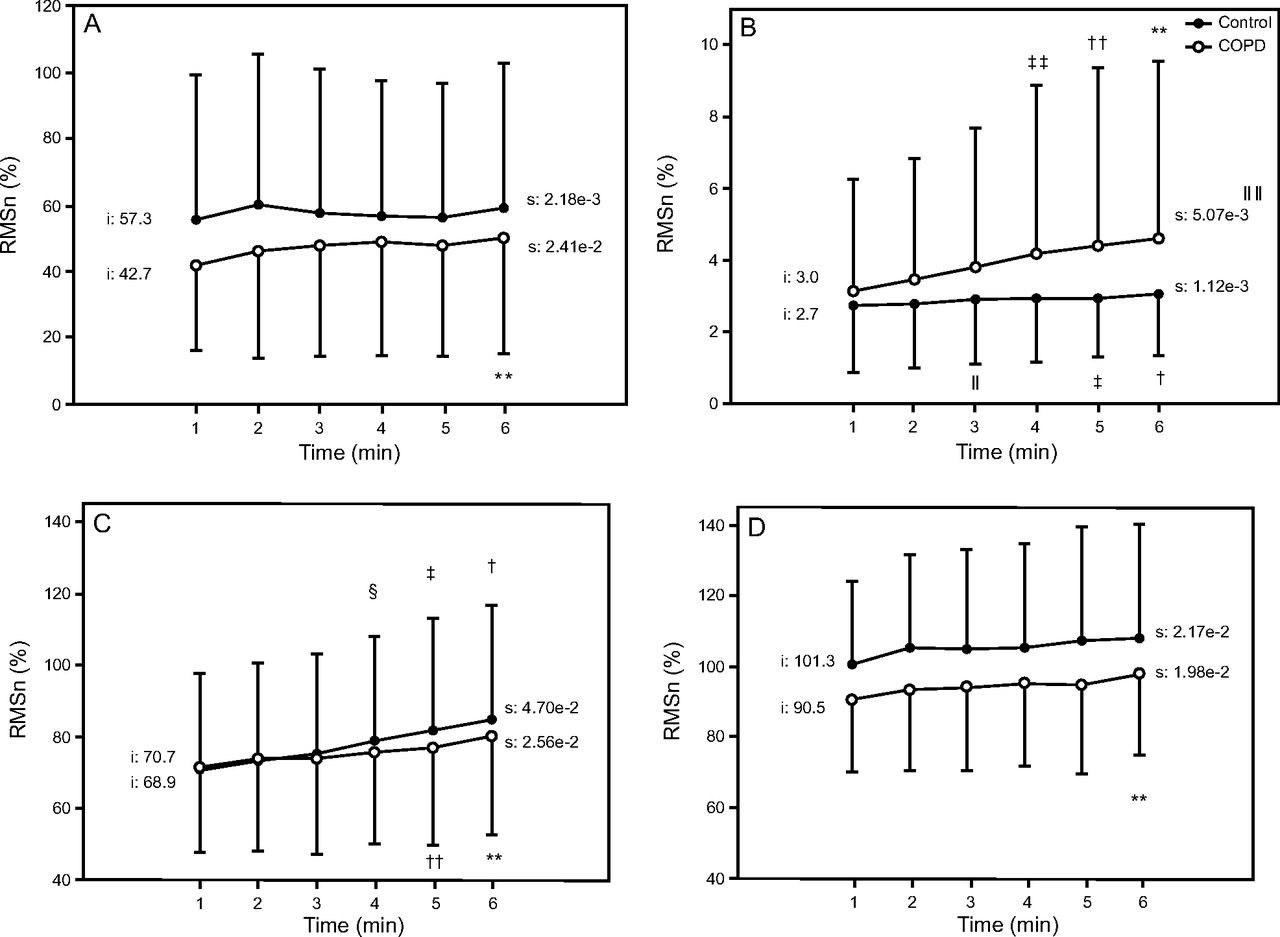
Figures 3, 4, and 5 present the changes in sEMG RMS, in sEMG nRMS, and in median frequency, respectively, from minute 1 to minute 6 of the 6PBRT for the 4 studied muscle groups of the inspiratory and upper limb functions. The RMS amplitude of intercostal muscles was significantly smaller in subjects with COPD compared with controls (difference between groups to intercept the RMS slope); the RMS amplitude of the anterior deltoid muscles was greater in the COPD group than in the control group, but the difference was not statistically significant. RMS amplitude was similar for the sternocleidomastoid muscle and trapezius muscles in both groups (Fig. 3).

Root mean square (RMS) data from the intercostal (A), sternocleidomastoid (B), trapezius (C), and anterior deltoid muscles (D) during the 6-min pegboard and ring test of both the control group and the COPD group. i = intercept; s = slope. * Significant difference between groups; † significant difference between minute 1 and minute 6 in the control group; ‡ significant difference between minute 1 and minute 5 in the control group; § significant difference between minute 1 and minute 4 in the control group; ‖ significant difference between minute 1 and minute 3 in the control group; ** significant difference between minute 1 and minute 6 in the COPD group; †† significant difference between minute 1 and minute 5 in the COPD group; ‡‡ significant difference between minute 1 and minute 4 in the COPD group; ‖ ‖ significant difference between groups for RMS slope; §§ significant difference between groups for intercept of the RMS slope. P < .05.
Normalized root mean square data from the intercostal (A), sternocleidomastoid (B), trapezius (C), and anterior deltoid muscles (D) during the 6-min pegboard and ring test of both groups. i = intercept; s = slope. † Significant difference between minute 1 and minute 6 to in the control group; ‡ significant difference between minute 1 and minute 5 in the control group; § significant difference between minute 1 and minute 4 in the control group; ‖ significant difference between minute 1 and minute 3 in the control group; ** significant difference between minute 1 and minute 6 in the COPD group; †† significant difference between minute 1 and minute in the COPD group; ‡‡ significant difference between minute 1 and minute 4 in the COPD group; ‖ ‖ significant difference between groups for RMS slope. P < .05.

Median frequency data from the intercostal (A), sternocleidomastoid (B), trapezius (C), and anterior deltoid muscles (D) during the 6-min pegboard and ring test of both groups. i = intercept; s = slope. * Significant difference between groups; † significant difference between minute 1 and minute 6 in the control group; ‡ significant difference between minute 1 and minute 5 in the control group; § significant difference between minute 1 and minute 4 in the control group; ‖ significant difference between minute 1 and minute 3 in the control group; ** significant difference between minute 1 and minute 2 in the control group; †† significant difference between minute 1 and minute 6 in the COPD group; ‡‡ significant difference between minute 1 and mintue 5 in the COPD group; §§ significant difference between minute 1 and minute 4 in the COPD group; ‖ ‖ significant difference between minute 1 and minute 3 in the COPD group; *** significant difference between groups for intercept of the RMS slope. P < .05.
In both groups, there was an increase in the RMS amplitude during the 6PBRT for the sternocleidomastoid muscle and trapezius muscles, but was increased only for the sternocleidomastoid muscle which was significant between the groups. The electrical activity of the trapezius muscle was similar between groups at the sixth minute of the test. Conversely, the electrical activity of the sternocleidomastoid muscle, which is an accessory muscle of inspiration, increased in both groups, but the RMS slope was greater in the COPD group than in the control group, and this difference reached statistical significance (Fig. 3).
The nRMS amplitude presented in Figure 4 shows essentially the same behavior of the RMS amplitude without normalization presented in Figure 3. Overall, the behavior of changes in median frequency differed between the COPD group and the control group for intercostal muscles and trapezius muscles. The median frequency of the intercostal muscles and trapezius muscles differed from the first to the sixth minutes of the test, including for the intercept of the slope values, and was higher in COPD group. However, this did not differ significantly for the sternocleidomastoid muscle or the anterior deltoid muscles because they exhibited similar behavior. The decrease in median frequency was statistically significant for the anterior deltoid muscles in the control group and the COPD group over time from the second and third minutes of the test, respectively. Conversely, the decreases in median frequency of the sternocleidomastoid muscle for the control group and the COPD group during the 6PBRT were statistically significant over time from the fifth and third minutes, respectively (Fig. 5).
Figure 6 demonstrates the changes in oxyhemoglobin, deoxyhemoglobin, and total Hb from minute 1 to minute 6 of the 6PBRT, for the 2 studied muscle groups (respiratory: intercostal muscles; upper limb: anterior deltoid muscles). In the intercostal muscles, the change in oxyhemoglobin was significantly lower in the COPD group than in the control group from minute 2 to minute 6 of the 6PBRT. Additionally, from the third to sixth minutes of the 6PBRT, the change in total Hb was significantly lower in the COPD group than in the control group. For changes in deoxyhemoglobin in the intercostal muscles, no significant differences were found between groups (P > .05 for all). There were no significant differences in intercostal muscle Hb concentrations in the COPD group, and the control group only showed significant increases from minute 5 to minute 6 for oxyhemoglobin and total Hb, respectively (Fig. 6).

Near-infrared spectroscopy data from the intercostal and anterior deltoid muscles during the 6-min pegboard and ring test of both groups. A: Changes in blood concentration of oxyhemoglobin (ΔOxyhemoglobin). B: Changes in blood concentration of deoxyhemoglobin (Δ[HHb]). C: Changes in blood concentration of total hemoglobin (Δ[tHb]). Values are expressed as changes relative to baseline rest. * Significant difference between groups; † significant difference between minute 1 and minute 6 in the control group; ‡ significant difference between minute 1 and minute 5 in the control group; § significant difference between minute 1 and minute 4 in the control group; ‖ significant difference between minute 1 and minute 3 in the control group; ** significant difference between minute 1 and minute 2 in the control group; †† significant difference between minute 1 and minute 6 in the COPD group; ‡‡ significant difference between minute 1 and minute 5 in the COPD group; §§ significant difference between minute 1 and minute 4 in the COPD group; ‖ ‖ significant difference between minute 1 and minute 3 in the COPD group; *** significant difference between minute 1 and minute 2 in the COPD group. P < .05.
Regarding the anterior deltoid muscles, no significant differences were found between groups for changes in oxyhemoglobin, deoxyhemoglobin, and total Hb (P > .05 for all) (Fig. 6). There were similar changes in Hb concentrations in the anterior deltoid muscles over time between groups, and these values can be observed in Figure 6.
Overall, for the control group, a significant increase in oxyhemoglobin was observed during the 6PBRT in the intercostal muscles and anterior deltoid muscles, which coincided with an increase in total Hb (Fig. 6). In contrast, oxyhemoglobin for the intercostal muscles remained stable in the COPD group but increased for the anterior deltoid muscles, which coincided with stability in total Hb stability for the intercostal muscles and total Hb increase for the anterior deltoid muscles (Fig. 6). There was an increase in total Hb for the anterior deltoid muscles for both groups at the beginning of the test (minute 2), and afterwards there was stability.
Discussion
This study provides an important physiological assessment during unsupported upper limb activities in subjects with COPD in comparison to healthy controls. We report a detailed description of the electrical and oxygenation activities of inspiratory and upper limb muscles during the 6PBRT. As expected, the COPD group exhibited poorer performance on the 6PBRT, with higher ventilator demand due to higher sternocleidomastoid muscle electrical activity and lower oxygenation profiles in the intercostal muscles. Additionally, no muscle fatigue signal was observed in the inspiratory muscles in the COPD group.
The 6PBRT was performed with subjects in the seated position. Subjects kept both arms simultaneously elevated, above the shoulder level, unsupported, with constant movement that required a significant involvement of muscles fixed on the rib cage and on the neck. Additionally, 6PBRT was done in a kinetic chain, requiring a high level of motor coordination because it also involves fine hand movements. Therefore, the main muscles involved in this task are the scapular girdles and neck muscles because they are responsible for supporting the upper limbs and producing these gross movements.
In this study, we sought to verify the muscular activation and oxygenation of some of these muscles, such as the trapezius, anterior deltoid muscles, and the sternocleidomastoid muscle, which we consider to be important muscles for upper limb activities; these muscles also allow surface access techniques. We also assessed the intercostal muscles as an ventilatory muscle of breathing and we inferred imposed ventilatory demand to verify their participation in this activity. We considered assessing the diaphragm muscle, but the signal capture would not have been as easy and reliable as they are in the intercostal muscles.
We observed that the 6PBRT performance was lower in the COPD group, but the muscle activation pattern was similar between subjects with COPD and healthy subjects, despite differences in magnitude at specific moments. The RMS amplitude of the intercostal muscles was lower in COPD group, but it was similar between groups for the anterior deltoid and trapezius muscles, and there was an increase in trapezius muscle activation in the last minutes of the test in both groups. The sternocleidomastoid muscle appeared to have had greater activation in subjects with COPD, which corroborates the idea this musculature is overloaded when performing postural support and upper limb movements as well as accessory inspiratory function.2,33–35
The literature discusses the overload imposed on muscles attached to the rib cage when performing tasks with the arms elevated because they act on the movement of the upper limbs and stabilize the rib cage during ventilatory action.5 Thus, when the arms are elevated, these muscles pull the rib cage open, favoring lung hyperinflation.5
It is known that patients with COPD present lung dynamic hyperinflation, with changes in the rib cage and an increase in the anteroposterior diameter and horizontalization of the ribs, which provide a mechanical disadvantage for the diaphragm, the main inspiratory muscle.35 The unfavorable position of their length-tension curve reduces the strength-generation capacity, and therefore it is necessary to activate the shoulder girdle and upper torso muscles simultaneously for ventilatory and nonventilatory function, even though it is not in an ideal position.34–36
These issues may have contributed to lower intercostal muscle activation due to mechanical disadvantage, thus overloading accessory muscles, such as the sternocleidomastoid muscle. There was also ventilatory impairment, limiting the exercise performance of the COPD group. However, we do not have data from the diaphragm muscle to better understand this mechanism. In addition, no fatigue signal was observed in COPD group, possibly due to the free cadence of the test, where the subjects may have imposed a stable speed to move rings during the test as an intuitive, natural adjustment to prevent possible interruptions due to fatigue and dyspnea symptoms, perhaps in recognition of their own limits.
The main difference between groups that is noteworthy in relation to the trapezius muscle is related to the median frequency, which was lower in control group. The healthy subjects likely activated more low-frequency components during the exercise test, and for this reason we can infer that they recruited more type I fibers, resulting in a lower median frequency. Our findings do not corroborate those found by Meijer et al,8 who observed greater muscular effort of the trapezius muscle with different ADLs for 30 s, comparing subjects with COPD to healthy controls. It is possible that performing the 6PBRT in a sitting position and with arm elevation only 20 cm above the shoulder level did not promote greater activation of the trapezius muscle at the beginning of the test, whereas the ADLs described in the study by Meijer et al8 provided higher muscle effort.
Previous studies have reported that individuals with COPD have preserved endurance and oxidative capacity in the deltoid muscle because it is a muscle directly involved in ADLs that requires elevating the shoulders.11,37 Meijer et al8 did not observe differences concerning muscle effort for the deltoid muscle between subjects with COPD and control subjects for ADL performance because individuals with COPD perform arm activities at lower intensity. Overall, the RMS amplitude of the anterior deltoid muscles to perform the 6PBRT was similar between the groups; in this regard, our findings are in agreement with both of these previous studies. However, a decrease of > 4% in median frequency of the anterior deltoid muscles during the 6PBRT was observed in both groups, which, according to Saey et al,38 suggests muscle fatigue and a contracting profile with progressive recruitment of type I fibers, which may have been due to the characteristic demand of the test.
The control group showed better mechanical efficiency of the upper limb muscles compared to subjects with COPD, although both groups showed similar upper limb muscle mass, electrical activity, and oxygen supply to obtain the best performance measure. The intercostal muscles presented lower activation in the COPD group than in the control group, as well as the worst oxygenation and blood supply because they presented lower values of oxyhemoglobin with similar extraction compared to control subjects, as shown by similar total Hb values in both groups. However, poorer intercostal muscle performance and higher ventilatory demands were probably limiting factors for 6PBRT in the COPD group.
Other interesting data from the intercostal muscles were the lower median frequency values obtained in the control group compared to the COPD group, despite the higher electrical activation, probably indicating the use of type I fibers to perform the test, which require oxygen and are more resistant to fatigue. Even though previous studies suggest the fast-to-slow transformation in parasternal muscles of subjects with COPD (ie, a higher proportion of type I fibers39,40), the behavior of high median frequency and low amounts of oxyhemoglobin reaching the intercostal muscles observed in our COPD group suggests that, due to a lack of oxygen, type II fibers are recruited more and anaerobic metabolism prevails.
Our sample was comprised of subjects with COPD of moderate, severe, and very severe air-flow limitation, and it would be interesting to increase the sample for each classification to investigate potential differences in outcomes as a result of disease severity. In addition, the arguments put forward in this study are generalizable for patients with COPD with hyperinflation during the test, even though hyperinflation was not assessed in this study. Despite knowing that more severe classifications of air-flow limitation have greater ventilatory limitations and more chance of lung hyperinflation,41 objective measures of pulmonary hyperinflation need to be obtained from this population to confirm if the worst performance in the 6PBRT has an association with this condition.
Finally, some methodological limitations should be addressed. The regional variability of each muscle's characteristics in relation to electrical activity and oxygenation was not ensured because our measurements were collected from a single site over the muscles. Additionally, we observed a huge variability of the data, possibly due to spatial heterogeneity of the muscle in dynamic contractions. Although widely used for normalizing the sEMG signal, maximum voluntary contractions have the disadvantage of being dependent on motivation, and it is difficult to determine if the effort was truly maximum.
However, Reilly et al42,43 found that maximum inspiratory pressure was a reliable method to normalize sEMG signals from the parasternal muscles, and Cardoso et al44 used a similar maneuver to normalize the sternocleidomastoid muscle.45 We chose the submaximum voluntary contractions to normalize signals from the trapezius and the anterior deltoid muscles because, according to Burden,46 they can be as reliable as those from maximum voluntary contractions.47 Further, during maximum voluntary contractions or submaximum voluntary contractions, the contraction was isometric, whereas during the test it was dynamic. Therefore, we present the data with and without normalization, consistent with methods that are commonly reported in the literature. We used Fourier analysis to derive the frequency content of sEMG data, despite knowing that it should be applied to stationary signals and that, during dynamic contractions (non-stationary), other analyses must be performed. Although the Fourier analysis is a simpler, faster technique and provides initial information, these data should be interpreted with some caution.
Conclusions
This study indicates that the 6PBRT was performed at higher electrical activity in the accessory inspiratory muscles, such as sternocleidomastoid muscle, and at a lower oxygenation profile in the intercostal muscles by subjects with clinically stable COPD when compared with healthy controls paired by age and gender; however, neither group showed signs of muscle fatigue. These findings suggest that the higher ventilatory demand found in subjects with COPD may contribute to poorer performance in this group, without any signs of peripheral muscle limitation.
Footnotes
- Correspondence: Ivanize Mariana Masselli dos Reis PT MSc, Rodovia Washington Luiz, KM 235, Laboratorio de Espirometria e Fisioterapia Respiratoria, CEP 13565-905, São Carlos, SP, Brazil. E-mail: nizemmr{at}gmail.com.
This work was supported by scholarships from the Coordenação de Aperfeiçoamento de Pessoal de nível Superior (CAPES).
Supplementary material related to this paper is available at http://www.rcjournal.com.
- Copyright © 2020 by Daedalus Enterprises


