

Abstract
Critical illness can threaten the adequacy of O2 delivery or CO2 excretion. Monitoring seeks to identify the adequacy of oxygenation and ventilation and to detect deterioration early. Advances in oximetry, capnography, and transcutaneous CO2 monitoring offer new opportunities for more accurate estimation of gas exchange, noninvasive monitoring of parameters previously not amenable (eg, total hemoglobin measurement), detection of disease, and prediction of fluid responsiveness.
Introduction
Critical illness often threatens the adequacy of O2 delivery or CO2 excretion. Gas-exchange failure can threaten survival in mere minutes. Monitoring seeks to identify the adequacy of oxygenation and ventilation and to detect deterioration early, so as to avert further deterioration. Historically, arterial blood gas analysis carried this burden, but these analyses provide only intermittent data, require several minutes to yield information, and depend on the presence of an invasive catheter. Increasingly, critically ill patients, even those with shock or respiratory failure, are cared for without an arterial catheter.1 Substantial practice variation across ICUs in the United States suggests either a skepticism about the value of arterial catheters or an increasing reliance on alternative means of monitoring.
Technological progress increasingly offers methods for monitoring gas exchange that provide results that are near real-time and are noninvasive. Pulse oximetry has been ubiquitous in ICUs for decades, but novel approaches open an estimated total hemoglobin (Hb) concentration, arterial O2 content, and fluid responsiveness of the circulation. Surrogates for the arterial partial pressure for CO2 ( ) are increasingly used, such as end-tidal carbon dioxide pressure measured with capnography (
 ) and transcutaneously measured partial pressure of CO2 (
 ).2 This article reviews the current state of noninvasive monitoring of O2 saturation, Hb concentration, fluid responsiveness, and
  in the critically ill.
Pulse Spectroscopy
Conventional pulse oximetry relies on the fact that hemoglobin is the dominant chromophore at red and infrared wavelengths. Using only 2 wavelengths, this allows relatively accurate determination of oxyhemoglobin and deoxyhemoglobin fractions and estimation of the O2 saturation of hemoglobin as measured with pulse oximetry ( ). A limitation of 2-wavelength technology is that it can be confounded by other substances that absorb red and infrared light, such as dyshemoglobins, melanin, bilirubin, and nail polish.3 In addition, changed optical path length (eg, due to tissue edema), poor skin perfusion, low pulse volume, patient movement, alterations in venous blood volume related to breathing, and contamination from ambient light have the potential to reduce the accuracy of pulse oximetry.
With additional wavelengths (ie, pulse spectroscopy), more light-absorbing substances can be detected and quantified.4 Devices equipped with ≥ 7 wavelengths can estimate methemoglobin and carbon monoxide satura-tion in addition to oxyhemoglobin and deoxyhemoglobin (Table 1). Moreover, by measuring nearly all hemoglobin species, total Hb concentration can be estimated. For example, when sodium nitrite infusion was used to produce methemoglobin, pulse spectroscopy succeeded in quantifying the methemoglobin concentration with low bias (0.36%) and acceptable limits of agreement.5 Coexisting hypoxemia produced more bias. Similarly, when carboxyhemoglobin was induced using carbon monoxide rebreathing, pulse spectroscopy determined carboxyhemoglobin accurately.5 In some patients with clearly elevated carboxyhemoglobin levels, however, the technology failed to detect the presence of carbon monoxide.6 Validating pulse spectroscopy as a means to detect carbon monoxide poisoning in the field is challenging because blood values change rapidly, but this approach is promising.7
Potential advantages of multiple-wavelength oximetry
Over the past decade, the costs and harms of blood transfusion have received increasing emphasis.8,9 At the same time, serial phlebotomy has come under fire with the recognition that it causes substantial blood loss in the critically ill. A noninvasive tool to gauge total Hb concentration could reduce blood sampling while also detecting hemorrhage or the need for transfusion. In a surgical ICU population, pulse spectroscopy correctly measured Hb concentration with a Bland-Altman bias of zero and good limits of agreement, while also detecting trends in Hb concentration.10 In a group of subjects undergoing high-predicted blood loss neurosurgery, values of Hb as measured with spectroscopy were accurate, were effective in detecting changes in Hb concentration, and reduced both the number of transfusions and the time to transfusion compared with a control population managed without pulse spectroscopy.11 On the other hand, in subjects with gastrointestinal hemorrhage, Hb as measured with spectroscopy was often inaccurate (bias 1.0, limits of agreement −2.7 to 4.7).12 Inaccurate values (ie, > 15% discrepancy) were seen in more than half of all subjects and often would have prompted inappropriate transfusion. Norepinephrine infusion was associated with inability to yield any measurement; overall, measurements were unavailable 19% of the time. In a meta-analysis of 42 studies, accuracy of Hb as measured with spectroscopy was acceptable (bias −0.27, 95% limits of agreement −0.44 to −0.10).13 These results suggest that noninvasive determination of Hb concentration is practical and may be useful in guiding transfusion. As a tool to detect hemorrhage, Hb as measured with spectroscopy suffers from another problem: acute bleeding has little immediate impact on Hb concentration. Even when bleeding causes life-threatening hypovolemia, there may be little change in Hb concentration until intravenous fluids are infused. By combining Hb as measured with spectroscopy and an estimate of fluid responsiveness, pulse spectroscopy could become a more effective tool.
Predicting Fluid Responsiveness
Recognizing and treating hypovolemia has long been a central tenet of ICU management. Mounting evidence also implicates hypervolemia as a contributor to adverse outcomes.14,15 Identifying patients who are likely to respond to fluids and those who are not is a daily challenge in the ICU. Yet predicting fluid responsiveness is not a trivial task. Historically, clinicians have used static hemodynamic values (eg, central venous pressure or pulmonary artery occlusion pressure) to judge whether fluids are likely to augment circulation, yet these measures have almost no ability to distinguish fluid responders from nonresponders.16,17 In contrast, dynamic indices, most of which rely on the interaction of breathing and the circulation, are far more accurate.18 Cyclic changes in pleural pressure during breathing induce fluctuations in right heart filling, pulmonary venous volume, and both right- and left-ventricular afterload that produce variation in stroke volume, systolic blood pressure, pulse pressure, and venous pressures. In most patients, the respiratory impact on right-ventricular preload dominates to account for variations in stroke volume: this means that respirophasic variation in circulatory parameters typically signals a fluid-responsive circulation.19
The pulse spectroscopic signal is composed of baseline absorption (termed DC) and a component that varies with the pulse volume (termed AC). The DC signal is affected by blood volume, nonhemoglobin chromophores in the tissue, scattering, motion, and respiratory effects on venous pressure.3 This absorption is generally considered noise, but signals due to venous variation could be analyzed to yield breathing frequency or to indicate fluid responsiveness. Phasic changes in the AC component are more directly related to pulse pressure and, like pulse pressure variation, can predict fluid response. In one study, plethysmographic variation was compared to pulse pressure variation, central venous pressure, and pulmonary artery occlusion pressure to predict the subsequent response to fluid loading. Plethysmographic variation was as accurate as pulse pressure variation (both with area under the receiver operating characteristic curve = 0.94), while both central venous pressure and pulmonary artery occlusion pressure were not.20
Interactions between breathing and the circulation are complex, however, and depend on a host of factors in addition to the intravascular volume status. For example, respiratory effort, tidal volume, abdominal pressure, cardiac dysrhythmias, and the presence of acute right-ventricular dysfunction all can affect variations in plethysmographic volume. These factors threaten the validity of predictors of fluid responsiveness in most patients.21 Teasing out a clinically useful signal from plethysmographic data are likely to present a formidable challenge.
Pulse Spectroscopic Artifacts
Advances in pulse spectroscopic technology, including multiple wavelengths, have the potential to reduce artifact and increase accuracy. Although manufacturers claim to be accurate for  within 2%, critical illness may introduce errors. In a study comparing 2 devices, while the overall bias was only 1.4%, hypoxemia and elevated blood lactate were associated with greater error.22 Moreover, the 2 oximeters did not behave identically. Light scattering within tissue and optical path length vary between patients and can change with time during the course of illness. This means that oximeters must be calibrated by each manufacturer using healthy volunteers, and this risks error when extrapolating to illness. Because scattering and optical path length also change with wavelength, a greater number of wavelengths could lead to enhanced accuracy and stability. Strides have also been made in lessening motion artifact.23
Future Directions
Multiple-wavelength pulse spectroscopy holds great potential, especially with regard to estimating Hb concentration and reducing artifacts and alarms. Alarm fatigue remains a huge challenge in the ICU, and oximetry contributes to this fatigue. The potential to discern cardiovascular metrics also offers promise, but this will be a more formidable challenge.
Capnography
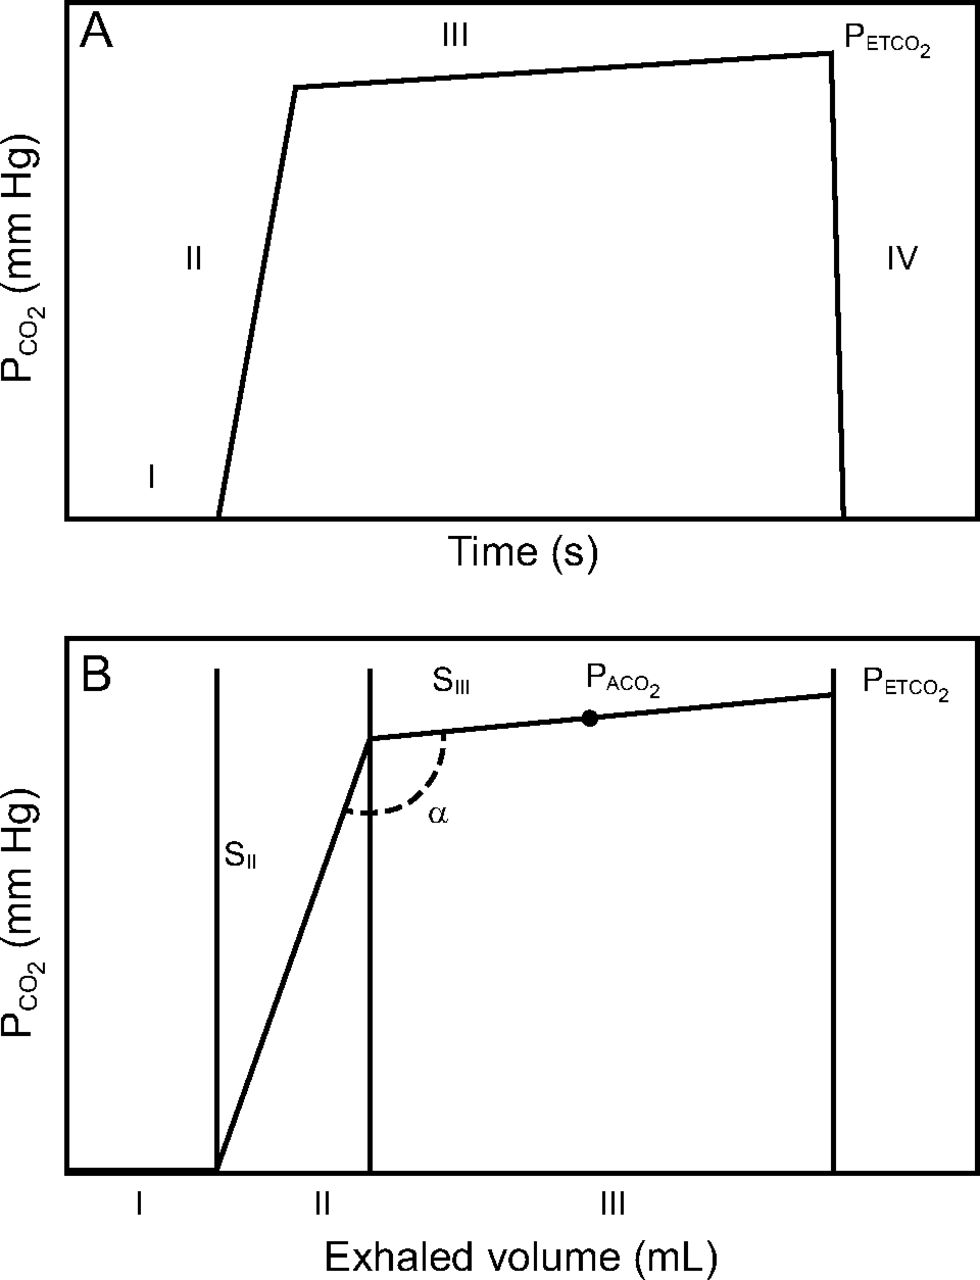
Capnography is the measurement and display of the partial pressure of CO2 as a function of time (time capnography) or of exhaled volume (volume capnography) (Fig. 1). Time capnography is now available in most ICUs and increasingly accompanies rapid response and resuscitation teams. Time capnography may serve to detect airway loss, endotracheal tube malposition, apnea, return of spontaneous circulation during resuscitation, and adequacy of ventilation; it also may predict fluid responsiveness.24 Volume capnography is less widely used, is more complex, and requires an in-line sensor.25

A: Time capnogram. B: Volume capnogram. I, II, III, and IV represent different phases of the capnogram. α = angle between phases II and III;  = partial pressure of end-tidal CO2; SII = slope of phase II; SIII = slope of phase III. From Reference 24, with permission.
Capnography as a Surrogate for  .
.

In the ideal lung, where ventilation and perfusion are well-matched and all alveoli are identical, mean alveolar-arterial partial pressure for CO2 ( ) equals
  . Because breathing is phasic, the instantaneous
  varies around its mean, falling as fresh gas enters the alveoli and rising throughout expiration, whereas the
  does not vary significantly with respiration. Moreover, there is no way to measure or display the mean
  value using time capnography. Even more importantly, real lungs are not ideal, especially in the presence of lung disease, and exhibit wide variation in ventilation-perfusion matching.2 For these reasons, the end-tidal pressure of CO2 (
 ) is often substituted for mean
  to approximate the arterial value. This approximation is error-prone, however, and even more so in the presence of lung disease when accurate estimation of ventilation adequacy is most important.26 The average bias between
  and
and  is roughly −6 (
 being higher) with a very large spread of values in both directions (Table 2).27-36 Although capnography itself measures CO2 accurately, end-tidal values should generally not be substituted for arterial values.
 versus
Not only do  and
and  often correspond poorly, but they often do not move in parallel when ventilator settings are changed or when patients make the transition from passive ventilation to active weaning (Fig. 2).37 Discrepancies are especially seen in patients with parenchymal lung disease.38 This may relate to changes in expiratory time, ventilation-perfusion matching, dead space fraction, or perturbations from steady state that occur when ventilator settings are altered or patients assume control of breathing. As an example, raising the ventilator rate or tidal volume should lower both
  (because it tends to raise the ratio of alveolar ventilation to CO2 production) and
  , but if dead space rises, as is common in severe air-flow obstruction,
  may fall even as
  rises.

Correlation between changes in  and
and  in subjects who were mechanically ventilated. Although there is a modest correlation, there are many points of discrepancy, sometimes with values changing in opposite directions. From Reference 37, with permission.
Subtle variations in the shape of the capnographic waveform encode physiological information and, in theory (especially using volume capnography), could provide clinically relevant clues to disease.39 For example, when the lung is healthy, phase 2 rises steeply and transitions sharply to a gradually rising phase 3. In diseases characterized by substantial mismatching of ventilation and perfusion, such as COPD, phase 2 rises more gradually, the transition to phase 3 is slurred, and phase 3 rises more steeply than usual.40 In patients with pulmonary embolism, phase 3 rises less than normal or may even fall, and this, combined with an elevated gradient between  and
and  , may provide a diagnostic clue.41 Dead space fraction, obtainable using volume capnography, has also been proposed as a target for PEEP titration in patients with ARDS.42,43 This could be especially valuable, for example, in the morbidly obese for whom PEEP selection is particularly challenging.44,45
Capnography to Detect Return of Spontaneous Cir-culation.
Exhaled CO2 derives from blood flow to the lungs so that changes in cardiac output produce transient changes in capnographic values. In steady state, exhaled CO2 bears no relationship to cardiac output, but changes, such as due to the return of spontaneous circulation, are typically signaled by a clear rise in the  .46,47 The values of
  at the onset of chest compressions have some value for predicting whether return of spontaneous circulation will be achieved, presumably because they relate to how effectively compressions are generating blood flow, although current guidelines discourage using this in isolation to terminate resuscitation attempts.48
Capnography as a Predictor of Fluid Responsiveness.
Passive leg raising shifts blood from the lower extremities to the central circulation. When the circulation is fluid-responsive, this shift temporarily raises venous return, bringing more CO2 to the lungs, and boosting  temporarily. If
  rises by > 5% with passive leg raising, a fluid bolus is very likely to raise cardiac output.49,50
Transcutaneous

CO2 produced in the epidermis diffuses toward the atmosphere, offering another view of  values. Skin CO2 sensors are modified pH electrodes that respond to skin CO2 by generating an electrical potential relative to a reference electrode. An important technological step was to incorporate a heating element into the sensor to raise skin temperature to 42°C, which enhances both blood flow and CO2 diffusion. Because skin
  generally exceeds blood
  , transcutaneous CO2 monitors subtract this presumed gradient, add a time-based correction for electronic drift, and thereby approximate
  .
.
Modern  devices are quite accurate in approximating
  . As an example, in a series of postoperative subjects, the bias between
  and
and  was only −1.2 mm Hg (
 being higher than
  ).51 Performance did not appear to be affected by dark skin, gender, vasoactive drug infusion, or peripheral perfusion. In another study of diverse ICU subjects, the bias was −0.2 mm Hg.52 Changes in
  and
and  over time were well-correlated. Many additional studies have confirmed the accuracy of transcutaneous
  for estimating
  , although when skin perfusion is severely impaired by shock or vasoactive drug therapy,
  may be an unreliable surrogate for
  (Table 3).53-65
 versus
One limitation of transcutaneous  measurement is the time lag of several minutes between changes in
  and detectable changes in the skin. Nevertheless, the trend away from arterial catheter use in mechanically ventilated patients suggests that clinicians may increasingly look to noninvasive surrogates for the
  .
.
Conclusions
Capnographic monitoring is likely to eventually become the standard of care for critically ill, mechanically ventilated patients. Although shape characteristics could, in theory, yield clinically useful information, the complexities of changing ventilator settings, patient–ventilator interaction, and rapidly changing conditions in the critically ill suggest that capnographic interpretation will remain limited to the end-tidal value for the foreseeable future.  monitoring is positioned to be used more broadly if the trend toward less invasive monitoring continues.
Discussion
MacIntyre:
Greg, that was terrific. You didn’t get into it in detail, and I understand in 30 minutes you’re restricted, but there’s a lot of interest in looking at tissue PO2 and PCO2, particularly in the brain, with a noninvasive monitor. Any thoughts as to whether that has a future?
Schmidt:
I haven’t used it clinically or studied it, so I can’t say very much about that. Obviously, our global monitors have limitations for whatever reason, blood pressure, perfusion, oxygenation. Being able to identify end-organ function oxygenation would be important. We’re getting increasing numbers of patients on ECMO, a setting for which brain oxygenation might be different than what you measure in an arterial catheter, especially where there’s the so-called Harlequin syndrome, in which there’s deoxygenated blood coming from the heart. I can imagine settings in which that would be of value. Also, one of the limitations of putting something on your finger is that it’s far away from what’s happening elsewhere. One of the advantages of looking at the earlobe or other cerebral measurements of oxygenation is that they’re closer to the center of circulation; time lags are less. I’d have to spend more time with it to give you any sense of what it’s future might be.
Branson:
The BOOST III trial1 is about to start, which is the third trial of using brain tissue PO2 as a target for subjects with head injury. The BOOST II trial was underpowered and failed to show important outcome differences.2 You didn’t mention this idea of the oxygen reserve index, which is a new monitoring technique that looks at both arterial and venous oxygenation to detect hyperoxia, and also predict impending hypoxia. Lastly, I’ll just comment that it is always frustrating for me, that the same physicians who say, ‘don’t put in an A-line, those are dangerous’ are the same people who have no problem drilling a hole in the skull and putting a probe blindly into the brain to measure brain tissue PO2. Or putting in an ECMO catheter as big as my index finger into the central circulation. I just wonder why? Maybe A-lines encourage too many blood gases, but I find that in some patients an arterial line to be invaluable. New residents in particular don’t ever want to put them in. I don’t know if that’s the experience of the rest of the group.
Schmidt:
I’ll respond to the third comment first: a lot of people have the frustration you expressed which is that there is a huge practice variation. I think there’s some intelligence in that, however, and I hear what you’re saying but our colleagues are voting with their feet in terms of not placing arterial lines. There’s something about a noninvasive monitor or the limitations in translating the invasive values into practice that have led them to say – it’s not just new trainees who don’t know any better but have led our colleagues to say “I don’t need these things.”
Walsh:
I had a question about O2 content. Being able to measure oxygen. saturation and hemoglobin, you basically have O2 content so we’re only missing cardiac output when it comes to O2 delivery. Have you seen any studies in your review that may actually lead us to believe that it may be better care?
Schmidt:
To be able to measure content rather than saturation? Knowing hemoglobin and changes over time does add a whole lot of extra information. I think the question is really about hemoglobin and changes related usually to bleeding, although to other things as well, that can potentially improve care. Hemoglobin values in isolation have a very important limitation that is underappreciated. If I put in one big ECMO cannula and exsanguinate myself here in front of the audience and compare the hemoglobin concentration in the first drop that comes out and the hemoglobin concentration in the final drop, those values are the same even though I’ve hemorrhaged myself to death. And so, looking at hemoglobin in isolation as a way to detect bleeding is fundamentally limited by the fact that hemoglobin doesn’t change over short periods of time so we need something else, which is the other thing you alluded to, which is adequacy of cardiac output. That’s where things like the fluid responsiveness of circulation could be an added safeguard to say that the combination of a not-changing hemoglobin and non-fluid responsiveness of circulation could be a better metric.
Walsh:
A lot of people use oxygen saturation in isolation and it drives me a little bit crazy because they don’t take into consideration O2 delivery from that perspective. The last question I have for you is, did you see any data on counting breathing frequency by pulse oximetry and some of those waveforms you were talking about earlier? I see a lot of people trying to use pulse oximetry for more than just O2 saturation.
Schmidt:
Yes, you can deduce breathing frequency. The data are reasonably good, you can do it through different ways, one is venous changes that have an impact on the respiratory signal but there also are the arterial pulse volume changes. That varies from patient to patient so there are some limitations in the ability to detect respiratory rate accurately, and noise is an issue, but you can deduce the breathing frequency. We already have multiple measures of frequency in ICU patients so to me, at least in my patient population, it doesn’t add a whole lot because I already have at least 2 values for breathing frequency and I’m not sure I need a third.
Pham:
What about signal quality depending on the temperature of the patients, blood pressure, or anything that would lead to constriction? Have you seen any evidence of difference in pulse oximetry based on whether it’s on the finger, forehead, or ear just to try and ascertain what is the best quality of acquisition?
Schmidt:
That’s a good question because peripheral circulation where we tend to put traditional pulse oximetry is also the area where we do a lot of temperature regulation and vasoconstriction. So, just the areas where we’re measuring, when compromised, may compromise the accuracy of total hemoglobin measures or oxygenation measures. That’s the limitation of extremity oximetry. Central circulation has advantages in that the cerebral vessels are not as affected by vasoconstriction in those settings and as I said earlier the perfusion of something like the forehead is a much shorter stretch from the central circulation so there’s less of a time lag. So, yes there are, in at least some studies, more accurate values from the forehead than from the fingertips in those kinds of challenged settings.
Piraino:
Just a comment. The pulse pressure variation that can be displayed on many ICU monitors has become less useful in the age of low tidal volume ventilation, mostly in passively breathing patients. If they have no cardiac arrhythmias and they’re passive, a tidal volume challenge as described by Myatra et al,3 can be performed. After increasing tidal volume up to 8 mL/kg for 1 minute if the pulse pressure variation increased by 3.5% this would predict fluid responsiveness with very good sensitivity and specificity. We’ve discussed this during our weekly mechanical ventilation rounds. If you bring up the value on your monitor and it’s higher than 12% – as you mentioned the threshold is 13% they’re probably fluid responsive, and the tidal volume challenge is not necessary. But as the Myatra paper suggests in its algorithm, if it’s below 9% you should consider increasing tidal volume to see if the pulse pressure variation changes to suggest fluid responsiveness.
Schmidt:
Nice point and I like to show the Myatra trial3 because the receiver operator characteristic curves are so nice but there were several important preconditions for validity in that trial, and remember this is a heart-lung interaction and so the impact on the circulation depends on the input to the respiratory system. A very small tidal volume has only modest impact on the circulation, and in the era of low tidal volume ventilation that is a limitation. In one survey in French ICUs4 that went around and looked for all of these preconditions for validity, at least 8 mL/kg tidal volume, passive patient, regular cardiac rhythm, no acute cor pulmonale, no abdominal compartment syndrome. By the time you go through all that I think they were down to 2% or 4% of patients who actually qualified to have the preconditions for validity. But I think that paper is unduly pessimistic, because in many patients it’s possible to either do an intervention or make them more passive and passivity was one of the dominant limitations. I can turn the tidal volume up, I can often make my patients passive so I think I could produce, such as by the intervention you suggested, a more passive patient and a more reliable substrate for judging pulse pressure variation. Your point is a good one, that value is up on the screen even when the preconditions for validity aren’t met and that value is being populated into the electronic medical record with no one validating whether that patient passive or active.
Blanch:
My question is about the partitioning of dead space on their anatomical and alveolar values. Do you believe the precision on getting the best PEEP together with other predictors could be maximized by using the physiologic dead space components at the bedside?
Schmidt:
This is a good question. Over time one could have picked many different PEEP metrics and believe that they could change practice. And if you’ve been around long enough, this goes back to Suter in 1977,5 a long while back, and some of us have been through this multiple times, whether it’s esophageal pressure measurements or what have you. I’m a bit of a skeptic on those grounds, but potentially putting various measures together might lead to a rational approach. Probably too hard for regular medicine.
Goligher:
I’ve always thought that there was a compelling physiological basis for using dead space to titrate PEEP, but in the studies that have used it a significant limitation is the time required to reach steady state. You can’t really do a decremental PEEP trial if you have to wait 10 min after every PEEP change in order to reach a steady state for your dead space measurement. I wonder if you would comment on that, how long do you believe you need to wait to reach steady state? Is there a way to accelerate that a little to make it more practical?
Schmidt:
I’m not sure. There are some studies showing rather rapid – there are probably multiple components of time response, very short that can be measured in a matter of a couple of minutes and others seem to be much longer and measured in hours. I guess it depends on what you’re looking at, but I don’t know what that time frame is. There’s another fundamental challenge, which is that we’re on a planet with gravity and therefore transpulmonary pressures vary with distance up and down the lung that we can’t get around. Therefore, every PIP or PEEP will always be a balance between under-recruitment and over-distension, and there’s no way to ever get around that. I’m not sure dead space or any other particular measure can help us with that right now.
Goligher:
What’s striking about dead space measurements is that you see a very clear optimum develop during progressive titration, similar to variation in mechanics. There was one paper in Respiratory Care6 a few years ago where consistently across multiple subjects they observed that optimal dead space was reached. The factors that drive dead space makes it a compelling way to potentially capture the combination of recruitment and regional overdistension that results in an increase in dead space. You don’t think that the dead space can reflect both of those competing mechanisms?
Schmidt:
I do think it does reflect those competing mechanisms. But whether it can identify the right sweet point in the middle, I think is separate from issues of time lag. When PEEP is changed, there are superimposed changes in circulation and the dead space fraction that take multiple cycles through the circulation to reach equilibrium, and that takes time. There’s no way around that fundamental limitation. Changing PEEP is a very complex intervention, and I’m just afraid that anything that takes us 30 minutes at the bedside to try and get a measurement in a disease that could be evolving within the time frame on that order is just fundamentally not real world.
Footnotes
- Correspondence: Gregory A Schmidt MD, Internal Medicine, Division of Pulmonary Diseases, Critical Care, and Occupational Medicine, University of Iowa, 200 Hawkins Drive, C33-GH, Iowa City, IA 52246. E-mail: gregory-a-schmidt{at}uiowa.edu
A version of this paper was presented at the 58th Respiratory Care Journal Conference, held June 10–11, 2019, in St Petersburg, Florida.
The author has disclosed no conflicts of interest.
- Copyright © 2020 by Daedalus Enterprises


