

Abstract
Predicted values for pulmonary function tests differ significantly from the reference values used for many other diagnostic tests. Historically, simple equations using age, height, and sex were used to “predict” normal lung function. However, these multiple factors interact in complex ways to determine what the expected lung function values are in healthy subjects. Healthy individuals exhibit a wide range of variability for most pulmonary function variables, and this variability is not consistent across all age ranges. Recent analysis of large groups of healthy subjects has allowed the development of sophisticated prediction models that take into account not only variability but also skew that occurs as the lungs develop and mature. These modern reference equations provide uninterrupted expected values from early childhood, through adolescence and adulthood, and extending into the ninth decade. Modern equations use upper and lower limits of normal to offer a statistically robust means of defining who is within normal limits. Despite these advances, interpretation of pulmonary function test results has not been highly standardized, largely because interpretation depends on the reference equations used and, more importantly, how they are applied. This review discusses the strengths and limitations of using reference equations to interpret pulmonary function data in the context of research and clinical practice.
- pulmonary function tests
- lung function tests
- statistical data interpretations
- reference ranges
- normal range
- spirometry
The general tendency in pulmonary function testing at the clinical level is toward cautiously noncommittal overinterpretation in language replete with modifiers that assign degrees to the disturbances of function thought to be present.1
Introduction
John Hutchinson is commonly credited with inventing spirometry in the middle of the 19th century and coining many spirometry terms such as vital capacity, that are still used today.2 Hutchinson worked in conjunction with insurance companies and created tables of expected values for vital capacity. He observed that there was a linear relationship between vital capacity and height, and that it declined with age. One hundred years later, vital capacity was still being measured with water-filled spirometers, but there was an increasing interest in predicted values for lung function. Dr Ross Kory convinced the United States Veterans Administration to allow him to test inductees who provided a large convenience sample of supposedly healthy young adults. He published his findings in 1961 in the form of a nomogram that allowed users to connect height and age scales to read predicted values for vital capacity, along with FEV1 and maximum voluntary ventilation.3 Along with the linear equations on which the nomogram was based, the standard error of estimate for each of the variables was reported. However, few researchers or clinicians utilized the standard error of estimate for determining the limits of normal, rather preferring fixed limits such as 80% of the predicted value. Kory's population included smokers and nonsmokers; the data were collected before the 1964 Surgeon General's report on the hazards of smoking. In 1971, James Morris and co-workers published predicted values in the form of a nomogram based on a large population of nonsmokers in Oregon to provide a more representative sample of “normal” lung function.4 These two reference equations were very popular at the time but could only be used for adults.
Reference equations for pediatric and adolescent patients were available from various authors, but patching pediatric and adult reference equations together resulted in discontinuities as individuals transitioned from adolescence to adulthood. The schema of comparing a patient's measured value to a “predicted” value has been extended to most lung function parameters, including the diffusing capacity of the lung for carbon monoxide (DLCO) and static lung volumes. Although many studies of predicted values were published in the last half of the 20th century, most were limited in their generalizability because of age, sex, or ethnicity of the population measured. Standards for equipment and testing protocols promulgated by the American Thoracic Society (ATS) and European Respiratory Society (ERS) have been in place for more than 30 years and have resulted in more reproducible data within and between laboratories. Interpretation of pulmonary function test results has not been highly standardized, largely because interpretation depends on the reference equations used and, more importantly, how they are applied. This review will discuss the strengths and limitations of using reference equations to interpret pulmonary function data in the context of research and clinical practice.
Lung Function as an Indicator of Lung Health (Inverse Modeling)
Inverse modeling is a process that uses performance characteristics to construct a model. In respiratory medicine, we use pulmonary function testing and physiologic recordings to predict the health of the lungs.5 Hutchinson’s novel observation that low lung volume could predict anatomical disease (eg, lung fibrosis associated with tuberculosis) is perhaps the earliest use of functional measurements to predict lung health in respiratory medicine.6 Inverse modeling requires some knowledge of the model. Collecting physiologic data from normal subjects provides information that can be used to create a model. For example, if it is known that the typical 10-year-old child has a vital capacity of 2.2 L,7 a recorded value of 1.5 L would result in the construct of an underdeveloped or diseased lung. Additional information, such as a lower than expected FEV1/FVC ratio, improves the accuracy of the model (eg, narrowed airways and air trapping). The accuracy of our knowledge regarding the relationship between lung function and lung health is therefore integral to our ability to construct accurate models of lung health (or disease), both for individuals and populations.
Why Do We Need Reference Equations?
During a person’s life span, the lungs experience periods of rapid growth, a period of stability, then a senescent decline in function. In addition to age, lung function is affected by sex, ethnicity, and the size of the thorax. Because there is no standardized and easy way to measure the size of the thorax, height is used as a proxy. In addition, because multiple variables affect lung size and function, reference equations are relied upon to create a reasonable idea (ie, a prediction) about the patient’s lung health. The central assumption is that lung function recorded from nonsmoking subjects without known pulmonary disease will help discriminate between normal and diseased lungs in patients. However, lung function indices such as spirometry or DLCO may not always discriminate between health and disease (see the Can Disease Be Present If the Pulmonary Function Test Is “Normal”? section).
Limitations of Reference Equations
For research involving lung function, the predicted values that represent health should be generalizable. That is, the predictive values should be based on a population similar to that being evaluated. A common example of when this principle is violated is the use of predicted values for white individuals when working with a population that includes significant numbers of non-white individuals.8 Table 1 describes some of the problems associated with reference equations, either in how they are derived or how they are applied in a research or clinical setting.9-11
Common Limitations of Predicted Equations for Pulmonary Function Tests
A common problem plaguing some reference equations is the failure to account for changes in variability across a range of ages (eg, lung function is more variable in children than in adults). Recent studies using the Generalized Additive Model of Location Shape and Scale (GAMLSS) statistical technique have demonstrated that variability is not constant and must be accounted for when pulmonary function tests are interpreted.12 The GAMLSS technique is an extension of linear regression, which allows for nonlinear modeling of the relationship between lung function and age (or height), and allows for the nonuniform variability of the outcome (eg, for the variability to change with age or height). Finally, the technique applies a transformation to the distribution (Box-Cox transformation) to approximate the normal distribution. Figure 1 shows an example of how the fifth centile (ie, the lower limit of normal [LLN]) for FEV1 and FVC varies with age. When the LLN is expressed as a percentage of the predicted value, it becomes apparent that the fifth centile is only equivalent to 80% of predicted for males and females in the 20–40-y age range.

The lower limit of normal (fifth centile) expressed as a percentage of the predicted value. LLN = lower limit of normal, From Reference 7, with permission.
If research or epidemiologic studies use fixed cutoffs for inclusion or exclusion of subjects, or if fixed cutoffs are used to determine prevalence of disease, there is risk of introducing age-related bias to the study.13 A similar problem occurs when fixed cutoffs are used to interpret whether an individual patient's pulmonary function test is normal.
What Is Normal?
A logical approach to defining normal is based on what can be expected from summarizing measurements from a group of a normal population. If the data collected from healthy subjects are normally distributed, the mean or median value will be at the center of a bell curve (Fig. 2). The mean or median value is also referred to as the “predicted” value. Often the predicted value is described as 100% of predicted, implying perfect health; however, the predicted value is perhaps better described as the 50th percentile because humans (and their lungs) are of many shapes and sizes, such that there is a spread of values around the average value that represents the normal population. The spread of values around the mean is usually expressed as the coefficient of variation, which is simply the standard deviation (SD) divided by the mean expressed as a percentage. The application of the GAMLSS technique allows us to obtain a simple summary of the predicted value, the coefficient of variation, and any skewness across all ages, given an individual’s height, sex, and ethnicity. For example, a coefficient of variation of 10% equates to a range of 80–120% of the predicted value. This widely used limit of “normal” assumes that the coefficient of variation is 10% for all subjects and for all pulmonary function variables. However, as shown in Figure 3, the coefficient of variation for DLCO (TLCO) in healthy subjects is more variable than the FEV1.14 In addition, the coefficient of variation changes with age, with greater variability in young children and older adults. The Global Lung Function Initiative (GLI) reference equations for spirometry and DLCO are based on this approach.7,14
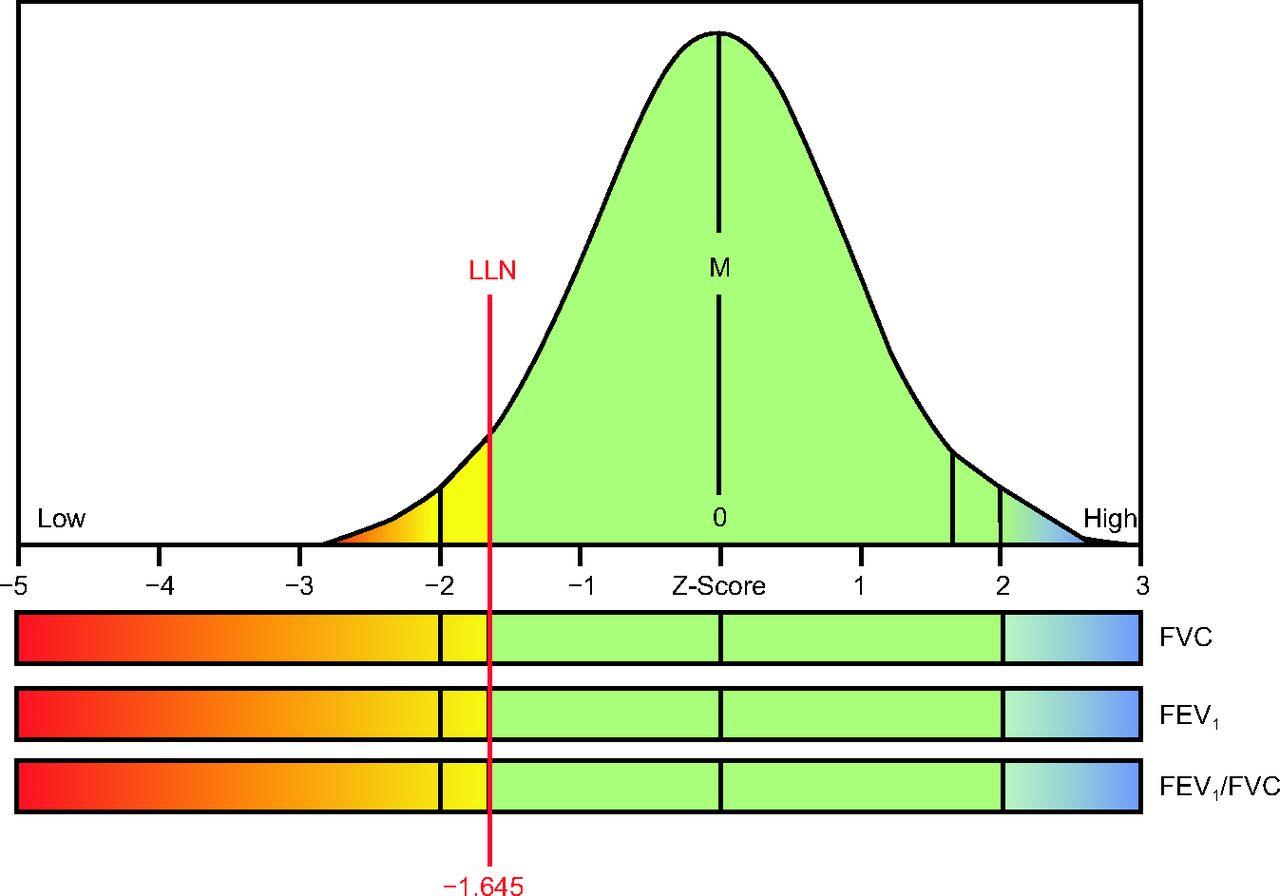
One-tailed bell curve for evaluating spirometry indices. LLN = lower limit of normal; M = mean or median. Courtesy Morgan Scientific.
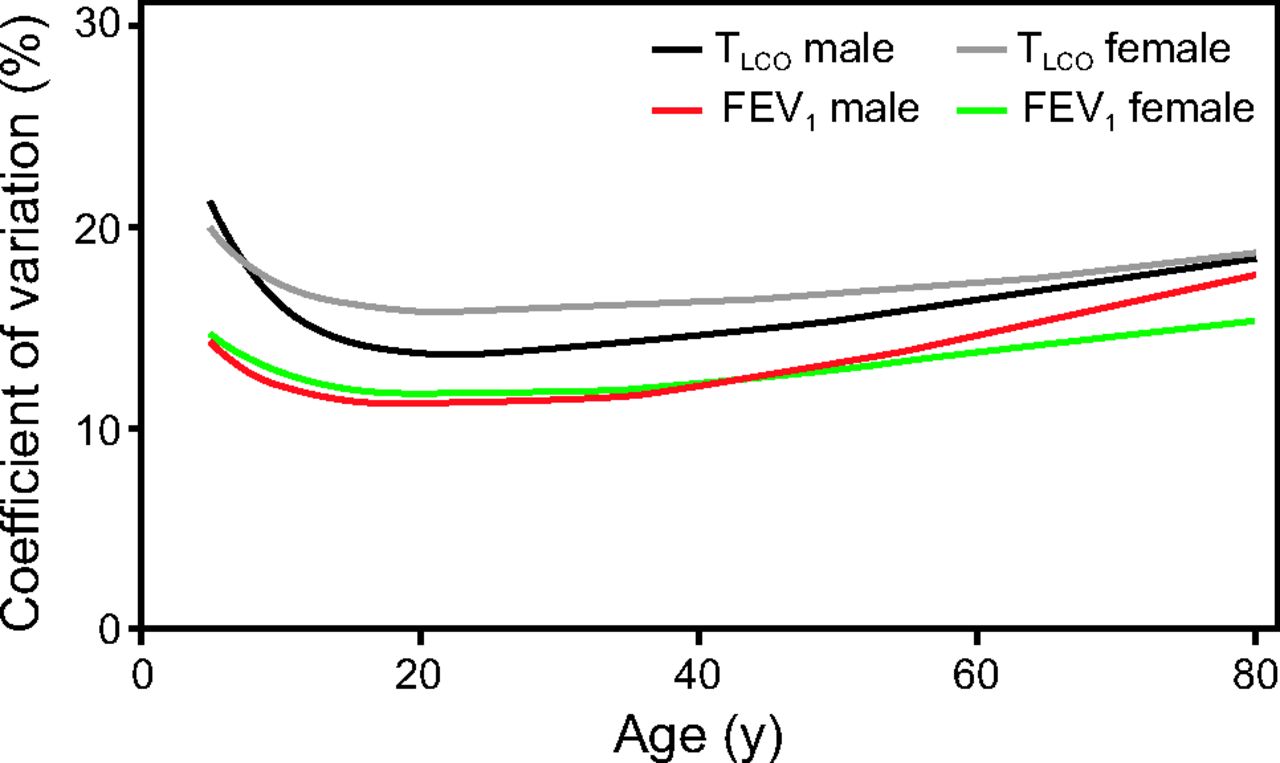
Coefficients of variation for 2 pulmonary function variables. TLCO = transfer factor for carbon monoxide. From Reference 14, with permission.
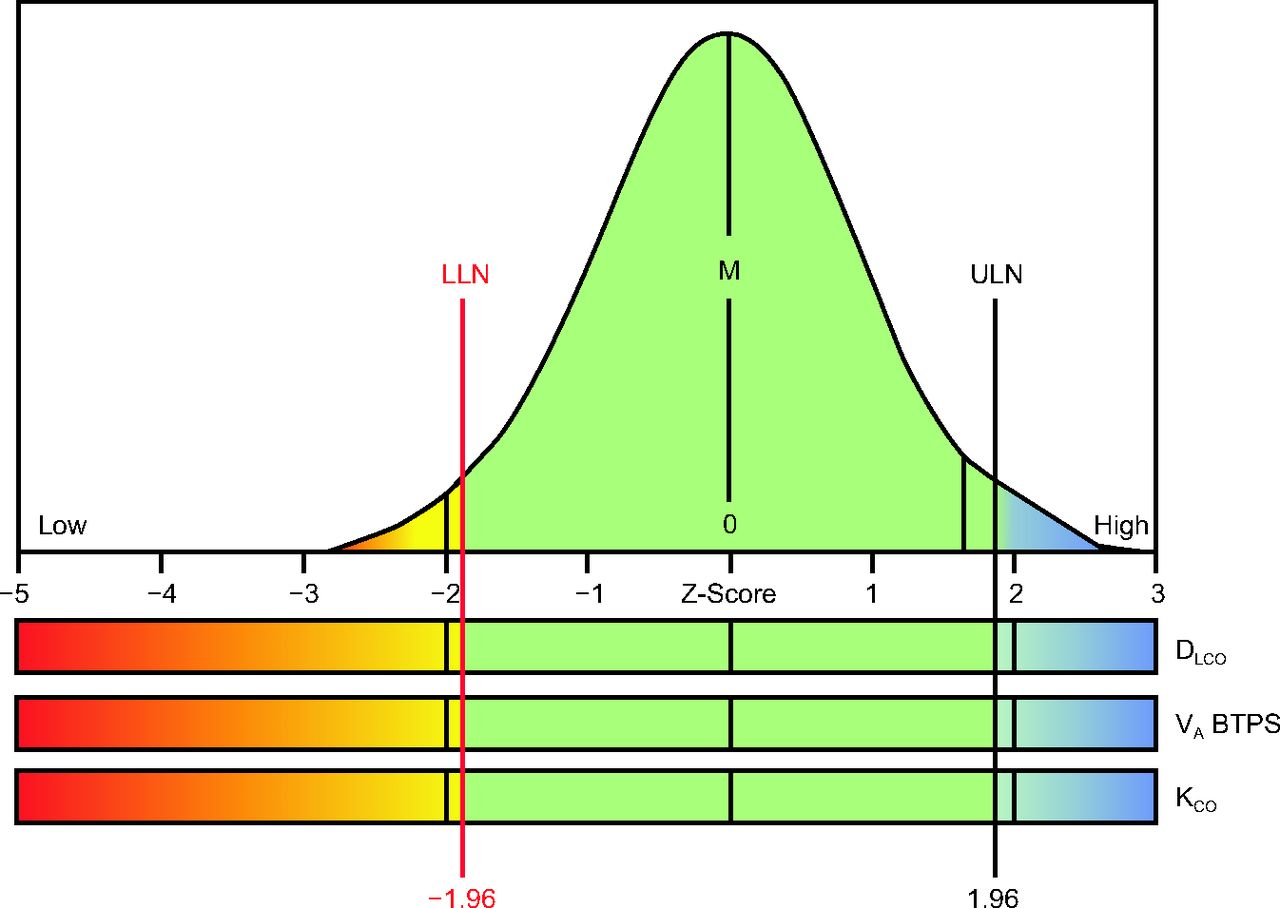
Rather than interpreting results against a single value (100% of predicted), combining the predicted value and the expected coefficient of variation at a given age provides a Z score (or SD score), which represents how many SDs a recorded value is offset from the mean or median value. The empirical rule states that if we repeatedly obtained values from a similar normal population, 99.7% of those values would fall within 3 SD of the average or median value. If a Z score of −3 to +3 is chosen to define normality, we can be certain that nearly 100% of subjects with normal lungs will have values in the normal range. However, using this range to define normality in patients would likely result in false negatives (ie, some patients with diseased lungs would have values in the normal range). A tighter range such as 2 SD (Z score −1.96 to +1.96) creates more separation between those with and without disease, but would do so at the expense of introducing error. For 2 SD there is a 5% error—if we repeatedly obtained values from a similar normal population, 95% of those values would fall within 2 SD (Z score −1.96 to +1.96) of the mean or median value. If a Z score of −1.96 to +1.96 is chosen to define normality, one should expect that 5% of subjects (1 out of 20) with normal lungs will have values just outside the “normal” range. If a value can only be abnormally low (eg, FEV1), the 5% error can be applied to the low side of the distribution. Empirically, if we repeatedly obtained values from a similar normal population, 90% of those values would fall within 1.64 SD (Z score −1.64 to +1.64) of the mean or median value. If there is no concern about higher values being abnormal, the 5% error on the lower tail of the curve and a Z score of −1.64 can be defined as the LLN (Fig. 2). If a value can be abnormally high or low (eg, DLCO), the 5% error is distributed to each end or tail of the distribution (ie, 2.5% on each side) (Fig. 4). The advantage of using Z scores (as opposed to percent of predicted) to define the LLN—and the upper limit of normal (ULN)—is that they apply to all populations. In contrast, a value of 83% of predicted may be abnormal in a young person whereas a value of 70% of predicted may be normal in an elderly person, and this will differ for each pulmonary function outcome.7

Two-tailed bell curve for evaluating diffusing capacity indices. LLN = lower limit of normal; M = mean or median; ULN = upper limit of normal; DLCO = diffusing capacity of the lung for carbon monoxide; VA BTPS = alveolar volume at body temperature, ambient pressure, and water saturation; KCO = transfer coefficient of the lung for carbon monoxide. Courtesy Morgan Scientific.
How Should Pulmonary Function Data Be Presented for Interpretation?
Interpretation of pulmonary function data depends to a certain extent on how the data are presented. The common practice of only listing the measured value, the predicted value, and the percent of predicted promotes the use of fixed thresholds (eg, 80% of predicted) as the LLN. The ATS has published a technical statement regarding pulmonary function reports, which recommends a standardized format based on sound statistical techniques, including graphical representation of the normal range.15
Accepting Uncertainty
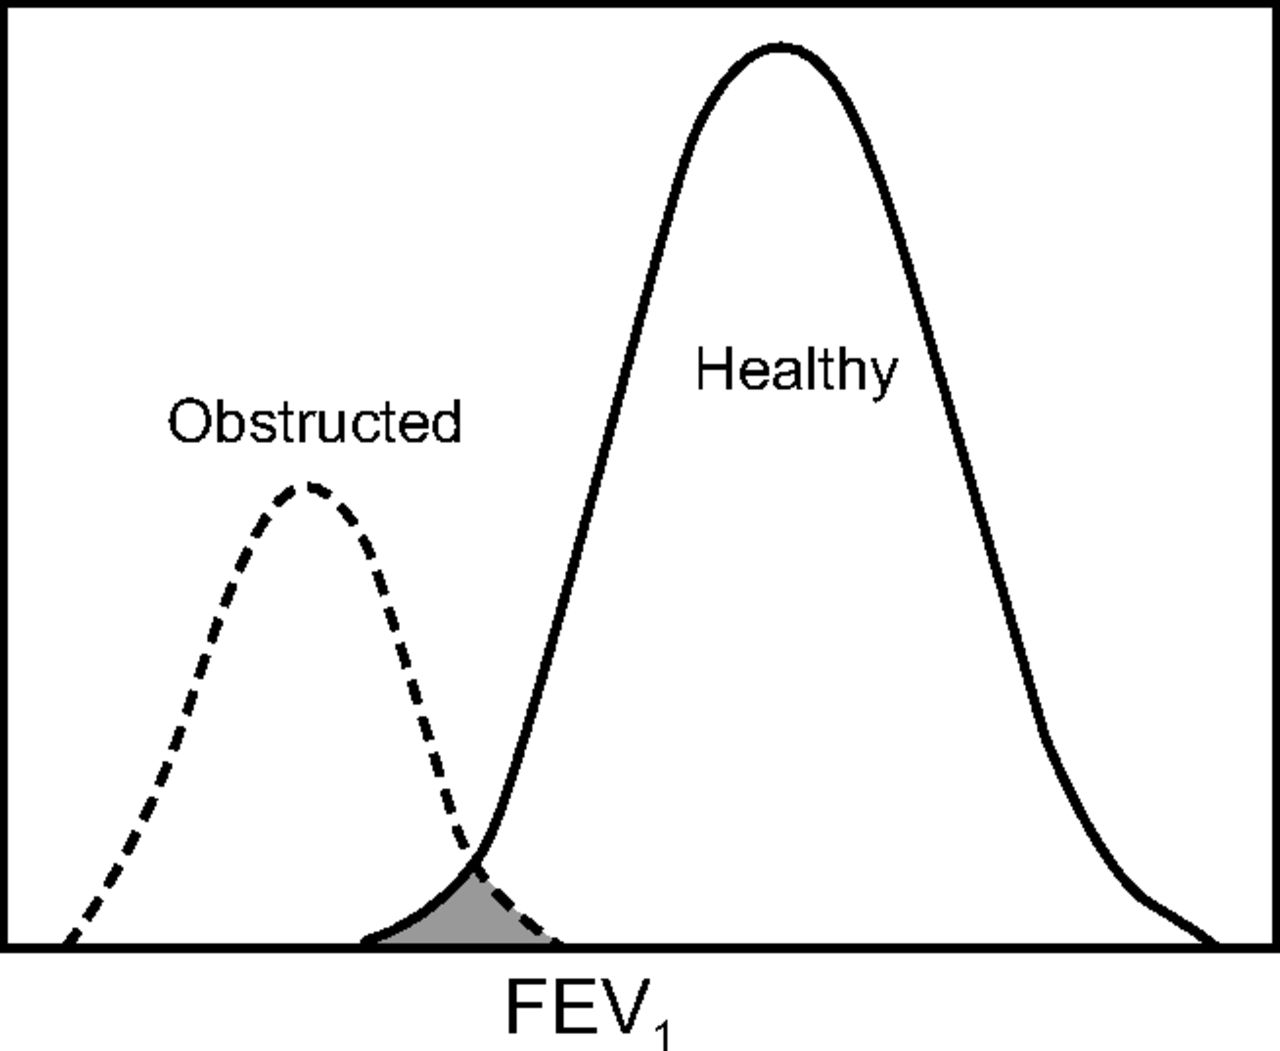
Because there is a range of values (ie, a distribution) that represents healthy individuals, and a range of values observed in those with disease, an overlap between health and disease for lung function values should be expected (Fig. 5). The overlap has been called the “zone of uncertainty” because it represents a level of pulmonary function that may be indicative of disease, or it may simply be a value that places the subject in the lowest part of the normal range.16 For both research and clinical practice, accepting the uncertainty associated with pulmonary function necessitates the use of additional tools (eg, risk factors, history of exacerbations, symptoms) before making a diagnosis.

Overlap between airway obstruction and normal pulmonary function (shaded area).
The lowest fifth centile of a healthy nonsmoking population represents a “false positive” cohort, that is, subjects who are healthy but whose pulmonary function is below the LLN. Nonetheless, using an LLN based on a statistically valid fifth centile better distinguishes age, sex and ethnicity based changes in lung function related to airway obstruction than does a fixed cutoff based on the percent of predicted.17
Incorporating Uncertainty Into Interpretation
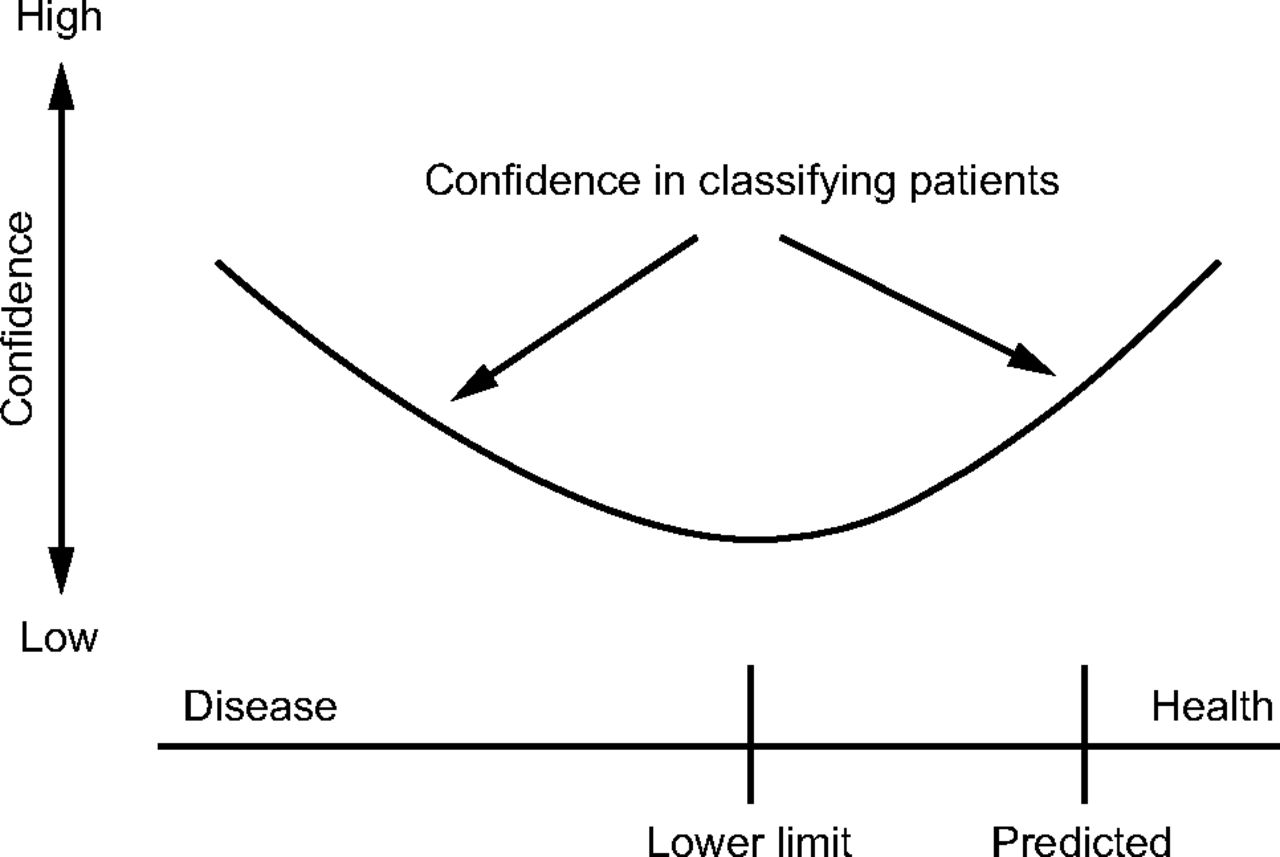
Bayes’ theorem incorporates existing knowledge to calculate conditional probabilities. Bayesian thinking helps draw more reliable conclusions and reduce the influence of human bias on the interpretation pulmonary function data. While calculating conditional probabilities is not practical during interpretation of a pulmonary function test, the principles of Bayesian thinking can be useful when considering the likelihood of health or disease. Bayesian thinking is usually not required for data that are not close to the LLN, where diagnostic confidence is high (Fig. 6), but it may be very important when data are near the LLN.18 For example, an FEV1/FVC ratio at the LLN should be interpreted differently depending on prior knowledge. If the data around the LLN were collected from a smoker with a family history of emphysema, there is a greater chance of underlying disease than if the same data were collected from a never-smoker with a low probability of asthma. In other words, for any given piece of data around the LLN, the pretest probability of disease affects the post-test probability of disease. For this reason, pertinent health information (eg, tobacco use, occupational exposures, symptoms) should be provided to the interpreting physician. The same information (ie, population characteristics) should be considered in the context of research studies.
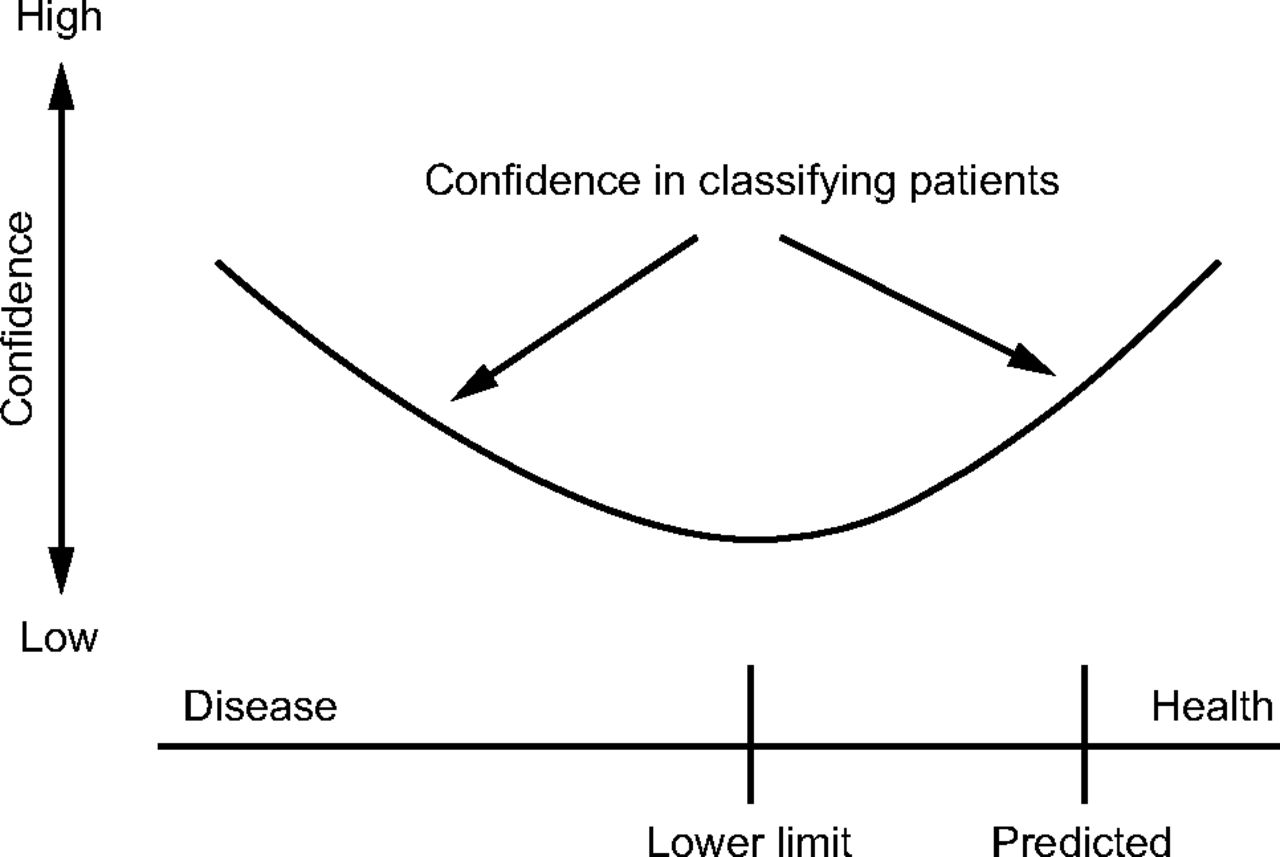
Diagnostic confidence based on the normality of recorded data. From Reference 18.
Not All Approaches Are Equal
Hundreds of studies involving the diagnosis, epidemiology, or treatment of COPD over the past 15 years have adopted the Global Initiative for Chronic Obstructive Lung Disease (GOLD) spirometric criteria for defining airway obstruction.19-23 The original rationale for adopting an FEV1/FVC of 0.7 was pragmatic in that a simple, easy-to-remember number would promote the use of spirometry to diagnose airway obstruction. Common to all of these studies is the assumption that an FEV1/FVC ratio < 0.7 is diagnostic of airway obstruction, despite multiple studies showing that the ratio falls with age and differs with sex and ethnicity.13,24,25 The fixed-ratio assumption can also result in “false negative” findings when applied to young adults with a history and symptoms of airway obstruction.26 The fixed ratio of 0.7 continues to be used, even though modern spirometers can calculate a patient-specific LLN for each pulmonary function variable.
Because of the widespread use of the fixed ratio, several large epidemiological studies have looked at subjects whose FEV1/FVC was < 0.70 but greater than the LLN.27-29 Mannino et al27 posited that these subjects had a higher risk of death and increased rates of hospitalization, even though the adjusted odds ratio from their paper (95% CI 0.96–1.3) was not different than in healthy controls. Conversely, Vaz Fragoso and colleagues30 evaluated older participants in the third National Health and Nutrition Examination Survey (NHANES III) data set and found that, after adjusting for confounders, increased risk of death was present only when FEV1 was less than the LLN (fifth percentile). The same study showed that GOLD Stage 1 was not associated with more respiratory symptoms, and that GOLD Stage II (50% < FEV1% < 80%) was inferior to the percentile approach for classifying respiratory symptoms.30 Bridevaux et al31 found that, in asymptomatic subjects classified as GOLD Stage 1, there was no association with dyspnea, accelerated FEV1 decline, respiratory care utilization, or quality-of-life scores, compared to a reference group. Research using hospital administrative data or fixed cutoffs for spirometric indices introduces biases and risk of misclassification of COPD, although this topic remains controversial.32-34 Use of statistically valid LLN for lung function measures, along with prior probability of disease, clinical signs, and symptoms reduces the risk of both false positives and false negatives. Using the LLN rather than 0.70 in younger adults with symptoms of airway obstruction (eg, asthma) also avoids false-negative interpretations when the LLN is above the fixed threshold. Furthermore, translation of epidemiological evidence (eg, administrative definitions, questionnaire-based definitions) to a patient population is challenging, and results cannot always be applied directly.
The LLN may be viewed as an arbitrary threshold like the fixed ratio.35 Which threshold to use for determining abnormality should be based on the best available evidence, and statistically valid LLNs meet this criterion. Reference equations generated using statistical methods such as λ-μ-σ (lambda mu sigma) provide limits of normal that minimize bias due to age, sex, or ethnicity.
Can Disease Be Present If the Pulmonary Function Test Is “Normal”?
Pulmonary functions tests are just what they purport to be: tests of “function” or physiology. Other diagnostic procedures, such as imaging studies or laboratory tests, may detect lung disease even though pulmonary function variables fall within normal limits. The use of high-resolution computed tomography for quantifying emphysematous changes and airway thickening in the lungs has become commonplace, and this technique often detects significant air trapping even though spirometric airway obstruction is not present.36,37 Similarly, biomarkers such as exhaled nitric oxide can detect diseases such as airway inflammation in patients whose spirometry is unremarkable.38 Using all of the available patient data conforms to the concept of Bayesian thinking as described above and is equally important for research, epidemiology, and clinical decision-making. For example, using the FEV1 percent of predicted and the ratio of residual volume to total lung capacity in combination with the FEV1/FVC ratio improves the diagnosis of COPD as judged by expert clinicians.39 Implementation of artificial intelligence algorithms may enhance the sensitivity of lung function tests when combined with other clinical data.40
Appreciating Longitudinal Changes Within the “Normal” Range
As stated above, an important concept to keep in mind is that pulmonary function test results that fall into the normal range do not exclude the possibility of disease, even when the values are well above the LLN. When reference equations are used to determine normality, the patient’s data are compared to biologic peers; the limitation of this comparison is the wide variability discussed previously. For example, the normal DLCO for a 60-y-old white male who is 178 cm tall ranges from 20.8 to 35.9 mL/min/mm Hg.14 A recorded value of 24 mL/min/mm Hg (87% of predicted, Z score −0.85) would therefore be considered normal. However, if the patient’s healthy or baseline DLCO was known to be 32 mL/min/mm Hg (115% of predicted, Z score 0.89), a value of 24 mL/min/mm Hg represents a 25% decline which would be considered an abnormal finding. Comparing patients to themselves has the advantage of less variability than relying solely on a reference equation (Fig. 7).18
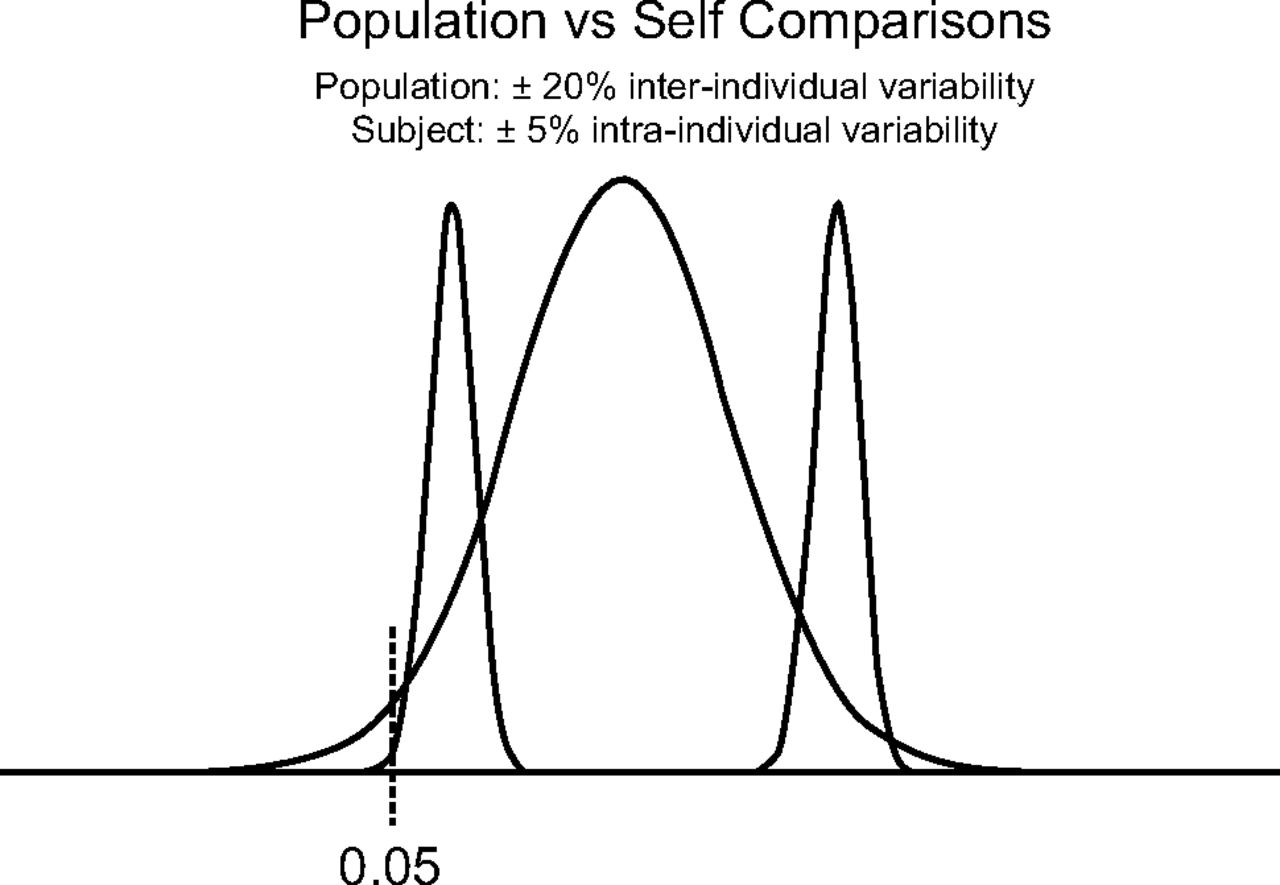
Variability differences in self-comparisons versus reference equations. The wide distribution curve represents data expected from an individual based on a population-derived reference equation. The narrow curves represent the expected variability from 2 individuals based on serial testing. From Reference 18.
Recently reported data suggests that serial testing of children and adolescents may identify individuals whose lung function develops at a persistently low trajectory that may predispose them to development of COPD later in life.41,42 All-age equations (eg, the GLI reference equations) have the advantage of being able to compare lung function from childhood through adulthood to detect those who may have a low trajectory.7
How Do I Decide Which Reference Equation to Use?
An important and sometimes challenging decision for laboratory medical directors and managers is to decide which reference equations to use in clinical practice. Reference equations should fit the population being tested. Reviewing the demographics and geographic characteristics of the subjects used to generate the reference equation is a logical place to start. Ideally, laboratories will use equipment similar to that used to develop the reference equation; however, this should not disqualify the use of an otherwise appropriate reference equation. It is not practical for most laboratories to test different reference equations on a large group of normal volunteers when deciding which reference equation to select; however, the selected reference equations can be tested to see how well they fit the biologic control subjects in the laboratory. Moreover, if seemingly healthy patients frequently have values outside of the normal range, consideration should be given to the possibility that the chosen reference equations do not fit the local population.
In 2017, the ATS recommended that laboratories in North America adopt the GLI reference equations for spirometry and DLCO.7,14,15 For spirometry, many laboratories in the United States have used the reference equation derived from NHANES III,43 as was recommended by the 2005 ATS/ERS guidelines for test interpretation.44 Transitioning from the NHANES III43 to the GLI7 spirometry reference equations should not result in significant shifting of predicted values because the NHANES III data were included in the GLI reference equations. By doing so, laboratories gain many of the advantages of the GLI reference equations including an all-age sample (ie, GLI 3–95 vs NHANES III 8–80), negating the need for a separate pediatric reference equation for patients ≤ 8 y old and sampling from both southeast and northern Asia populations.7 The GLI DLCO reference equations, like most commonly used DLCO reference equations, were derived solely from a white population and should be used cautiously in patients from other ethnic groups, particularly if the values are near the LLN.14,18 Fixed racial correction factors should not be used to adjust the predicted DLCO because there is minimal evidence summarizing racial differences and a lack of robust correction factors. The predicted DLCO from the GLI reference equations is lower than the value calculated by many commonly used reference equations.14 Accordingly, longitudinal data interpretation should include consideration of the change in the absolute value, not just percent of predicted. The ATS has not made recommendations on which reference equations are best for lung volumes (or other tests); however, GLI reference equations for lung volumes are expected to be published soon. When reference equations change, an advisory message on the pulmonary function test report is appropriate to alert clinicians to the change in the predicted values and ranges.
Summary
Predicted values for pulmonary function tests differ significantly from the reference values used for many other diagnostic tests. However, these multiple factors (eg, age, height, sex, ethnicity) interact in complex ways to determine what the expected lung function values are in healthy subjects. In addition to the multiple determinants of lung function, healthy individuals exhibit a wide range of variability for most pulmonary function variables, and this variability is not constant across all age ranges. We now have robust all-age reference equations (eg, GLI) that appropriately describe the range of values observed in healthy individuals. Interpretation of lung function results requires clinicians and researchers to appreciate that there is a range of values that represents healthy lungs and to accept some uncertainty when trying to establish a diagnosis. A statistically valid LLN and ULN are preferable to fixed cutoffs for diagnostic purposes in both research and clinical practice because they reduce bias. All-age, race-specific equations with LLN and ULN (when appropriate) should be used to reduce the risk of misclassifying patients.7
Footnotes
- Correspondence: Jeffrey M Haynes RRT RPFT FAARC, Pulmonary Function Laboratory, St. Joseph Hospital, 172 Kinsley St. Nashua, NH 03060. E-mail: jhaynes{at}sjhnh.org
Mr Haynes has disclosed a relationship with Morgan Scientific. Dr Kaminsky and Mr Ruppel have disclosed relationships with MGC Diagnostics. Dr Stanojevic has disclosed no conflicts of interest.
- Copyright © 2020 by Daedalus Enterprises
References


Jump to section
- Article
- Abstract
- Introduction
- Lung Function as an Indicator of Lung Health (Inverse Modeling)
- Why Do We Need Reference Equations?
- Limitations of Reference Equations
- What Is Normal?
- How Should Pulmonary Function Data Be Presented for Interpretation?
- Accepting Uncertainty
- Incorporating Uncertainty Into Interpretation
- Not All Approaches Are Equal
- Can Disease Be Present If the Pulmonary Function Test Is “Normal”?
- Appreciating Longitudinal Changes Within the “Normal” Range
- How Do I Decide Which Reference Equation to Use?
- Summary
- Footnotes
- References
- Figures & Data
- Info & Metrics
- References