

Abstract
BACKGROUND: The ratio of end-tidal CO2 pressure to arterial partial pressure of CO2 ( ) was recently suggested for monitoring pulmonary gas exchange in patients with ARDS associated with COVID-19, yet no evidence was offered supporting that claim. Therefore, we evaluated whether
  might be relevant in assessing ARDS not associated with COVID-19.
METHODS: We evaluated the correspondence between  and the ratio of dead space to tidal volume (VD/VT) measured in 561 subjects with ARDS from a previous study in whom
  data were also available. Subjects also were analyzed according to 4 ranges of
  representing increasing illness severity (≥ 0.80, 0.6–0.79, 0.50–0.59, and < 0.50). Correlation was assessed by either Pearson or Spearman tests, grouped comparisons were assessed using either ANOVA or Kruskal-Wallis tests and dichotomous variables assessed by Fisher Exact tests. Normally distributed data are presented as mean and standard deviation(SD) and non-normal data are presented as median and inter-quartile range (IQR). Overall mortality risk was assessed with multivariate logistic regression. Alpha was set at 0.05.
RESULTS:  correlated strongly with VD/VT (r = –0.87 [95% CI –0.89 to –0.85], P < .001). Decreasing
  was associated with increased VD/VT and hospital mortality between all groups. In the univariate analysis, for every 0.01 decrease in
  , mortality risk increased by ∼1% (odds ratio 0.009, 95% CI 0.003–0.029, P < .001) and maintained a strong independent association with mortality risk when adjusted for other variables (odds ratio 0.19, 95% CI 0.04–0.91, P = .039).
  < 0.50 was characterized by very high mean ± SD value for VD/VT (0.82 ± 0.05, P < .001) and high hospital mortality (70%).
CONCLUSIONS: Using  as a surrogate for VD/VT may be a useful and practical measurement for both management and ongoing research into the nature of ARDS.
- ARDS
- ratio of arterial-to-alveolar oxygen tension
- ratio of dead space to tidal volume
- end-tidal carbon dioxide pressure
Introduction
The seminal study by Nuckton and colleagues1 demonstrated that the ratio of physiologic dead space to tidal volume (VD/VT) at ARDS onset was a strong, independent predictor of mortality risk. Since then, numerous studies have confirmed and expanded these findings.2-9 Others have demonstrated the value of using VD/VT measurements to detect lung recruitment and de-recruitment,10-14 as well as insight into the effects of pharmacologic therapies for ARDS.15-17
Unfortunately, it has been our perception that, despite both the clinical value of VD/VT and wide access to indirect calorimetry and volumetric capnography monitors, measuring VD/VT has not been universally embraced by the larger critical care community.18,19 Surrogate measures for estimating VD/VT now are commonly utilized and include versions of the Harris-Benedict or other equations.20,21 Another is the ventilatory ratio, which compares arterial partial pressure of CO2 ( ) and minute ventilation to corresponding “ideal” and “predicted” values as a signifier for VD/VT.22 In the absence of bedside capnography, these substitutes serve an important function.
Despite the general lack of enthusiasm for measuring VD/VT, bedside capnography is much more widely used to measure end-tidal CO2 pressure ( ). Given this backdrop amid the current COVID-19 pandemic, Gattinoni and colleagues23 offered the ratio of
  to evaluate pulmonary gas exchange dysfunction. Specifically, they stated that
  < 1 “suggests” the presence of elevated intrapulmonary shunt fraction and VD/VT. With few exceptions (eg, differences in how
  and expired
  are measured, or the effect of prolonged expiratory time constants on
  ), there is always a positive difference between
  and
and  . Therefore,
  will always be < 1, regardless of the severity of gas-exchange dysfunction. Therefore, without citing supportive evidence, the suggestion is not particularly informative.
We were intrigued by the possibility that  might be a meaningful signifier for pulmonary gas exchange dysfunction in ARDS in general. Because
  is easily calculated with readily available technology at the bedside, it may be useful both for patient management and ongoing research into the course of ARDS. It may also obviate the need for calculating surrogate measures when basic capnography is available at the bedside. Therefore, we retrospectively studied the association between
  and measurements of gas exchange dysfunction in a large number of ARDS subjects.
QUICK LOOK
Current knowledge
The ratio of dead space to tidal volume (VD/VT) increases with ARDS severity and is strongly associated with increasing intrapulmonary shunt and mortality. Assessing each of these variables requires additional data collection or calculations that are not widely performed in clinical practice. In contrast, basic bedside capnography is widely practiced. Both increasing dead-space ventilation and oxygenation dysfunction are associated with an increased difference between arterial partial pressure of CO2 ( ) and end-tidal CO2 pressure (
 ).
).
What this paper contributes to our knowledge
In ARDS, a strong association exists between an increasing VD/VT and a decreasing  ratio, with only a moderate association with increasing oxygenation dysfunction. The use of ratio cutoff values representing increasing severity of
  was significantly associated with an increasing VD/VT, oxygenation dysfunction, illness severity scores, and mortality, and this might be a convenient and useful measurement for both clinical management and research into the nature and progression of ARDS.
Methods
Data were abstracted from a previous study of VD/VT using volumetric capnography in subjects with early ARDS.3 Briefly, contemporaneous measurements of expired gas and arterial blood gases along with full ventilator systems checks were made early in the course of ARDS (99% within 48 h of syndrome onset) via volumetric capnopgraphy.3 These subjects were managed with the National Institutes of Health ARDS Clinical Trials Network ventilator protocol, which was adopted for clinical management in 2000.24,25 In 2010, the wide availability of volumetric capnography at San Francisco General Hospital allowed us to incorporate VD/VT measurements into our routine assessment and clinical management of ARDS. Between 2010 and 2017, 561 of the original 685 subjects (82%) from the previous study also had paired measurements for  and
and  available for analysis.3 As detailed in the previous study, illness severity scores were calculated on the day of ARDS onset along with basic demographic information and status at hospital discharge.
We assessed oxygenation using the ratio of arterial-to-alveolar oxygen tension ( ) because it is a more precise physiologic measure of pulmonary oxygen diffusion as it accounts for alveolar
  ,26 and thus the effects of permissive hypercapnia during lung-protective ventilation. In addition,
  values < 0.50 are associated with high degrees of intrapulmonary shunt, particularly at
  ≥ 0.50.26-28 We also used the formula
  because it reflects both alveolar and shunt-associated dead space.
Data are reported as either mean ± SD or median and interquartile range (IQR). Correlation between variables were assessed with Pearson or Spearman tests. Comparisons between groups were made using one-way analysis of variance and Tukey-Kramer multiple comparison tests, or with Kruskal-Wallis multiple comparisons test and Dunn post-test. Paired comparisons were made using either unpaired t test or the Mann-Whitney test. Dichotomous variables were assessed with the Fisher exact test. Data were analyzed using PRISM 8.4 (GraphPad, La Jolla, California). Alpha was set at 0.05. Use of this database was approved by the University of California, San Francisco Committee on Human Research.
Data were analyzed in 3 ways. First, the correlation between  with VD/VT and
  was assessed. Second, data were categorized into ranges of
  that represent increasing severity of CO2 excretion dysfunction. Because the data were skewed toward values suggesting less severe dysfunction (ie, 73% were ≥ 0.60), we divided
  data into 4 groups that would facilitate clinical apprehension: ≥ 0.80, 0.6–0.79, 0.50–0.59, and < 0.50. Within these groupings, we also included variables previously shown to be associated with hospital mortality in other studies3,22,29,30: Acute Physiology and Chronic Health Evaluation score (APACHE II),31 Simplified Acute Physiology Score (SAPS II),32 age, presence of sepsis, enrollment eligibility criteria used by the ARDS Clinical Trials Network,25 cutoff values signifying organ dysfunction (eg, platelets < 150 × 103/mm3, total bilirubin > 2 mg/dL), ventilatory ratio, oxygenation index, respiratory system compliance, and driving pressure. Third, we performed step-wise, backward, logistical regression modeling using the variables described above. Variables with a P value < .10 were entered into the final model. Model goodness of fit was assessed with the Hosmer-Lemeshow test.
Results
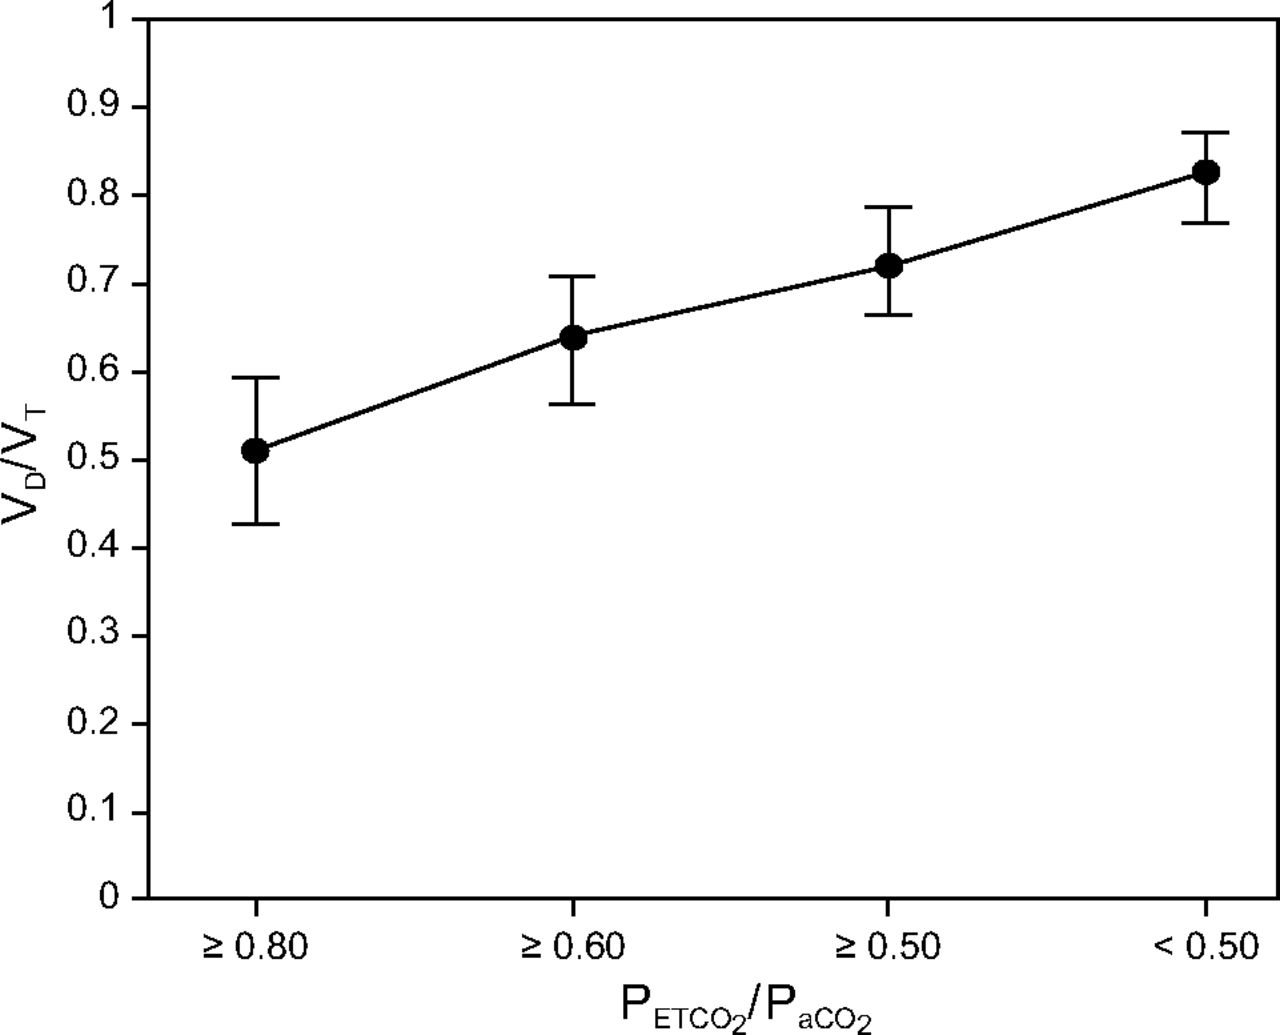
A strong negative relationship was found between  and VD/VT: r = –0.87 (95% CI –0.89 to –0.85), P < .001 (Fig. 1). In contrast, only a moderate relationship was found with
  : r = 0.46 (95% CI 0.38–0.52), P < .001. Analyzing subjects by group revealed that decreasing
  coincided with elevated VD/VT and ventilatory ratio, decreasing
  , increasing oxygenation index, and increasing APACHE II and SAPS II scores (Table 1). All comparisons between variables across groups were statistically significant. Values of
  < 0.50 coincided with very high VD/VT and low
  (ie, only 14% of alveolar partial pressure of O2 was reflected in arterial partial pressure of O2). The mortality risk was significant between all 4 groups. As
  decreased, hospital mortality increased from 20% at values ≥ 0.80 to 70% when
  fell to < 0.50 (Table 2, Fig. 2). All measures of gas exchange dysfunction distinguished survivors from non-survivors (Table 3).

Relationship between groupings of the ratio of end-tidal CO2 pressure to arterial partial pressure of CO2 pressure ( ) by severity and corresponding ratio of physiologic dead space to tidal volume (VD/VT).
Gas Exchange and Illness Severity Characteristics Across Ranges of 
Hospital Mortality Across Ranges of 
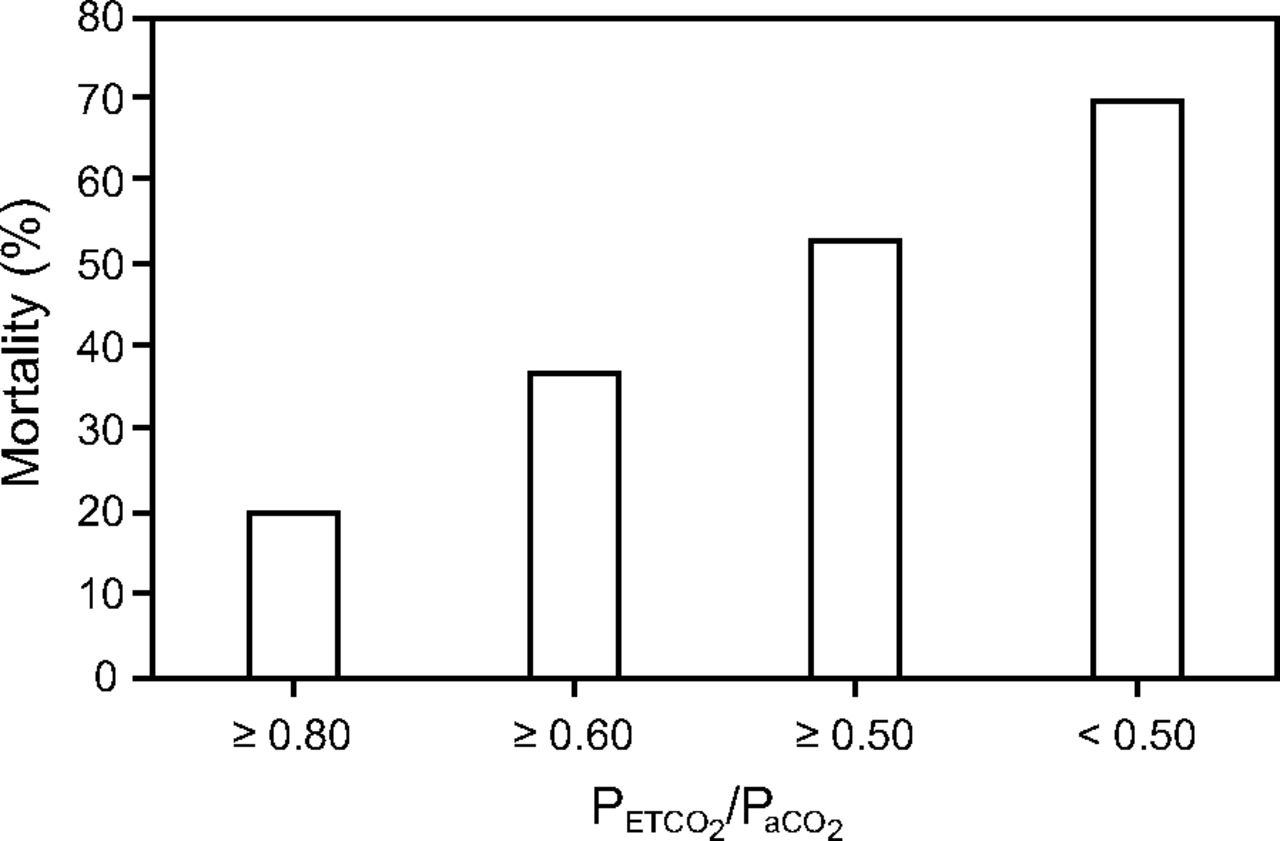
Relationship between groupings of the ratio of end-tidal CO2 pressure to arterial partial pressure of CO2 pressure ( ) by severity and corresponding hospital mortality.
Differences Between Survivors and Non-Survivors in Measures of Gas Exchange Dysfunction
In the univariate analysis, for every 0.01 increase in  , mortality risk decreased by ∼1% (odds ratio 0.009, 95% CI 0.003–0.029, P < .001) (Fig. 3). In multivariate logistic regression modeling, both
  and ventilatory ratio remained independent predictors of mortality after controlling for other variables (Table 4). Area under the receiver operating characteristic curve was 0.84 (95% CI 0.81–0.87), P < .001.

Univariate analysis of the ratio of end-tidal CO2 pressure to arterial partial pressure of CO2 pressure ( ) and mortality risk.
Mortality as a Function of 
Discussion
The primary finding of our study is that, during lung-protective ventilation, decreasing  in early ARDS is associated with increasing VD/VT, oxygenation dysfunction, illness severity scores, and mortality. Moreover,
  is independently associated with mortality risk after adjusting for variables known to increase mortality in ARDS. Our findings were similar to those that we previously reported for ventilatory ratio, which is another surrogate for VD/VT.22 Therefore,
  is a convenient and elegant surrogate for VD/VT that can be used to assess both pulmonary function and mortality risk in ARDS.
As implied in the methods section,  is derived from an equation often used for estimating alveolar dead space:
  . However, accurate measurement of alveolar dead space requires volumetric capnography (ie, the ability to measure the slope of phase III in the capnograph).33
  itself is an unreliable indicator of true alveolar dead space.34 This stems from the fact that, like the Enghoff modification of the Bohr equation, utilizing
  introduces the alveolar-capillary interface as a factor.35 In the presence of increased intrapulmonary shunt, as occurs in ARDS, rising
  coincides with decreasing
  .36 Considerable intrapulmonary shunting accounts for 20–33% of alveolar dead space in animal models.37 In our study, alveolar and shunt-associated dead space accounted for over half of the measured physiologic dead space as
  fell to < 0.60.
As mentioned earlier, despite 2 decades of research demonstrating the value of directly measuring VD/VT in patients with ARDS, adoption of this measurement as part of routine clinical management remains relatively sparse. This has motivated others to find alternative signifiers of dead space, particularly for evaluating mortality in large databases rather than evaluating the effects of therapy per se.
Estimating VD/VT based upon approximations of resting energy expenditure to calculate CO2 production substantially underestimates measured VD/VT, with reported bias ranging from –0.16 to –0.32.13,38 Nonetheless, in non-survivors all estimates of VD/VT have been reported to be significantly higher compared to estimates in survivors.38 In particular, an unadjusted estimate of VD/VT in both survivors and non-survivors (eg, those not correcting resting energy expenditure for body temperature) were very close to those in whom VD/VT was measured.38
Likewise, we previously reported that ventilatory ratio is moderately correlated with VD/VT (r = 0.66, P < .001) and was independently associated with mortality both in univariate and multivariate analyses at 2.07 (95% CI 1.53–2.85, P < .001) and 1.59 (95% CI 1.15–2.32, P = .004), respectively.22 In our study, which consisted of a large subset of data from a previous study, we found a moderate but slightly weaker correlation between ventilatory ratio and VD/VT (r = 0.55, P < .001) and a modestly higher mortality association in both the univariate and multivariate analyses at 2.25 (95% CI 1.68–3.07, P < .001) and 1.63 (95% CI 1.06–2.53, P = .03).
Ventilatory ratio is a less unwieldly method for evaluating the relationship between CO2 excretion dysfunction and ARDS compared to derivations based upon the Harris-Benedict and other equations. Thus, it is perhaps ideal for use in large observational or interventional studies when capnography is not widely used. Nonetheless, ventilatory ratio itself is somewhat unwieldly for clinical use compared to  . In particular, it does not translate as easily when evaluating interventions such as PEEP titration, prone positioning, or recruitment maneuvers. Regardless of these small differences, when direct measurement of VD/VT is unavailable, either method is a suitable substitute.
Conclusions
Our analysis suggests that  can be used as a surrogate for both VD/VT and oxygenation dysfunction in patients with ARDS. Similar to elevated VD/VT in early ARDS, decreasing
  is also associated with increasing illness severity and mortality risk. Although
  was recently proposed specifically for monitoring patients with ARDS associated with COVID-19, currently there are no data available to evaluate its potential relevance or utility.
Footnotes
- Correspondence: Richard H Kallet MSc RRT FAARC, 2070 Fell St, Apt #1, San Francisco, CA 94117. E-mail: richkallet{at}gmail.com
Mr Kallet has disclosed a relationship with Nihon Kohden. Dr Lipnick has disclosed no conflicts of interest.
- Copyright © 2021 by Daedalus Enterprises


