


Abstract
The small conducting airways are the major site of obstruction in chronic obstructive pulmonary disease (COPD). This study examined small airway pathology using a novel combination of multidetector row computed tomography (MDCT), micro-computed tomography (microCT) and histology.
Airway branches visible on specimen MDCT were counted and the dimensions of the third- to fifth-generation airways were computed, while the terminal bronchioles (designated TB), preterminal bronchioles (TB-1) and pre-preterminal bronchioles (TB-2) were examined with microCT and histology in eight explanted lungs with end-stage COPD and seven unused donor lungs that served as controls.
On MDCT, COPD lungs showed a decrease in the number of 2–2.5 mm diameter airways and the lumen area of fifth-generation airways, while on microCT there was a reduction in the number of terminal bronchioles as well as a decrease in the luminal areas, wall volumes and alveolar attachments to the walls of TB, TB-1 and TB-2 bronchioles. The combination of microCT and histology showed increased B-cell infiltration into the walls of TB-1 and TB-2 bronchioles, and this change was correlated with a reduced number of alveolar attachments in COPD.
Small airways disease extends from 2 mm diameter airways to the terminal bronchioles in COPD. Destruction of alveolar attachments may be driven by a B-cell-mediated immune response in the preterminal bronchioles.
Abstract
B-cell infiltration into the preterminal bronchioles is associated with destruction of alveolar attachments in COPD http://ow.ly/htxe30hMFoE
Introduction
A series of reports from the 1960s [1–4] established that the small conducting airways <2 mm in diameter offer <10% of the total resistance to airflow in health but become the major site of increased resistance in chronic obstructive pulmonary disease (COPD). Based on these and other data, Mead [5] postulated that the small conducting airways <2 mm in diameter are a “quiet” zone within normal lungs where disease can accumulate over many years without being noticed. Since then, numerous reports have shown that disease in the small conducting airways in patients with COPD is characterised by chronic inflammation, lumen narrowing, wall thickening and loss of alveolar attachment to the outer walls of these airways [6–12]. In addition, the introduction of multidetector row computed tomography (MDCT) in the 1990s made it possible to show that abnormalities in the 2–3 mm in diameter airways visible on MDCT are closely associated with airflow obstruction in COPD [13]. More recent reports using MDCT and micro-computed tomography (microCT) have shown that the terminal bronchioles (designated TB) are narrowed and extensively destroyed in lungs from patients with end-stage COPD treated with lung transplantation [14]. Furthermore, microCT studies have shown lumen narrowing, wall thickening and loss of alveolar attachments in preterminal bronchioles (TB-1) in the centrilobular emphysema phenotype of COPD [15].
The purpose of this report was to use a very recently developed approach capable of linking MDCT and microCT scans to histological sections from exactly the same samples of tissue [16] in order to determine if small airways disease extends from the smaller bronchi and bronchioles (2–2.5 mm in diameter) that define the start of the lung's quiet zone to the (pre-)preterminal (TB-1 and TB-2) and terminal bronchioles (TB) that are the last purely conducting airways in the lung quiet zone.
Methods
Informed consent
Informed consent was obtained directly from patients with very severe COPD waiting for lung transplantation and from the donor's next of kin under conditions that allow organs considered unsuitable for transplantation to be released for research.
MDCT and microCT scans
In this study, all specimens were right explanted lungs. The procedures used to prepare the lung tissue for MDCT and microCT imaging followed by histology have been described in detail elsewhere [14–16]. Briefly, eight lungs affected by COPD were donated by patients undergoing lung transplantation for COPD; all had Global Initiative for Chronic Obstructive Lung Disease (GOLD) stage 4 disease. Seven unused donor lungs (three from never-smokers and four from former smokers) served as controls. The lungs were fully inflated with air to a positive pressure of 30 cmH2O, then deflated and held at constant pressure (10 cmH2O) while the lungs were surrounded by liquid nitrogen vapour and frozen solid. The inflated lung specimen was kept frozen while MDCT scans were obtained using a CT scanner (either a Siemens Sensation 16 (Siemens Medical Solutions, Munich, Germany; 120 kVp, 250 mA, pitch: 1.25, 1 mm contiguous images) or a GE Discovery CT750 HD (GE Healthcare, Milwaukee, USA; 120 kVp, 250 mA, pitch: 1.375, 0.625 mm contiguous images)) and reconstructed using a high spatial frequency reconstruction algorithm (Siemens: B60f, GE: Bone). The frozen specimen was then cut into 20 mm-thick transverse slices from lung apex to base, and regions of mild to moderate emphysema were specifically identified by visually inspecting photographs of the slices from the COPD lungs. Frozen tissue cores 14 mm in diameter and 20 mm in length were removed from the selected lung regions of COPD lungs and from randomly selected regions of control lungs. The cores were imaged on a Nikon HMX 225ST micro CT scanner (Nikon Metrology, Leuven, Belgium) with 11 μm isotropic voxel resolution at −30C, using a technique recently described in detail by Vasilescu et al. [16].
MDCT analysis
Apollo 2.0 software (VIDA Diagnostic Inc., Coralville, IA, USA) was used to analyse the tracheobronchial tree in the MDCT specimen scans. The airway tree was segmented automatically, based on the region growing method. A new seed point was manually set to facilitate further region growing when necessary, based on a recently reported method [17]. The numbers of branches in each generation of airway was automatically counted using the segmented airway trees. The luminal and wall areas were measured for the third-, fourth- and fifth-generation airways of the RB1 and RB10 paths, and averaged for each of the generations. The percentage of low attenuation lung tissue <−950 Hounsfield units (LAA%) [18, 19] was also calculated to estimate the severity of the emphysema in the entire right lung.
MicroCT analysis
The mean linear intercept (Lm) and the numbers of terminal bronchioles per mL lung were measured in each tissue core as previously described [14]. One terminal bronchiole, defined as the last purely conducting airway, was randomly selected in each tissue core, and then preterminal bronchioles [15] and pre-preterminal bronchioles were identified by tracking back from the selected terminal bronchioles [14]. Cross-sectional microCT images of each of these airways perpendicular to the centre line of their lumens were reconstructed, and the bronchiolar length (distance between two branch points), luminal and wall areas, wall thickness and volume, internal diameter, number of alveolar attachments to their wall, and number of alveolar attachments adjusted by the outer perimeter were obtained using previously reported methods [15].
Histology
Portions of the frozen tissue cores examined by microCT were fixed overnight in alcohol-based formalin kept at −20°C, warmed up to room temperature, processed and embedded in paraffin wax, and cut into 4-μm thick sections [16]. Examination of haematoxylin and eosin-stained sections using a light microscope made it possible to correlate the histological sections with the microCT scans to identify TB, TB-1 and TB-2. For immunohistochemistry, the sections were incubated with primary antibodies to identify specific cell types (table E1) followed by secondary antibodies using the alkaline phosphatase system to amplify signals. The volume fractions of the airway walls occupied by immune cell subtypes were calculated for all identifiable TB, TB-1 and TB-2 on histological sections. In addition, the perimeter of the basement membrane (Pbm), lumen and wall areas of relatively circular airways (long axis/short axis <3) were measured, and histological wall thickness was calculated by dividing wall areas by Pbm according to a previously reported manual tracing technique [10]. As basement membrane length is not affected by inflation level or extent of smooth muscle contraction [10, 20], the area enclosed by the basement membrane in a hypothetical maximally dilated circular airway (Amax) can be calculated as; Amax=Pbm2/(4π), The degree of luminal narrowing can then be calculated as 1−(measured luminal area/Amax) as reported by Bosken et al. [11].
Statistical analysis
Data are expressed as mean±sd. Either t-tests or Wilcoxon rank sum tests were used for comparison between control and COPD groups. Tukey's adjustment was used for multiple comparisons. Pearson correlation tests were performed after log transformation of the volume fraction of immune cells. Statistical analyses were performed with the R program [21].
Results
Table 1 shows that the seven controls and eight patients with COPD were well matched for age, sex and height, while the controls were heavier. All patients with COPD were former smokers, whereas three of the controls were never-smokers.
Demographics of patients
Figure 1a and b show an MDCT specimen scan used to reconstruct the airway tree using the Apollo software. Table 2 shows that total lung volume and emphysematous change on specimen MDCT scans were substantially greater in COPD than in control samples. There was a downward trend in total airway number, wall and lumen area in COPD compared with control lungs, which became statistically significant for the number of airway branches 2–2.5 mm in diameter (figure 1c) and luminal areas of the fifth-generation airways (figure 1d). Figure 1d also shows no difference in the wall thickness of the third-, fourth- and fifth-generation airways between COPD and controls.

Specimen multidetector row computed tomography (MDCT) and micro-computed tomography (microCT) analysis of airways. a) MDCT scan, from which the airway tree is segmented (b). c) MDCT measurements show the number of airway branches 2–2.5 mm in diameter and luminal area of the fifth-generation airways (sub-subsegmental) are decreased in chronic obstructive pulmonary disease (COPD) compared with control lungs while d) wall thickness does not differ. e) MicroCT scan, from which the lumen of terminal (TB), preterminal (TB-1), and pre-preterminal (TB-2) bronchioles were segmented (f). MicroCT measurements show that g) the number of terminal bronchioles and h) the luminal areas of TB, TB-1, and TB-2 are decreased in COPD compared with control lungs. These measurements also show increases in i) the wall thickness of TB, TB-1 and TB-2 and j) the wall area of TB-2 and k) decreases in the wall volume and l) the number of alveolar attachments per outer perimeter of TB, TB-1 and TB-2 in COPD. *: p<0.05; **: p<0.01.
Quantitative measurements of explanted lungs with specimen multidetector row computed tomography scans
Figure 1e and f show how the microCT scans were used to identify terminal bronchioles and to trace back from TB to TB-1 and TB-2. Table 3 compares microCT data from 38 samples from seven control lungs with 40 samples from eight explanted COPD lungs, and figure E1 shows that the distribution of the positions of these samples within the lungs was not different between control and COPD lungs. The number of terminal bronchioles per mL of lung and the luminal areas and alveolar attachments of TB, TB-1 and TB-2 were reduced in COPD (table 3, figure 1g and h). The wall thickness of TB-2, TB-1 and TB (figure 1i) was increased in COPD without an increase in wall area (figure 1j) in these airways, whereas the wall volumes (figure 1k) and the number of alveolar attachments adjusted by the outer perimeter (figure 1l) were decreased in COPD.
Micro-computed tomography findings of sample cores
Figure 2a shows the distributions of Lm for samples from controls and patients with COPD. Figure 2b shows that the number of terminal bronchioles, lumen area and number of alveolar attachments to TB-2, TB-1, and TB were decreased in samples with mild emphysema (Lm <1000 µm) in the COPD compared with control lungs. Supplementary figure E2 shows no differences in LAA% (MDCT), Lm, number of terminal bronchioles, lumen areas, or number of alveolar attachments (microCT) between controls with and without a smoking history.
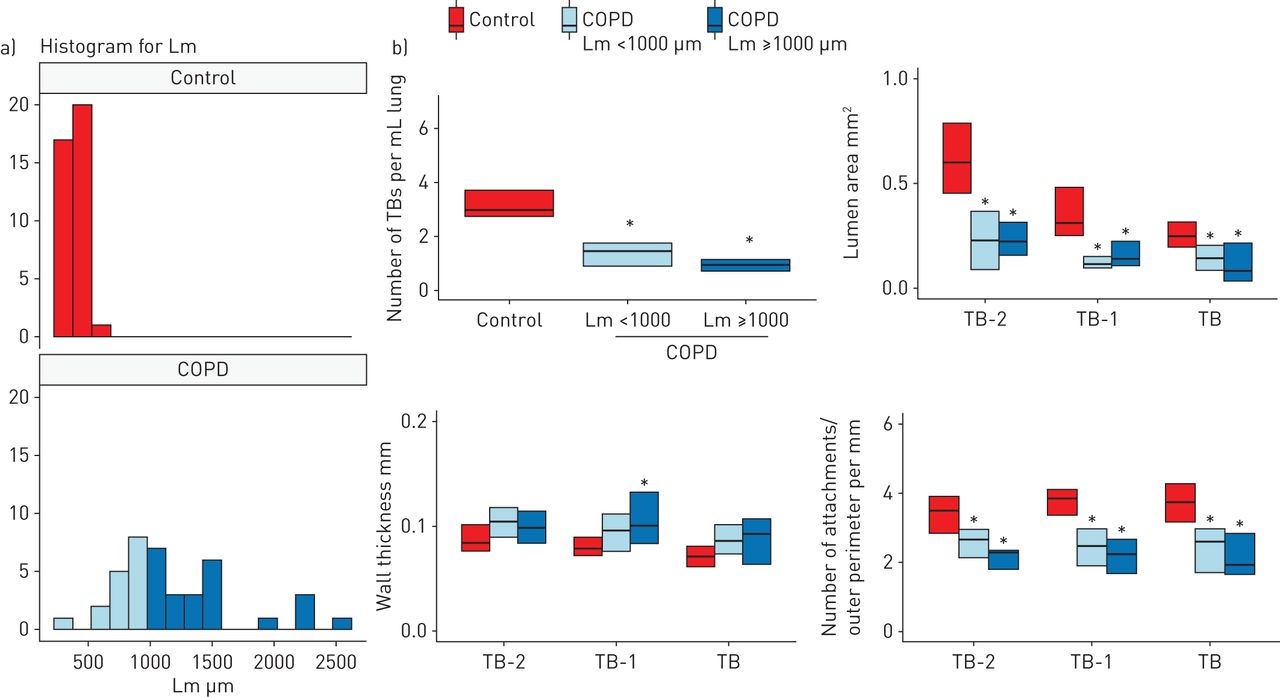
Multidetector row computed tomography and micro-computed tomography comparisons between control and chronic obstructive pulmonary disease (COPD) samples with different severities of emphysema. a) A histogram for mean linear intercept (Lm) in control and COPD. To compare mild emphysematous regions of the COPD lungs with controls, COPD samples were divided into those with Lm <1000 µm (n=16) and Lm ≥1000 µm (n=24). b) The number of terminal bronchioles (TBs) per mL of lung, the mean lumen area, and the number of alveolar attachments per length of outer perimeter of TB, TB-1 and TB-2 were decreased in both groups of COPD samples compared to controls. *: p<0.05 versus control.
Figure 3a shows a specimen MDCT scan that was matched with a photograph of the corresponding lung slice, where the circled area indicates a region sampled for microCT and histology. Figure 3b shows representative cross-sections of TB-1 in control and COPD lungs. Histological analysis of airways that were cut circularly showed a downward trend in the perimeter of basement membrane in COPD compared with control lungs, which became statistically significant for TB (figure 3c). In contrast, there was a trend toward greater luminal narrowing (figure 3d) and wall thickness (figure 3e) in COPD, which became statistically significant for TB-1.

Structural evaluation of small airways on histology combined with micro-computed tomography (microCT) scan. a) An example of a multidetector row computed tomography scan of a specimen (left panel) matched with a photograph of the corresponding lung slice on which the circled area indicates the region that was subsequently used for microCT and histology. This allowed for comparison of the microCT with the histology of the same airway. By matching a microCT image to a histological section, this technique enabled identification of terminal (TB), preterminal (TB-1), and pre-preterminal (TB-2) bronchioles on histology. b) Representative cross-sections of TB-1 in control and chronic obstructive pulmonary disease (COPD). Scale bar indicates 0.5 mm. Histological measurements of relatively circular bronchioles (nine TB, 11 TB-1, and five TB-2 in control and eight TB, 11 TB-1, and five TB-2 in COPD) c) basement membrane length, d) degree of airway narrowing and e) wall thickness. The degree of airway narrowing was calculated as; 1–(measured luminal area)/(calculated area enclosed by the basement membrane in hypothetical maximally dilated airways). “All” on the x-axis indicates the data when combining all circular bronchioles including TB, TB-1 and TB-2 (n=25 in control and n=24 in COPD). *: p<0.05; **: p<0.01.
Figure 4a shows representative CD79a staining of TB-1 in control and COPD. The data from immunochemical staining of all circular and noncircular airways show that in COPD the macrophages stained with a CD68 antibody were decreased in TB-2 (figure 4b) and the B-cells stained with a CD79a antibody were increased in TB-1 and TB-2 (figure 4a and c). Figure 4d shows an increase in B-cells in TB-1 and TB-2 for samples with Lm <1000 µm and Lm ≥1000 µm in the COPD lungs. Moreover, the increased B-cell infiltration into TB-1 and TB-2 in COPD was associated with a reduced number of alveolar attachments/airways (figure 4e) and with the number of alveolar attachments adjusted by the outer perimeter (figure 4f) of the same airways, but not with the wall thickness or luminal area (supplementary table E2).

A combined analysis of immunohistochemistry and micro-computed tomography images to assess infiltration of immune cells and structural changes in small airways. a) Representative immunohistochemistry with CD79a antibody (B-celll marker, indicated by a yellow arrow) in preterminal bronchiole (TB-1) of control and chronic obstructive pulmonary disease (COPD). Scale bar indicates 0.5 mm. TB and TB-2 indicate terminal and pre-preterminal bronchioles. b and c) Volume fractions (Vv) of the airway wall occupied by immune cells using all circular and non-circular bronchioles (15–16 TB, 15–17 TB-1, and 9–10 TB-2 in control and 17–18 TB, 15–16 TB-1, and 13 TB-2 in COPD). d) A significantly greater B-cell infiltration into the walls of TB1 and TB-2 in COPD samples with mean linear intercept (Lm) <1000 µm (n=14) and those with Lm ≥1000 µm (n=15) compared with controls (n=24). Relationships of Vv of B-cells in the wall of TB-1 and TB-2 with the e) number of alveolar attachments per airway (r=−0.39, p=0.04) and f) number of alveolar attachments per mm of outer perimeter (r=−0.45, p=0.02), respectively. *: p<0.05 and **: p<0.01.
Discussion
In this study, the combined use of MDCT and microCT provides new information about the lung's “quiet” zone in COPD by showing that both the numbers of airways 2–2.5 mm in diameter identifiable on MDCT scans and the terminal bronchioles on microCT scans are decreased, and the lumens of the fifth-generation airways and the pre-preterminal, preterminal and terminal bronchioles (TB-2, TB-1 and TB) are narrowed in COPD. These data suggest that the disease in the lung's “quiet zone” extends from airways 2–2.5 mm in diameter to the terminal bronchioles. Furthermore, the combination of microCT and histology allowed us, for the first time, to show that increased B-cell infiltration into the walls of TB-1 and TB-2 in COPD is associated with destruction of alveolar attachments to these airways.
A major advantage of the present report is that it is based on advances in technology [16] that allow the bronchioles to be accurately located using microCT and then processed for histology. This makes it possible to study tissue remodelling and destruction in relation to inflammatory–immune cell infiltration into the terminal and preterminal bronchioles (i.e. TB, TB-1 and TB-2) defined by microCT. Consequently, the present data extend numerous histological reports on small airways disease in COPD [10–12, 14] by showing the wall thickening and luminal narrowing of TB-1 and the increased B-cell infiltration into TB-1 and TB-2 that are associated with loss of alveolar attachments.
Increased B-cell infiltration into small airways and parenchyma has been recognised as a major histological feature of COPD [10, 22–24], and gene expression analyses have suggested an association between emphysematous destruction and B-cell-related immune pathways [25, 26]. However, despite the fact that small airways, generally defined as bronchioles <2 mm in diameter, include relatively larger bronchioles (1–2 mm in diameter) as well as preterminal and terminal bronchioles (0.5–0.7 mm in diameter), no study has examined B-cell infiltration for specific generations of small airways. Moreover, although abnormalities in the terminal and preterminal bronchioles are important pathological lesions of COPD [14, 15], the mechanism by which an increase in B-cell infiltration contributes to structural changes in these airways is not understood. Thus, the present results showing an association between increased B-cell numbers and decreased alveolar attachments in TB-1 and TB-2 of the COPD lungs substantially extends the previous findings, and suggests that a persistent B-cell-mediated immune response causes destruction of alveolar attachments, which eventually promotes the progression of emphysema.
It should be also noted that the reduction in terminal bronchiole number, luminal narrowing, reduced numbers of alveolar attachments and increased B-cell infiltration in COPD lungs were present even in samples with mild emphysema (Lm <1000 µm). This suggests that these pathological changes in small airways may develop prior to the establishment of severe emphysematous destruction.
The microCT data showed reduced bronchiolar lengths in TB and TB-1 but not TB-2. We postulate that this shortening of airways is the consequence of axial retraction of the airway tree induced by breaks in the elastic fibres that run longitudinally along its entire length from the trachea to the most peripheral bronchioles and alveoli [27, 28]. The results also show an increase in wall thickness of TB, TB-1 and TB-2 without an increase in wall area and volume. This discrepancy between wall thickness and area is consistent with our recent report on the structure of preterminal bronchioles [15], and can be explained by the greater reduction in luminal areas than in total areas (i.e. wall and lumen area). In addition, the observation that the wall volumes and number of alveolar attachments of all these generations of small airways are reduced in COPD supports the hypothesis that the destruction of terminal and preterminal bronchioles as well as surrounding alveolar tissue is a major pathological feature of COPD [8, 10, 11, 14, 15].
The perimeter of the basement membrane or of the internal lumen has been used to estimate airway size because this length is unlikely to be influenced by tissue processing (such as the degree of lung inflation) or the extent of smooth muscle contraction [10, 20]. In the present study, we found that the length of basement membrane of terminal bronchioles is shorter in COPD than control lungs. This is consistent with a previous report by Bosken et al. [11], who observed a reduction in the internal perimeter of membranous bronchioles in COPD. Based on the result showing that the degree of luminal narrowing is greater in COPD than in controls, we speculate that in addition to the shortening of the basement membrane, excessive folding of the airways due to the formation and contraction of scar tissue during an abnormal repair process accounts for the reduction in luminal area in COPD. The MDCT measurements confirmed the reduced numbers of 2–2.5 mm diameter airways while the wall areas of the fifth-generation airways tended to be smaller in the COPD lungs (p=0.06). These reductions in airway count and wall area in COPD are consistent with recent MDCT reports on total airway counts [17] and airway dimensions [29, 30]. Because the airway tree was segmented based on the region growing method, the segmentation process would be terminated at a narrow point even when the lumen peripheral to this narrow point remained open [17]. The present finding of luminal narrowing of the fifth-generation airways without wall thickening leads us to speculate that the reduced number of 2–2.5 mm diameter airways reflects luminal narrowing of these airways in COPD.
Explanted lungs were inflated with a positive pressure of 30 cmH2O to achieve full inflation, then deflated and held at constant pressure (10 cmH2O) while frozen solid. We chose 10 cmH2O as the static pressure because 30 cmH2O pressure may cause overinflation and air leaking into the interstitium, and because there is only a relatively small (∼ 10%) reduction of lung volume in going from 30 to 10 cmH2O on the deflation limb of the pressure–volume curve [31, 32].
Some limitations of the present study need to be mentioned. This study provides information on airways only from patients with end-stage COPD treated by lung transplantation. It is possible that small airways pathology in mild and moderate COPD is different from that in end-stage COPD. As potential therapeutic interventions are mainly aimed at patients with mild to moderate COPD, the airway pathology of this population using their lung tissues obtained at surgery should be investigated in the future. The second limitation is that although the present study examined two generations proximal to the terminal bronchioles (0.88±0.20 mm in diameter in controls), more proximal bronchioles (1–2 mm in diameter) could not be identified because the size of the sample cores was limited. Finally, although LAA% was measured using MDCT scans of the explanted frozen lungs, it is not clear whether there is an influence of the process of explanting and freezing lungs on CT density. As the pulmonary blood volume was lost during the explanation process, this might have contributed to a reduction of lung density and an increased LAA%.
In conclusion, this study shows that small airways disease extends from 2 mm diameter airways to the terminal bronchioles in COPD. Further, the combination of microCT with histology provides important new information associating the infiltration of B-cells with the destruction of alveolar attachments to the outer wall of the preterminal bronchioles, which we postulate represents the site of the spread of this destructive process from the airway lumen and wall into the alveolar tissue.
Supplementary material
Supplementary Material
Please note: supplementary material is not edited by the Editorial Office, and is uploaded as it has been supplied by the author.
Supplementary material ERJ-01245-2017_Supplement
Disclosures
Acknowledgements
Author contributions are as follows: acquisition of the data, analysis and interpretation of information: N. Tanabe, D.M. Vasilescu, M. Kirby, H.O. Coxson, S.E. Verleden, B.M. Vanaudenaerde and D. Kinose. Involvement in the conception, hypothesis delineation, and design of the study: N. Tanabe, D.M. Vasilescu, H.O. Coxson, Y. Nakano, P.D. Paré and J.C. Hogg. Writing the article or substantial involvement in its revision before submission: N. Tanabe, D.M. Vasilescu, M. Kirby, H.O. Coxson, P.D. Paré and J.C. Hogg. All authors approved the final version of the manuscript.
Footnotes
This article has supplementary material available from erj.ersjournals.com
Support statement: US National Institute of Health (R01 HL122438), Canadian Institutes of Health Research (Thoracic imaging network of Canada), investigator-initiated contracts from the Grifols and Respivert corporations. Funding information for this article has been deposited with the Crossref Funder Registry.
Conflict of interest: Disclosures can be found alongside this article at erj.ersjournals.com
- Received June 22, 2017.
- Accepted November 30, 2017.
- Copyright ©ERS 2018
References


