


Abstract
There is little data about the use of different oxygen sources during assessment for long-term oxygen therapy (LTOT) and how this impacts upon blood oxygen tensions and prescribed flow rates.
Patients with chronic obstructive pulmonary disease (COPD), n=30, had assessments for LTOT using both an oxygen-concentrator and piped hospital oxygen (wall-oxygen) as supply sources. In addition, a random survey of 64 hospitals was conducted to determine what source of oxygen supply was used during assessments.
Wall-oxygen was used by 89% of hospitals to perform assessments. During assessments, the median oxygen flow required to achieve an arterial oxygen tension (Pa,O2) >8 kPa was significantly greater for an oxygen-concentrator than for wall-oxygen, with a median difference (range) in flow of 1 (0–3) L. This difference was most likely in those with an forced expiratory volume <30% of predicted. At an oxygen flow of 1 L·min−1, the mean Pa,O2 using an oxygen-concentrator was significantly lower than that of the wall-oxygen value, with a difference of 1.32±1.19 kPa (mean±sd).
The common practice of using wall-oxygen to perform assessments significantly underestimates the required oxygen-concentrator flow rate. This may have implications for the long-term effect of domiciliary oxygen therapy.
Domiciliary long-term oxygen therapy (LTOT) improves survival in patients with hypoxaemic chronic obstructive pulmonary disease (COPD) 1. In Europe and elsewhere there is great variability in oxygen concentrator prescribing habits 3–6. Regional and global guidelines for the prescription of LTOT advise the measurement of arterial blood gas levels whilst on supplemental oxygen to achieve an arterial oxygen tension (Pa,O2) of ≥8 kPa during an oxygen assessment 7–9. However, the guidelines are unclear as to how the oxygen should be sourced (concentrator versus hospital supply point). There are few data on what oxygen sources are used during assessments and how these sources may influence Pa,O2 and the prescribed flow rate during assessment for LTOT.
As a concentrator produces oxygen of a lower and more variable purity (average of 80% concentration at 5 L·min−1) 10, the current authors hypothesised that the source of oxygen would influence Pa,O2 and hence the flow rate at which LTOT is prescribed. Oxygen delivery from two different sources during LTOT assessments was therefore investigated. In this study the effects of a direct comparison between oxygen sources on Pa,O2 and prescribed flow rates, which has not previously been described, are demonstrated. Hospitals in a large city were also surveyed to determine which oxygen source was being used during assessments.
Methods
Study population and design
A cross-sectional study was undertaken to evaluate thePa,O2 at a given flow and that required to achieve a Pa,O2 >8 kPa, whilst using two sources of oxygen (concentrator and wall supplied). A total of 30 patients with COPD (Pa,O2 <8 kPa on room air), either on LTOT or attending hospital for LTOT assessment were recruited at the Royal Free and at Homerton University Hospital, London, UK. All patients had severe COPD (Mean±sd FEV1 of 31.62±12.99 per cent predicted), 63% were male and the mean age was 70±8.6 yrs. A random survey of London hospitals was undertaken to specifically determine what source of oxygen was used during assessments. The study was approved by both hospital ethics committees.
Oxygen source
The oxygen was delivered via nasal cannulae. The source of oxygen was either a hospital wall supply point delivering 100% piped oxygen (wall oxygen), or from a DeVilbiss 515UK oxygen concentrator (Oxygen Concentrator; Sunrise Medical, Wollaston, UK) and is the standard type of concentrator prescribed to patients in England. A single calibrated flow meter connected to the wall supply point was used in all patients. The flow rates delivered by both the wall attached and concentrator flow meters were verified with a Gapmeter type GTLK laboratory flowmeter kit (Platon®, Basingstoke, UK). The oxygen concentration (per cent purity) supplied by either source at different flows were measured (five recordings at each flow rate; Ohmeda 5120 Oxygen Analyser; Datex-Ohmeda, Louisville, CO, USA). In a subset of patients, paired flow-specific arterial blood gas samples (n=11 pairs) at different time points ≥1 h apart were performed to assess the reproducibly of the blood gas data, whilst oxygen saturations were monitored (n=13) to determine the time taken to reach steady state oxygen levels.
Long-term oxygen treatment assessment procedure
Arterial blood was taken from the radial artery after the application of a topical anaesthetic. Assessment was not done within 6 weeks of an exacerbation or any reported symptom deterioration. Subjects did not receive supplemental oxygen for ≥60 min before the procedure. Patients who received bronchodilators before or during the assessment were excluded from the study.
A baseline blood gas was first performed to confirm that the resting Pa,O2 on room air was <8 kPa. The subjects were then randomly assigned to receive either an oxygen concentrator or wall oxygen according to the algorithm in figure 1⇓. Step one entailed using one oxygen source while step two entailed repeating the assessment with the alternative source. During each increment in flow rate, the oxygen was administered for 30 min via nasal cannulae. There was a 30 min washout period between step one and step two. In order to limit the number of arterial stabs the highest achieved flow in step one was used as the starting flow in step two and flow rates were reduced by 1 L decrements if the initial Pa,O2 was >8 kPa. In this way every patient had the relevant flow reported to achieve a Pa,O2 >8 kPa for both wall and concentrator oxygen.

Algorithm used for long-term oxygen therapy assessments in patients with chronic obstructive pulmonary disease. PO2: partial pressue of oxygen; Pa,O2: arterial oxygen tension. #: oxygen for 30 min for each 1 L increment if flow rate with 30 min washout period between flow rates; ¶: if incremental flow rates were used in step 1, then the last highest flow was used to start the assessment with the alternative source in step 2.
Statistics
Flow and oxygen tensions were compared between methods of administration using the Wilcoxon signed rank test on the paired observations. In order to assess the effect of order of method, the paired treatment differences were compared between order groups using the Mann-Whitney U-test. Associations between variables were assessed using Spearman's correlation coefficient.
Results
Baseline data and survey results
Of the 64 hospitals surveyed there were 44 respondents (nine teaching hospitals). Only five (11%) hospitals (one teaching hospital) used an oxygen concentrator to perform assessments for LTOT.
On room air the mean±sd arterial Pa,O2 and carbon dioxide arterial tension were 6.59±0.87 kPa and 6.49±1.17 kPa, respectively. The concentrator delivered a significantly higher oxygen purity (mean±sd % oxygen concentration) at 1 L·min−1 than at 5 L·min−1 (94.4±0.5 versus 85.8±0.8, p=0.03). Comparatively, wall oxygen had a consistently high concentration (99.6±0.5 at 1 L·min−1 and 99.8±0.4 at 5 L·min−1); this was significantly higher than the concentrator oxygen purity at all flow rates (p=0.03 at 1–4 L·min−1 and p<0.0001 at 5 L·min−1). Analysis of samples for reproducibility in 11 paired flow specific blood gas samples indicated a mean inter-sample difference of 0.23 (±0.33) kPa. In all cases oxygen saturations reached steady state levels within 10 min.
Flow rates
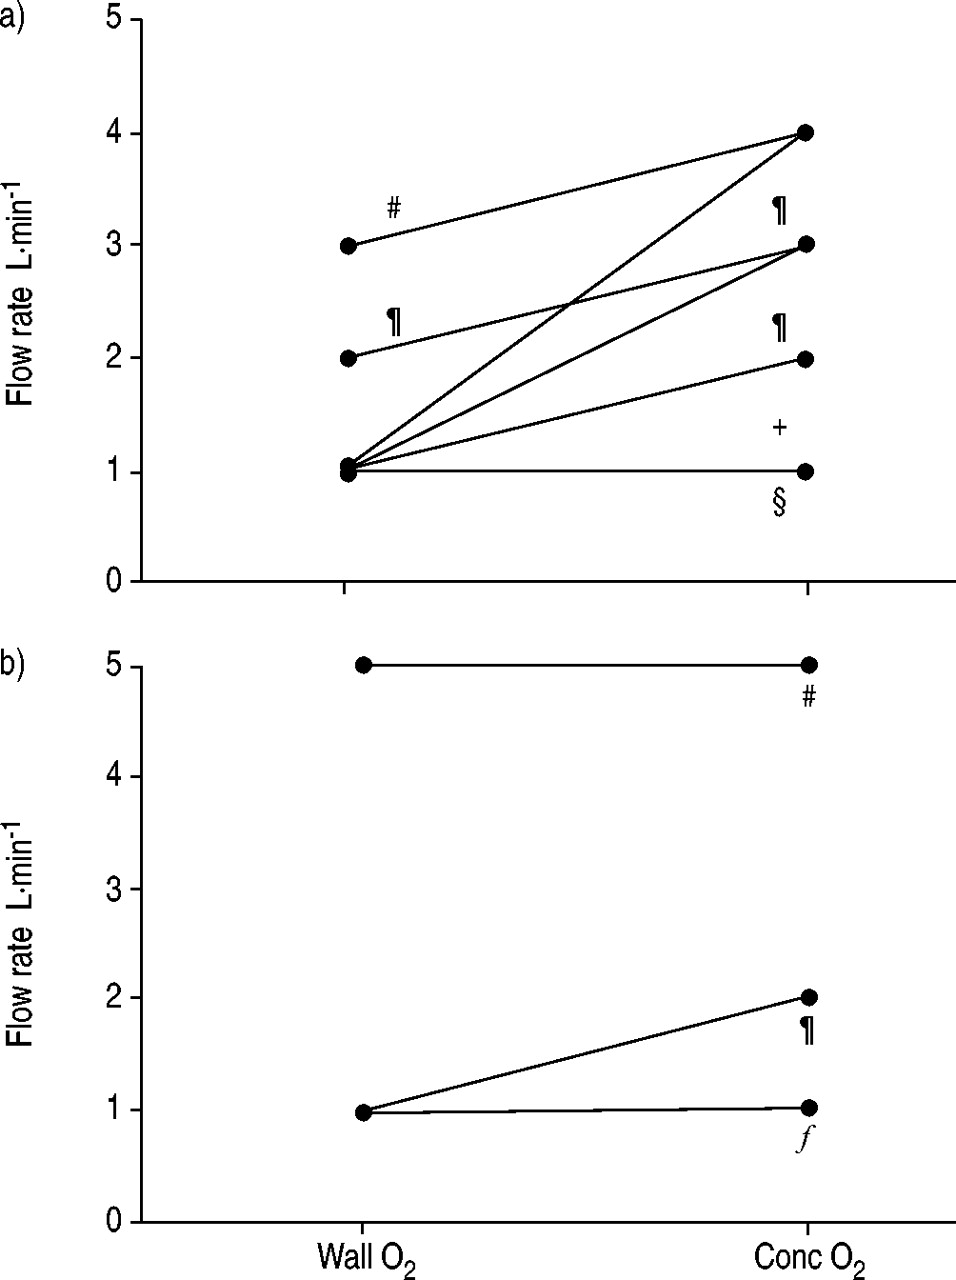
The median (range) flow required to achieve a Pa,O2 >8 kPa was 2 (2–5) L for concentrator oxygen. This was significantly greater than the flow of 1 (1–5) L required for wall oxygen (p<0.0002, Wilcoxon test), with a median difference in flow of 1 (0–3) L. Paired flow rates for each device are shown in figure 2⇓. There was no evidence of an order effect on flow (median rate was one in each period; p=0.76 for method-adjusted order effect using Mann-Whitney U-test). A total of 16 patients had a flow difference of at least 1 L. In two patients each the flow difference between the two sources was 2 and 3 L, respectively. There was a significant correlation between the severity of COPD (% predicted FEV1) and the flow difference (Spearman's r=0.7, p<0.001). A flow difference of >0 between the methods (concentrator minus wall oxygen) was present in 78% (14/18) of those with a FEV1 <30 per cent predicted versus 17% (2/12) of those with an FEV1 ≥30 per cent predicted (p=0.001, Chi-squared test); difference 61% (95% confidence interval 33–90).

Oxygen source specific flow rates required to achieve an arterial oxygen tension >8 kPa in patients with a) severe chronic obstructive pulmonary disease (COPD) (% predicted forced expiratory volume in one second (FEV1) <30%) and b) moderate COPD (% predicted FEV1 <30%). A significantly higher proportion of patients with severe disease (14/18) had an inter-source flow rate difference than those with milder disease (2/12, p=0.0001). For all patients (n=30) the median flow rate required to achieve a flow rate >8 kPa was less for wall oxygen (1 L·min−1) than for concentrator oxygen (2 L·min−1, p<0.0002). Wall O2: 100% oxygen supplied from a hospital wall supply point; Conc O2: concentrator supplied oxygen. #: n=1; ¶: n=2; +: n=7; §: n=4; f: n=9.
Arterial oxygen tensions
At an oxygen flow of 1 L·min−1 (n=23), the mean Pa,O2 using oxygen concentrator was 8.55±1.25 kPa. This was significantly lower than that of wall oxygen value of 9.86±1.42 kPa (p<0.0001), with a mean difference of 1.32±1.19 kPa (fig. 2⇑). At a concentrator flow rate of 1, 2 and 3 L·min−1 there were 11, six and four patients, respectively who had a Pa,O2<8 kPa, together with a flow rate difference of at least 1 L between oxygen sources.
Discussion
While it is known that the oxygen purity delivered by concentrators is flow dependent 10, the effects of different oxygen supply sources on prescribed flow rates, during assessment for LTOT, has not previously been studied. The current study indicated that most hospitals used a wall supply point when performing assessments; consequently Pa,O2 and prescribed flow were significantly underestimated. The results may partly explain the findings of surveys showing that a significant number of patients have their oxygen saturations under-corrected whilst on LTOT at home 5. Moreover, a significant proportion of concentrators deliver reduced oxygen concentrations with increased working duration of the machine 12. This underscores the importance of prescribing the correct concentrator flow rate at the initial assessment for LTOT.
Although it is unclear what mechanisms underlie the survival benefit of LTOT, this benefit has only been demonstrated to occur when enough oxygen is prescribed to achieve a Pa,O2 >8 kPa for ≥15 h·day−1 2. The current practice, which underestimates flow, may negate this benefit. The importance of the oxygen source should be specifically mentioned in future guidelines so as to improve awareness and change current practice.
The current study has shown that the lower flow and a higher Pa,O2 observed with wall oxygen is due to its high oxygen purity compared to the concentrator. A correlation between the severity of COPD and the flow rate difference was observed but was not seen between the severity of COPD and Pa,O2. This may be due to the differential effect of multiple factors, such as degree of polycythemia, varying degrees of pulmonary hypertension and the effects of other medical conditions on blood oxygen levels.
An unexpected finding was that only a minority of London hospitals used a concentrator to perform their assessments. This maybe because the guidelines are not explicit about their use or that wall oxygen is readily available and does not need to be specially purchased at an additional cost. However, in most cases it may simply be that clinicians are unaware that the source of oxygen may influence the prescribed flow rate.
How can under-correcting Pa,O2 be avoided? One possibility is to advocate the routine use of concentrators during assessments. The cost-effectiveness and practicality of such an approach requires further evaluation. Home monitoring of oxygen saturations may identify patients who have been under-corrected. However, these patients would need to be re-assessed to confirm an absence of a hypercapnic response during oxygen challenge at higher flow rates. To avoid re-assessment, it may be reasonable, in patients with an FEV1 <30% predicted to record responses at flow rates 1–2 L above what is required to produce a Pa,O2 >8 kPa. If future home monitoring visits then identify patients that are under-corrected the concentrator flow rate can simply be increased.
In conclusion, the current study shows that not using a concentrator during assessment for long-term oxygen treatment, significantly underestimates the required flow rate and this may have implications for the long-term effect of long-term oxygen treatment. These data should be taken into account when formulating future guidelines for the prescription of domiciliary oxygen.
Acknowledgments
The authors would like tothank B. Corea, Medical Electronics Dept, Homerton University Hospital for performing theflow rate measurements, S. Davidson from DeVilbiss for supplying the concentrator and C.M. Roberts from Whipps Cross University Hospital for ideas and advice.
- Received July 29, 2004.
- Accepted August 3, 2004.
- © ERS Journals Ltd
References


