Article Text

Abstract
Background Randomised control trial (RCT)-derived survival figures for acute exacerbation of chronic obstructive pulmonary disease admissions managed with non-invasive ventilation (NIV) have not been replicated in UK clinical audits. Subsequent guidelines have emphasised the need for timely NIV application.
Methods Data from the 2008 and 2014 national chronic obstructive pulmonary disease audits was used to analyse the association between time to NIV and mortality
Results 1032 patients received NIV in 2008, and 1612 in 2014. Overall mortality rates reduced between the audits from 24.9% in 2008 to 16.8% in 2014 but time to NIV lengthened. In 2014, 20.9% of patients received NIV within 60 min versus 24.9% in 2008 (p=0.001). The proportion of patients receiving NIV between 3 and 24 hours increased from 31.3% in 2008 to 39% in 2014 (p=0.001). Patients admitted with hypercapnic acidotic respiratory failure who received NIV within 3 hours had lower in-patient mortality than those who received NIV between 3 and 24 hours, 15.9% versus 18.4%, but this did not reach statistical significance (p=0.425), but acidotic patients receiving NIV >24 hours after admission had significantly higher mortality (28.9%, p=0.002). A second cohort admitted with hypercapnia but normal range pH, who developed later acidosis, had higher mortality (24.6%), compared with those acidotic on admission (18% p≤0.001) and an extremely high mortality when NIV was given >24 hours after admission (42.6%).
Conclusion Survival rates for those treated with NIV has improved between the two audits but remains lower than reported in RCTs. Patients who developed acidosis after admission and received NIV later in the hospital stay have even higher mortality and deserve further study and clinical attention.
- copd exacerbations
- non-invasive ventilation
- COPD epidemiology
- clinical epidemiology
- time to NIV
This is an open access article distributed in accordance with the Creative Commons Attribution Non Commercial (CC BY-NC 4.0) license, which permits others to distribute, remix, adapt, build upon this work non-commercially, and license their derivative works on different terms, provided the original work is properly cited, appropriate credit is given, any changes made indicated, and the use is non-commercial. See: http://creativecommons.org/licenses/by-nc/4.0/.
Statistics from Altmetric.com
Key messages
What is the association between time to non-invasive ventilation (NIV) and mortality in those admitted with an exacerbation of chronic obstructive pulmonary disease?
Patients who received NIV within 3 hours of admission for acidotic respiratory failure had the lowest mortality whereas those with non-acidotic hypercapnia (NAH), receiving NIV >24 hours after admission, had a mortality approaching 43%.
Although mortality of patients admitted with acidotic respiratory failure is falling, a greater awareness of patients with NAH is needed to improve outcomes.
Background
Patients with an acute exacerbation of chronic obstructive pulmonary disease (AECOPD) account for c.115 000 admissions annually in the UK and are the second most common reason for emergency medical admission.1 Approximately 20% of these patients will present with, or develop, acidotic hypercapnic respiratory failure, an independent indicator of mortality.2–4
Management of hypercapnic respiratory failure has been transformed by the use of non-invasive ventilation (NIV) with mortality rates half those of matched control groups in randomised controlled trials.5–8 Similar outcomes were not replicated in real life clinical practice when measured in the 2003 and 2008 UK National COPD Audits. These data stimulated the National Confidential Enquiry into Patient Outcome and Death (NCEPOD) which reviewed the real life use of NIV in clinical practice for all causes, and concluded that a mixture of suboptimal clinical care and patient factors accounted for differences in observed mortality.1 9 In 2017, an updated Cochrane review of NIV for the management of acute hypercapnic respiratory failure (AHRF) secondary to an excaerbation of chronic obstructive pulmonary disease (COPD) was published, with an average in-patient mortality of 9.9% across the 12 trials which reported in-patient mortality.10 In the 2008 UK national audit, the figure was 24.9%.11 Since then three sets of UK guidelines specific to the use of NIV have been published, initially recommending NIV be commenced within 3 hours of admission, or 1 hour of initial blood gas, and more recently reducing the time to 2 hours of admission.2 12–14 Following the NCEOPD report, which reviewed use of NIV, for any cause of hypercapnic respiratory failure, not exclusively patients with COPD, in all hospitals in the UK, the British Thoracic Society (BTS) have produced an NIV quality standard. One of these six standards recommends NIV should be commenced within 60 min of blood gas result associated with the clinical decision to provide NIV, and within 120 min of hospital arrival.15
There is, however, very little prospective trial data on the optimum time to NIV nor specific analysis of the use of NIV in patients admitted with an AECOPD from large scale audits. As Davies and Juniper describe, the 2008 COPD audit demonstrated a delay in starting NIV for 51% of patients and with a progressive fall in pre-NIV pH, which raised treatment delay as a potential factor in the high mortality rate observed.9 Others have described a greater percentage of deaths in those whom it took longer than 3 hours to initiate NIV.16 Although previous audit data and NCEPOD analysis have highlighted a trend towards higher mortality in people who receive delayed NIV, there is little analysis as to what extent delay impacts mortality and the optimum ‘door to mask time’, that is, from time of arrival of patients with acidotic hypercapnic respiratory failure to NIV administration.
We have therefore carried out an observational study using longitudinal, large scale national audit data from 2008 to 2014 to better define the relationship between time to NIV and mortality in patients admitted with an AECOPD and to explore patient factors that may account for differences in observed mortality rates.
Methods
A UK national audit, developed by the Royal College of Physicians and delivered jointly with the BTS, was undertaken in 2008 and an England and Wales only audit in 2014. All acute trusts admitting AECOPD were invited to participate. Both audits used cross sectional data collection methodology, with prospective case ascertainment and retrospective data collection.10 17 In summary in 2008, up to 60 consecutive admitted cases were collected prospectively at each unit in the period 3 March 2008 to 16 May 2008. The 2014 audit was conducted only in England and Wales, due to changes in commissioner funding, between 01 February 2014 and 30 April 2014 and all consecutive admissions during that period were eligible for inclusion with no maximum limit on numbers. Index cases readmitted during the audit period were excluded from repeated inclusion in either audit.
In both rounds a consultant respiratory physician on each site was responsible for case ascertainment and data entry. Case eligibility was defined as a senior decision maker’s clinical diagnosis of COPD exacerbation as the primary reason for hospital admission. A retrospective audit of records was made at 90 days ater the index admission and data entered to a bespoke on line webtool.11 17
In 2008, data were collected on a number of process items determined by a clinical best practice consensus group, from the existing national institute for clinical excellence (NICE) management guidelines, whereas in 2014 they were additionally mapped to the more recent NIV-specific guidelines.12 13 Patient outcomes of length of stay and mortality in hospital were also collected. In 2008, the audit proforma included data on timing of NIV, and how long after admission NIV was initiated. These were predefined time periods as follows:<30 min; 30–60 min; 1 hour to <3 hours; 3–24 hours; >24 hours. Few patients received NIV <30 min, and therefore for our analysis we amalgamated this group with those who received NIV between 30 and 60 min of admission as a <60 min from presentation group. In 2014, data were collected as a continuous variable on timings on NIV initiation from presentation. For comparison purposes, we have categorised this cohort into the same time groupings used for the 2008 audit.
The outcome measures were timing of NIV in association with arterial blood gas (ABG) parameters and in-patient mortality.
Data were analysed using STATA V.SE/13 software. Descriptive analysis of variable (demographic and clinical characteristics) was performed to explore the distribution of the data. Mean and SD were calculated for continuous variables and frequencies for categorical variables. Cross tabulation was run of the characteristics of the patients who received NIV across the two audits period 2008 and 2014 to identify association using χ2 test for categorical variables and t-test for continuous variables. Multivariate logistic regression analysis was employed to identify the independent association of time to NIV and inpatient mortality adjusted for age, gender, day of the week admission, smoking, albumin, urea, first and second ABGs and comorbidities.
This research was done without patient involvement. Patients were not invited to comment on the study design and were not consulted to develop patient relevant outcomes or interpret the results. Patients were not invited to contribute to the writing or editing of this document for readability or accuracy.
Results
In 2008, data were received from 232 hospitals (units) within 177 NHS Trusts. Nine thousand seven hundred and seventeen admissions (episodes) were recorded, with a median of 46 admissions per unit. Of these, 1943 (20%) were acidotic on admission. One thousand and thirty-two of these (53%) received NIV and were included in the analysis. In 2014, data were included from 199 units within 148 trusts, and a total of 13 414 admission episodes were recorded, of which 2286 (22%) were acidotic on admission. One thousand six hundred and twelve patients (70.5%) received NIV and were therfore included in our analysis. In 2014, the acidotic patients who did not recieve NIV had reasons for this recorded as; the patient declined (104); NIV was not available (25); patients were directly intubated (30); and in 325 the reason was not clearly documented. This information was not recorded in 2008.
Table 1 in the supplementary data sumarises the characteristics of patients who received NIV across these audit periods.
Supplemental material
Trends in NIV use and outcomes between the two audits
In-patient mortality fell from 24.9% in 2008 to 16.8% in 2014 (p≤0.001). Length of hospital stay for patients treated with NIV for AECOPD reduced significantly, 13.4 days in 2008 to 10.6 days in 2014 (p≤0.001). While the number of patients receiving NIV peaked on Mondays, we found no association between day of admission and time interval to receive NIV, or mortality.
Effect of time to initiation of NIV from presentation: door to mask time
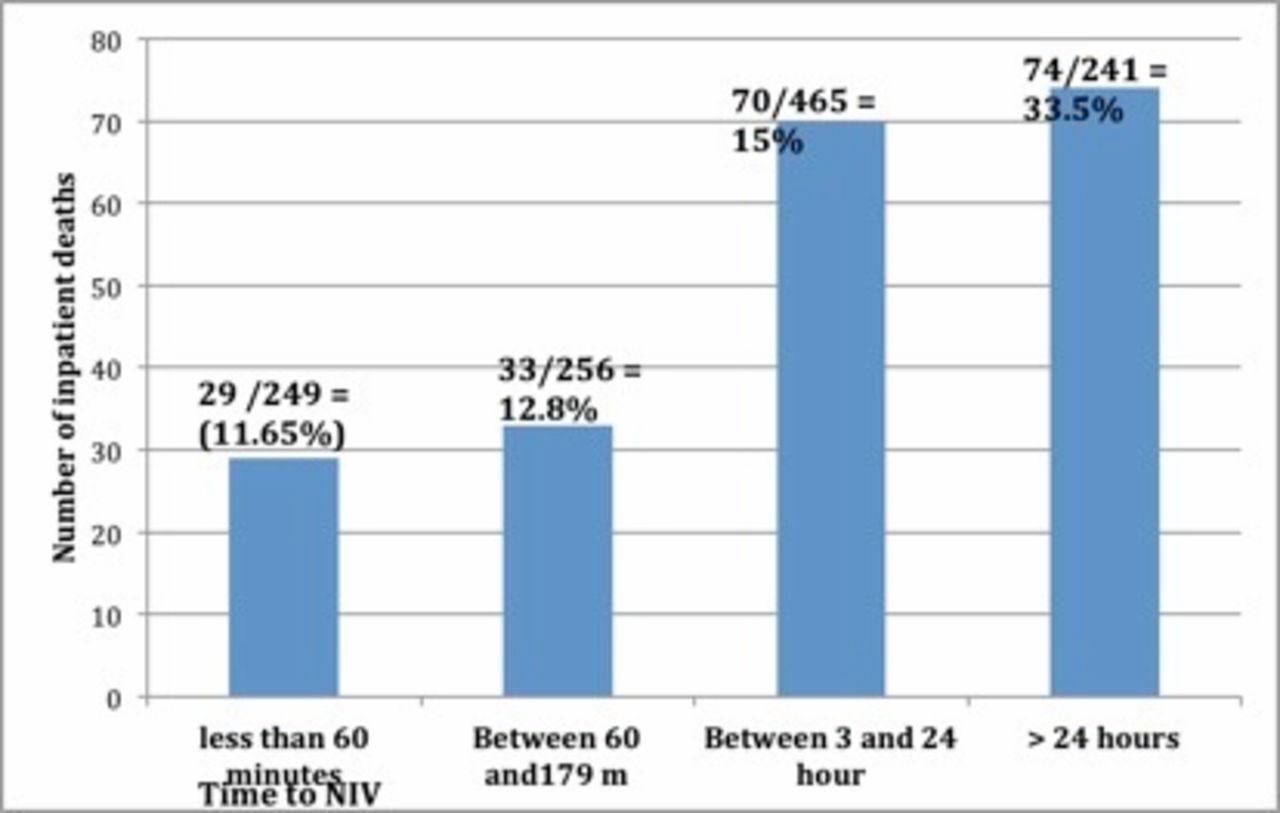
Initial analysis, which looked at timing of NIV received, highlighted that across both data sets, those who received NIV >24 hours after admission had a significantly higher mortality than those who received NIV within 24 hours (figure 1). On average, those who received NIV >24 hours postadmission were noted to be hypercapnic (mean pCo2 8.8), but significantly less than those who received NIV within 24 hours (pCo2=9.35). The mean pH of those who received NIV >24 hours postadmission was 7.4 across both audits, that is, non-acidotic on admission. The average pH of those who received NIV within 24 hours was 7.26. Patients receiving NIV >24 hours were significantly more hypoxic than those who received NIV <3 hours (p=0.0003 in 2014), but there was no significant difference in HCO3 across the audits tables 1 and 2 and 2 in online supplementary data).
Supplemental material

Hours from admission to NIV among inpatients who died in hospital in 2014. NIV, non-invasive ventilation.
Comparison of patient’s characteristics by time to NIV across the two audits period 2008 and 2014
Combined data from both audits highlighting the mortality rate in acidotic versus non-acidotic patients, according to time to NIV
These data suggest there are two distinct groups, those who were admitted with acidotic hypercapnic respiratory failure and a second group with hypercapnia but had a pH within the normal range (non-acidotic hypercapnia, NAH), but developed acidosis later in their admission. Mortality in the cohort of patients admitted with NAH was significantly higher than those admitted with acidotic respiratory failure, 24.6% versus 18% (p=0.009) when the two audit cohorts are combined, but this significance is lost in the 2014 audit with mortality at 20% in NAH and 16% in AHRF (p=0.06).
A subanalysis was performed to investigate the relationship between admittting pH, timing of NIV and mortality, across both audit sets (table 2). Among those admitted with acidotic hypercapnic respiratory failure, there was a trend to increased mortality in those who received NIV 3–24 hours after admission (18.4%) compared with those who received NIV within 3 hours of admission (15.9%), although this did not reach statistical significance (p=0.425). Regardless of admisison pH, those who received NIV >24 hours postadmission had a significantly higher mortality in both NAH and acidotic hypercapnic respiratiory failure groups. However, those admitted with NAH that received NIV >24 hours postadmission had a significantly higher mortality (42.6%) compared with those admitted with AHRF and received NIV >24 hours postadmission (28.9%, p=0.009).
Improvements in care processes were observed in 2014, with significantly more patients having oxygen prescribed; more patients receiving antibiotics within 24 hours; more survivors were discharged by a respiratory consultant and with an early supported discharge scheme (table 1, supplement). Multi-regression analysis of mortality in both those patients who received NIV within 24 hours of admission, and those who received it >24 hours after admission, including patient charcteristics and process of care measures, revealed only age as a factor in both groups and this as a relatively low increased risk (OR 1.034 in the early (CI 1.016 to 1.053) and 1.048 (CI 1.011 to 1.087)) in the NAH group. Blood urea on admission was found to be a second factor in the early but not the later acidosis NIV group (OR 1.064; CI 1.038 to 1.090) and pH in the non-acidotic on admission, that is, later acidosis group was not significantly associated with increased mortality when adjusted for age; gender; day of the week; smoking; albumin; urea; pO2; HCO3; pCO2—on both first and second ABG, and comorbidities (OR 2.74; CI 1.137 to 6.602, p=0.025). Patients included in both audits were older, had multiple comorbidties, included patients with radiological consolidation, and the AHRF cohort had more severe admission pH values than those included in most of the RCTs cited in the recent Cochrane review.
Discussion
Mortality rates in patients with AECOPD receiving NIV have improved across the two audit periods but remain worse than those reported in RCTs. There are a number of possible reasons for this. Mortality increased with increasing time to NIV following presentation and was particularly high in those receiving NIV >24 hours after admission. Just over half of the patients with AHRF on admisson received NIV within the recommended 3-hour period. In our analysis, patients with acidosis on admission receiving NIV within 3 hours had lower mortality than those receiving NIV between 3 and 24 hours into the admission, although this was statistically non-significant. Those receiving NIV post 24 hours had a much higher mortality (in 2014, for those admitted with acidotic respiratory failure, NIV <3 hours = 12.3%, 3–24 hours= 15.1%, >24 hours = 33.5%) which was statistically significant (p≤0.001).
Second, the charactersitics of patients receiving NIV differ from those included in the RCTs and most notably we highlight a group of patients admitted with NAH who then delvelop acidosis later in the admission and receive NIV at a late stage. This group are not included in the RCTs and have a higher mortality than those presenting with AHRF (24.6% vs 18%, p=0.001) particularly when given NIV later than 24 hours into the admission. This second group of patients who develop acidosis after admission are not well studied and do not have a solid evidence base on which to inform NIV management2 4 18 . What the audit data tell us is that they have similar patient characteristics to those admitted with acidotic hypercapnic respiratory failure except their admission blood gases show a pH within the normal range and their PaCO2 levels are not raised to the same degree as the admission acidotic patients. The higher mortality in this patient cohort is also unexplained but it is possible that the recognition of their deterioration may be delayed as is subsequent NIV use. The average time between first and second ABG is 1.8 hours in the acidotic group and 5.6 hours in the non-acidotic (p<0.001). It is the second ABG that demonstrates the acidotic hypercapnia picture, and the median length of time from the second ABG to NIV administration in this ‘later acidotic’ cohort was 2 hours. It is also possible that some of this group may have been more appropriately managed as end of life rather than with NIV. However, even when this latter group are excluded from the analysis, the mortality of patients admitted with acidotic hypercapnic respiratory failure remains higher (18%) than that of the RCTs (9.9%).
Patient selection is a further potential explanation for both the difference in mortality between the longitudinal data and the discrepency with the RCT results. Previous audit papers have flagged that many COPD patients are treated outside the evidence base of the RCTs.4 17–20 In the UK, nearly two-thirds of patients with COPD treated with acute, ward-based NIV have NIV documented as their ‘ceiling of treatment’ which also may also account for the differences observed.21–23 Patients in both these audits were older (average 71.1years) than those reported in the Cochrane review (66.8 years) of NIV in AECOPD patients admitted with hypercapnic respiratory acidosis.10 Most audit patients had comorbid illness and notably radiological consolidation consistent with pneumonia, known to increase mortaity and excluded from the RCTs, and was present in over a fifth of the patients managed with NIV in the two audits.3 4 10
The mortality rates we report from 2014 are approaching those of the RCTs when only looking at those with acidotic respiratory failure who received NIV within 3 hours of admission (12.3% in 2014 audit vs 9.9% in RCT), but are still poorer. We have also found that patients in real world practice are older, have multiple comorbdities and are more acidotic than those in research trials. It is likely that some of these reported factors may account for the poorer outcomes of patients managed in real life settings compared with the RCTs.
In contrast, it is difficult to hypothesise that these factors account for the improvement in mortality seen between the two audit periods. It may be that better adherence to guideline recommendations not recorded in this audit, for example, NIV pressures used, ventilator asynchrony, managed agitation have made a significant contribution to impove outcomes.24–26 There have been significant improvements in processes of general COPD care between 2008 and 2014 including a higher proprotion of patients receiving antibiotics within 24 hours and the proportion of patients with controlled oxygen prescribed both which have been demonstrated elsewhere to improve outcomes.4 19 27–32 Notably, PaO2 ABG values in the 2014 cohort were lower than in 2008 (table 1).
Third, there has been a significant increase in the number of patients being discharged by a respiratory consultant, from 75% in 2008 to 85% in 2014. Previous data have shown that mortality rates in both in-patient and at 90 days were lower in units with more respiratory staff/1000 beds.33 Units with 4 or more respiratory consultants were associated with the best outcomes.33
There are a number of strengths and weaknesses in this paper. Audits are not designed to answer research questions and the reasons for the reduction in mortality observed in the 2014 audit and the difference in reported mortality from the RCTs and the audits are not certain. The 2008 and 2014 data sets had some significant differences, so that exact comparisons cannot be made and the latter audit did not include Scotland or Northern Ireland. The interpretation of the audit proforma and the accuracy of some of the data collected in different hospitals is questionable as it is not subject to the usual rigor of research studies hence we have focused on trends. Another limitation is that a proportion of patients were excluded in the audit, whom did not receive NIV at all, and the audit data are not descript enough to explain these exclusions, which may have a bearing on the outcomes.
However, these data do reflect real life clinical practice wheras clinical trials tend to both add factors that are not reproducible outside of studies and exclude more complex patients as subjects. The combined numbers included in this analysis are greater than those of the combined RCTs cited in the Cochrane review.10 The application of NIV to real life clinical settings is also an opportunity to observe the translation of research into practice and to report clinical practice challenges that can inform further research. Particulary with regard to the cohort of patients admitted with NAH, and whether closer monitoring and/or more aggressive treatment of hypercapnia improves outcomes in this group.18 34 Data were not collected on any previous admissions with AECOPD that required treatment with acute NIV. Current data for the use of domiciliary NIV for persistant hypercapnia in COPD patients are mixed, with some trials reporting a mortality benefit at 1 year.35–37 Further research is needed in this area to improve the outcomes for those with NAH on admission.
This study suggests that real world clinical practice still falls short of recommended standards of time from presentation to application of NIV. This, together with the application of NIV to a significant proportion of patients who were exluded from the RCT evidence base, may well explain the discrepency in observed mortality. We suggest that further research should be conducted to replicate real world clinical practice including the inclusion of older subjects with comorbdities and presentations with severer acidosis. For clinicians in practice, more timely application of NIV to those admitted with AHRF and closer monitoring, with clear treatment escalation plans and appropriate ceilings of care for those admitted with NAH, should help identify deteriorating patients requiring earlier NIV, while ensuring those better managed through an end of life pathway are not subject to uncessary interventions of low value.
References
Footnotes
Contributors We confirm the authors have all contributed to this paper in the following ways: conception and design of the work: CMR, RS, MCS and AJ. Data collection: VM. Data analysis and interpretation: AJ, CMR, VM, RS and MCS. Drafting the article: AJ and CMR. Critical revision of the article: AJ, CMR, RS and MCS. Final approval of the version to be published: AJ, RS, VM, MCS and RS.
Funding The National COPD audit programme was funded by NHS England and the Welsh Government via the Healthcare Quality Improvement Partnership. However, no funding was received for the analysis and writing of this article.
Competing interests None declared.
Patient consent for publication Not required.
Ethics approval This is analysis of audit data and research of clinical practice standards compared to national guidelines, therefore does not require REC approval.
Provenance and peer review Not commissioned; externally peer reviewed.
Data availability statement Data are available upon reasonable request. All data relevant to the study are included in the article or uploaded as supplementary information.