Article Text

Abstract
Objectives: To evaluate the reliability and validity of measures taken during the Chester step test (CST) used to predict VO2max and prescribe subsequent exercise.
Methods: The CST was performed twice on separate days by 7 males and 6 females aged 22.4 (SD 4.6) years. Heart rate (HR), ratings of perceived exertion (RPE), and oxygen uptake (VO2) were measured at each stage of the CST.
Results: RPE, HR, and actual VO2 were the same at each stage for both trials but each of these measures was significantly different between CST stages (p<0.0005). Intertrial bias ±95% limits of agreement (95% LoA) of HR reached acceptable limits at CST stage IV (−2±10 beats/min) and for RPE at stages III (0.2±1.4) and IV (0.5±1.9). Age estimated HRmax significantly overestimated actual HRmax of 5 beats/min (p = 0.016) and the 95% LoA showed that this error could range from an underestimation of 17 beats/min to an overestimation of 7 beats/min. Estimated versus actual VO2 at each CST stage during both trials showed errors ranging between 11% and 19%. Trial 1 underestimated actual VO2max by 2.8 ml/kg/min (p = 0.006) and trial 2 by 1.6 ml/kg/min (not significant). The intertrial agreement in predicted VO2max was relatively narrow with a bias ±95% LoA of −0.8±3.7 ml/kg/min. The RPE and %HRmax (actual) correlation improved with a second trial. At all CST stages in trial 2 RPE:%HRmax coefficients were significant with the highest correlations at CST stages III (r = 0.78) and IV (r = 0.84).
Conclusion: CST VO2max prediction validity is questioned but the CST is reliable on a test-retest basis. VO2max prediction error is due more to VO2 estimation error at each CST stage compared with error in age estimated HRmax. The HR/RPE relation at >50% VO2max reliably represents the recommended intensity for developing cardiorespiratory fitness, but only when a practice trial of the CST is first performed.
- ratings of perceived exertion
- heart rate
- oxygen uptake
- analysis of agreement
- CST, Chester step test
- RPE, ratings of perceived exertion
Statistics from Altmetric.com
The Chester step test (CST) was originally developed by Kevin Sykes at University College Chester to assess aerobic fitness by predicting maximal aerobic power (VO2max) in fire brigades in Britain, Europe, USA, and Asia, and more recently for work with airport firefighters, the ambulance service, health authorities, and corporate institutions.1 It also features in commercial health and fitness assessment packages and most noticeably one in particular (Fitech Pty Ltd, Australia; www.fitech.com.au). The CST is one of many tests designed to provide a safe and practical means of assessing aerobic fitness under submaximal conditions. Examples of other similar tests include the Astrand-Ryhming nomogram cycle ergometer protocol,2 the American College of Sports Medicine protocols for cycle ergometry and treadmill,3 and the Canadian standardised step test of fitness.4 The limited equipment needed (step, heart rate monitor, portable cassette or compact disk player, and perceived exertion scale) makes the CST very portable and requirements for space are minimal, which is advantageous compared with similar protocols using treadmills, shuttle walks, or cycle ergometers.
To date, the validity of the CST has only been assessed in terms of its ability to predict VO2max compared with an actual VO2max, with the error in this ranging from 5% to 15%.5 The reliability of the CST predicted VO2max, on a test-retest basis, has previously been assessed using the bias ±95% LoA6 but this study did not assess the CST’s validity via analysis of agreement between actual and predicted VO2max. Furthermore, no study to date has performed an in depth analysis of the reliability and validity of each measured component of the CST, which includes: heart rate, rating of perceived exertion (RPE), age estimated maximal heart rate (HRmax), and the estimated oxygen cost (VO2) of each testing stage. Analysing these components may provide clues to the factors that lead to the error in the predicted VO2max and provide information on how reliable these component measures are for prescribing subsequent exercise.
The CST prediction of VO2max is based on the extrapolation of a “line of best fit”, which passes through the submaximal heart rate responses for each stepping stage, up to a level which equals the participant’s age estimated HRmax. At this point a vertical line is dropped down to the x axis of the graph, which represents the estimated VO2 for box stepping exercise. The assumptions of this predictive procedure include the following: that a linear relation exists between each stage of the CST with heart rate and with VO2; that HRmax and VO2max are coinciding events; and that maximal heart rate is equal to 220 minus the participant’s age. The stepping intensity is a function of the step height and the stepping rate. Table 1 provides a summary of the estimated oxygen cost (VO2) for each of the five stages of the CST, for four different step heights. Thus, the present CST testing package (1998 onwards) is designed to be flexible in assessing people with a wide range of absolute aerobic fitness levels. This flexibility of the test has been achieved by the testing package having standardised criteria for choosing a step height, which relates to the clients’ age and exercise training or physical activity history. Regardless of step height, the stepping rate for each stage is always the same (table 1). The stepping rate is set by a recorded metronome and guided verbal instructions, which are played on a cassette tape or compact disc.
The five stages of the Chester step test and the oxygen cost estimates (VO2) for varying step heights (m) and stepping rates (steps/min)
RPE is used in conjunction with heart rate as an end point of the testing procedure as well as being recommended in the CST manual as a guide to prescribe the intensity of subsequent exercise. When the participant reaches 80% of age estimated HRmax and/or an RPE of 14 on Borg’s 6–20 scale,7 he/she is told to stop the test.
The CST therefore aims to fulfil two main purposes: (1) to predict VO2max as a means of grading a person’s aerobic power, where this score can also act as a baseline against which improvement can be measured, and (2) the CST instruction manual recommends that the intensity component of a subsequent exercise prescription can be set by getting clients to associate their exercise training activities with the RPE they experienced during the CST at 60% and 80% of HRmax. It may even be considered that because the VO2 (estimated) at a given CST stage is known, other activities with a similar VO2 can be gauged in accordance with the estimates outlined by Ainsworth et al.8 These recommendations, however, assume that the relation between RPE, %HRmax, and a given VO2 are reliable, valid, and transferable to other activities.
With regard to using CST data to prescribe subsequent exercise, no studies have been performed to assess the transferability of the heart rate–RPE relation to other modes of activity. In order to do so, a two stage process is required. Firstly, an assessment of the reliability of the heart rate–RPE relation during incremental box stepping activity is required. Secondly, if the first assumption is met, then an assessment can be made to evaluate whether similar exercise intensities for a given heart rate–RPE relation during other modes of exercise can be assumed. This study includes the aim to assess the above first assumption, but we feel that the above second assumption is a whole study in itself. It is already known that for a given RPE during exercise with a variety of exercise modes or machines, there are significant differences in heart rate, %HRmax, VO2, %VO2max, and blood lactate.13–16 Such results might seem to preclude transferability but one must be reminded that these evaluations were performed during production mode RPE (RPE as the independent, controlling variable) and the assessment of RPE within this study is in estimation mode (RPE as dependent, response variable).
Other studies still required, which involve box stepping, include assessing the heart rate–RPE relation and prescriptive validity in participants being treated with β adrenergic blocking medication (β blockers). For these individuals, due to the blunting of normal heart rate response by β blockers, VO2max cannot be predicted from the present CST procedure. However, because it is known that at intensities <65%VO2max, the relation between RPE and work rate is unaltered by β blockade,9–12 this may still allow the CST to show an improvement in fitness from reductions in heart and RPE for a given CST stage.
Little has been reported on the reliability of heart rate and RPE, using analysis of agreement, during box stepping exercise. Efficacy and safety problems associated with potential inaccuracies in the reliability and validity of an age estimated HRmax and of RPE during the CST, could include clients either stopping the test prematurely or worse, overexerting themselves. Other problems affected by reliability include results showing an improvement in VO2max, when in fact the measured reduction in heart rate or RPE for a given CST stage that leads to this result is actually a function of a systematic error or bias, owing to factors such as practice or familiarisation with a testing procedure.17
The reliability and validity of the estimated VO2 at each of the CST stages has also not been evaluated using analysis of agreement. Collectively, the reliability and validity of heart rate, estimated HRmax, and estimated VO2 for each CST stage all ultimately contribute to the accuracy of the predicted VO2max.
The first aim of this study was therefore to assess the reliability of the following CST measures: predicted VO2max, heart rate, RPE, and actual VO2 at each CST stage, and the correlation between RPE and %HRmax and the correlation between RPE and %VO2max at each CST stage. The second aim of this study was to assess the validity of the measures taken from the CST by analysing the following factors: the age estimated versus the actual HRmax; the predicted versus the actual VO2max; the estimated versus actual VO2 at each CST stage, and the ability of a given %VO2max to be associated with its typically recommended RPE and %HRmax.3,18 Together these two aims will evaluate the validity of the CST in predicting VO2max, and provide a first step towards validating the use of the CST’s heart rate–RPE relation to prescribe aerobic exercise.
METHODS
Participants and study design
Following formal ethical approval, written informed consent, and completion of a health screening physical activity readiness questionnaire (PAR-Q),3 15 university students volunteered to participate. Two participants were unable to complete both trials because of social obligations and thus 13 participants (seven male and six female) completed the full study. Descriptive data on the participants are summarised in table 2. The participants were all active in exercise or recreational sport, with participation frequencies of 1–3 times per week. None was a highly trained competitive athlete. Each participant performed the CST twice on two separate days at the same time of day, with the second test occurring 5–7 days after the first test. Within 24 hours before each test, participants ensured that eating patterns and food types eaten were the same, and that they did not participate in vigorous sport or exercise. Based on the CST manual recommendations1 for age and activity history, a 0.30 m step was chosen for this group of participants. The one procedure that was altered was the end point of the test, which was raised to 90% of age predicted HRmax and/or RPE 17. This was done in order to get VO2 measures from as many stages of the CST as possible. VO2max was, however, predicted from the CST manual data sheet,1 using the points at or below the 80% of age estimated HRmax and employing the “line of best fit” linear graph extrapolation technique through the heart rates recorded at the end of each completed stage and the age estimated HRmax. All participants performed the CST using the movement techniques described in the CST manual and instructions on the cassette tape.
Description of participants
On the third day, less than seven days after the second CST trial, all participants performed an incremental treadmill test to determine actual HRmax and VO2max in line with standardised procedures.3,19 The analysis equipment is explained in next section. Treadmill intensity for the maximal test was graduated in 2 minute intervals so as to reflect the stage intervals of the CST, except that participants continued on until volitional fatigue. It is typical for maximal tests to be performed at the beginning of a study’s data collection process. We deliberately chose to test this at the end to prevent the participants from being familiarised with RPE under incremental maximal test conditions. In typical field applications of the CST, participants would not have the opportunity to be familiarised with RPE in this way, nor would it be safe or efficacious in many settings to carry out a maximal test. This aimed to promote the “ecological validity” of the study. Simply omitting the use of RPE in an initial incremental and maximal test would not have been in keeping with recommended practice. Even if RPE measurements were omitted from an initial incremental and maximal exercise test, participants would likely retain a recent experience of relating their psychophysical responses to a wide range of exercise intensities. This could influence their ability to rate exertion with subsequent exercise (for example, performing the CST).
Equipment and data collection
Heart rate, monitored via a wireless radiotelemetry chest strap and wristwatch system (Polar Electro, Kempele, Finland) and RPE using Borg’s 6–20 scale,7 were recorded in the last 15 seconds of each testing stage. In the interest of participants’ comfort and acknowledging their perceived physical state, they were given the option to report an RPE at any time. Heart rate data were kept out of view of the participants so they would not be able to associate these values with their RPE responses, which could influence their RPE–heart rate relation in the second test. Participants were instructed in the use of RPE before each test using standardised instructions7,20 according to the following procedure:
-
clarification that participants understood the definition of RPE
-
“anchoring” the top and bottom ratings to previously experienced sensations of no exertion at all and extremely hard/maximal exertion
-
being made aware of giving an “all over” integrated rating which incorporated both peripheral muscular and central cardiorespiratory sensations
-
focusing attention on the verbal descriptors of the scale as much as on the numerical values
-
understanding that there was no right or wrong rating, and that it represented how hard the subject felt he/she was working at the time of giving the rating
-
having the scale in full view at all times.
Respiratory analysis
During each CST trial and during the maximal treadmill test the actual oxygen cost (VO2; ml/kg/min) of each testing stage was measured continuously via an online expired air analysis system (CPX/D Cardiopulmonary Exercise System, Medical Graphics, Minneapolis, MN, USA), which employed a low resistance pneumotach and a Pitot tube flow meter. Sampling frequency was set using an 8 second average technique, which has been shown to optimise acceptable error variability.21 The system was calibrated before testing each subject using a 3 l syringe for flow volumes across a wide range of flow rates and known gases for CO2 and O2. For the CST trials, the reported VO2 was the average over the last 30 seconds of each CST stage. The estimated oxygen cost (VO2 in ml/kg/min) for each stage of the CST was taken from version three of the CST resource manual.1 The source of these VO2 estimations is not reported within the manual but they agree to within 1.5 ml/kg/min of the estimation calculation for stepping outlined by the American College of Sports Medicine.3 In either case, estimated VO2 is a function of the step height (m) and stepping rate (steps/min). In relation to this study, where a 0.30 m step was used, the estimated VO2 values for CST stages I through V were 16, 21, 27, 32, and 37 ml/kg/min, respectively (table 1).
STATISTICAL ANALYSES
Statistical significance in all tests was set at p⩽0.05 and all analyses were performed using SPSS 10 for Windows (SPSS Inc, Chicago, IL, USA). The inter-CST stage and intertrial differences for each of the three responses (RPE, heart rate, and VO2) were assessed using a two factor (trial by testing stage) repeated measures analysis of variance (ANOVA).
Reliability
Intertrial reliability for each of the RPE, heart rate, and VO2 responses at each CST stage was evaluated using the bias ±95% limits of agreement (LoA).22 The same analysis was performed to assess the test-retest reliability of the CST predicted VO2max.
Validity
Agreement between age estimated HRmax and actual HRmax and between CST predicted VO2max and actual VO2max were assessed using the bias ±95% LoA. A paired t test was performed to assess whether the bias between age estimated and actual HRmax or CST predicted and actual VO2max was statistically significant.
Agreement between the estimated and actual VO2 values at each CST stage was assessed using the bias ±95% LoA. A one sample t test was used to assess whether the bias between estimated VO2 and actual VO2, at each CST stage, was statistically significant. The one sample t test is employed when a mean value from a sample is compared against a specified criterion value. In this case, the criterion values were the estimated VO2 values of 16, 21, 27, 32, and 37 ml/kg/min, for CST stages I, II, III, IV, and V, respectively (table 1). When this t test was performed on a number of pairwise comparisons, a Bonferroni correction was used to reduce alpha to control the type I error rate. The Bonferroni correction is determined by the following:

where x is the number of comparisons and y is the level to which alpha is reduced.
The relation between RPE and %HRmax and between RPE and %VO2max at each CST stage for each of the two trials was determined with a Pearson’s product moment correlation coefficient. However, correlations coefficients, especially with small sample sizes, can be affected by the spread of the data and these data will therefore be interpreted in light of the variability (standard deviation) of the three variables (RPE, %HRmax, and %VO2max). The ability of RPE to represent a given %HRmax or %VO2max, was evaluated in comparison to the American College of Sports Medicine exercise prescription recommendations.18
Comparing estimated maximal heart rate error with estimated VO2 error
To assess which of the two variables—age estimated HRmax or estimated VO2 at each CST stage—potentially contributes more to the error in the prediction of VO2max, the following ratio was calculated. For error in the estimated HRmax, the 95% LoA between the age estimated HRmax and the actual HRmax was divided by the group’s mean actual HRmax. This ratio will be noted as the 95% LoA to actual HRmax ratio. Similarly, for determining the error in the estimated VO2 at each CST stage, the 95% LoA between the estimated VO2 and the actual VO2 at each stage was divided by the group’s mean actual VO2 at each CST stage. This ratio will be noted as the 95% LoA to actual VO2 ratio. Both these ratios will be presented as a percentage value.
95% limits of agreement and heteroscedasticity
As recommended by Nevill and Atkinson,23 heteroscedasticity of the 95% LoA analyses was assessed by calculating Pearson’s correlation coefficients between the intertrial differences of heart rate or RPE or VO2 and the corresponding intertrial average of heart rate or RPE or VO2. For example, intertrial VO2 differences (trial 1 VO2 minus trial 2 VO2) were correlated with the intertrial VO2 averages ((trial 1 VO2 plus trial 2 VO2) divided by 2). A significant correlation (p⩽0.05) between these two measures would confirm heteroscedasticity.
RESULTS
General analyses
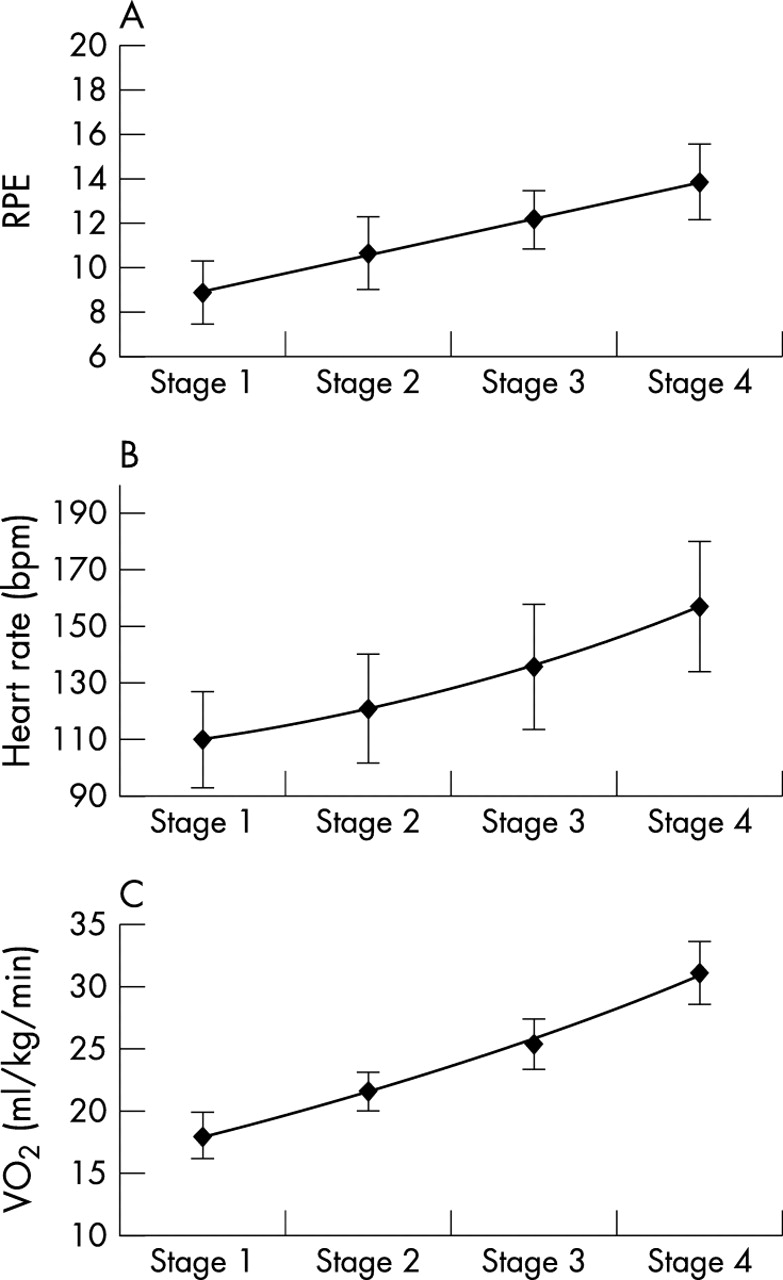
Seven participants were able to perform all five CST stages, and the remaining six participants completed four stages of the CST. With the exception of the predicted VO2max scores, all analyses for all 13 participants have been based on data from stages I to IV. Table 2 summarises the descriptive data of the participants. During trial 2 it was not possible to predict VO2max in one of the participants because of heart rate monitoring equipment error, and analyses using heart rate from this trial are therefore based on 12 participants. Figures 1A–C and 2A–C summarise the group mean RPE, heart rate, and VO2 responses at CST stages I to IV for trial 1 and trial 2. These graphs show a linear RPE response but a positively growing curvilinear response for heart rate and VO2 with each progressive CST stage. For trials 1 and 2 (figs 1 and 2), ANOVA revealed no significant intertrial differences in either RPE (F1,12 = 0.414, p = 0.532), heart rate (F1,11 = 0.423, p = 0.529) or VO2 (F1,12 = 0.12, p = 0.740). However, there were significant differences between the four CST stages in RPE (F3,36 = 61.3, p<0.0005), heart rate (F3,33 = 209.9, p<0.0005), and VO2 (F3,36 = 761.29, p<0.0005). During trial 1, neither body mass, height, or body mass index (BMI) were significantly correlated with VO2 for any of the four CST stages. However, during trial 2 at stage IV, weight was positively and significantly correlated with VO2 (r = 0.57, p = 0.042) and the same was true for height at all stages (stage I: r = 0.65, p = 0.017; stage II: r = 0.58, p = 0.037; stage III: r = 0.73, p = 0.005, and stage IV: r = 0.72, p = 0.006). In all cases where the 95% LoA was calculated, the data did not display heteroscedasticity.

Trial 1: (A) RPE at each Chester step test stage; (B) heart rate at each Chester step test stage; (C) VO2 at each Chester step test stage. Values presented as mean (SD) (error bars).
Trial 2: (A) RPE at each Chester step test stage; (B) heart rate at each Chester step test stage; (C) VO2 at each Chester step test stage. Values presented as mean (SD) (error bars).
Assessments of reliability
The bias ±95% LoA of the predicted VO2max between trial 1 and trial 2 was 0.8 (3.7) ml/kg/min. This bias was not statistically significant (table 2). The correlation between the intertrial average and the intertrial difference in VO2max showed that the 95% LoA in both trials was not heteroscedastic (T1: r = −0.139, p = 0.650; T2: r = −0.254, p = 0.426). Table 3 summarises the intertrial bias ±95% LoA for RPE, heart rate, and VO2 at each of the four CST stages.
The bias ±95% LoA of RPE, heart rate, and VO2 responses between two repeated trials for each stage of the Chester step test
From table 3, it can be observed that there was a trend of a lower intertrial 95% LoA for RPE and heart rate at stages III and IV as compared with stages I and II of the CST. The opposite was true for actual VO2, where there was a greater 95% LoA at stages III and IV compared with stages I and II. As noted earlier in the ANOVA and illustrated in figures 1 and 2, none of the intertrial biases in table 3 were statistically significant.
Assessments of validity
The bias ±95% LoA between the actual HRmax and the age estimated HRmax was −5±12 beats/min. This bias was statistically significant (p = 0.016) (table 2). The bias ±95% LoA between the CST predicted VO2max and the actual VO2max for trials 1 and 2, were −2.8±6.1 ml/kg/min and −1.9±7.4 ml/kg/min, respectively. The VO2max bias of −2.8 ml/kg/min during trial 1 was statistically significant (p = 0.006) (table 2).
Table 4 shows the 95% LoA between estimated and actual VO2 for each stage of the CST, during the two separate trials. The biases at stages I and III of trial 1 and at stage I of trial 2 were statistically significant, showing that on both trials at stage I there was an underestimation of VO2 by about 2 ml/kg/min. A trend of an increased 95% LoA with each successive testing stage was observed in both trials. The 95% LoA to actual VO2 ratios for each CST stage during each trial are shown in table 4, with values ranging between 11.4% and 20.0%. The 95% LoA to actual HRmax ratio was 6.2%.
Bias +95% LoA between estimated and actual mean VO2 (ml/kg/min) at four stages of the Chester step test during two separate trials
To assess the validity of RPE to represent a given %HRmax and %VO2max in keeping with recommended guidelines of these values,3,18 the average values of each of these variables at each stage of the CST were calculated (table 5). At stage 1, RPE was about 9, which corresponded to about 57% of HRmax and about 38% of VO2max. RPE increased with each stage, and by stage IV RPE had risen to about 14, which corresponded to about 81% of HRmax and about 65% of VO2max. The strengths of the associations, between the range of RPE with the range of %HRmax and the range of %VO2max at each CST stage, are indicated by the correlation coefficients in tables 6 and 7. During both trials, there was a systematic increase in the correlation between RPE and %HRmax, and between RPE and %VO2max with each successive testing stage. With regard to %HRmax, its correlation with RPE was statistically significant at stages III and IV of trial 1 and at all stages of trial 2. All %HRmax/RPE correlation coefficients were greater during trial 2 compared with trial 1. With regard to %VO2max, its correlation with RPE was statistically significant at stages II, III, and IV during trial 1 and at stages III and IV during trial 2. Unlike %HRmax, all correlation coefficients of %VO2max/RPE were smaller in trial 2 compared with trial 1 (table 7).
RPE, %HRmax and %VO2max at each stage of the Chester step test during two repeated trials (T1 and T2). Values presented as mean (SD)
Pearson’s correlation coefficients (r) and associated probability values (p) between RPE and actual %HRmax at four stages of the Chester step test
Pearson’s correlation coefficients (r) and associated probability values (p) between RPE and actual %VO2max at four stages of the Chester step test
The correlation between %HRmax and %VO2max was statistically significant at all stages during both trials and showed a systematic increase with each successive CST stage (table 8). These correlation coefficients were greater at all stages in trial 2 compared with trial 1.
Pearson’s correlation coefficients (r) and associated probability values (p) between actual %HRmax and actual %VO2max at four stages of the Chester step test
DISCUSSION
This study set out to assess the reliability and validity of both the CST’s prediction of VO2max and its three main measurement components (RPE, heart rate, and estimated VO2 per testing stage). The analysis also addressed the reliability of the relation between RPE and heart rate, and RPE and %VO2max, which is an initial step in validating these relations for prescribing subsequent appropriate aerobic exercise intensities. A further study is, however, required to assess the transferability of the RPE–heart rate and RPE–%VO2max relations to other activities.
Figures 1 and 2 show that on repeated tests, one of the main assumptions underlying the prediction of VO2max by the CST was violated. The assumption concerned is that the heart rate and VO2 responses should be linear, in relation to successive increments in exercise work rate with each CST stage; in this study, the responses were non-linear. The significantly greater actual VO2 compared with CST estimated VO2 at stage I in both trials would appear to be the cause of this curvilinear relation. A possible correction to attain linearity between work rate increments and heart rate and VO2, could be to exclude heart rate data from stage I when drawing the line of best fit, which is used to extrapolate the data to HRmax and thus VO2max. Stage I could thus be seen as a possible familiarisation and warm up stage, but if a participant’s fitness did not allow them to proceed beyond the second stage, then the prediction of VO2max could be problematic. This highlights that the choice of the step height, relative to each individual participant, is a paramount decision before starting the test. If one is concerned about making an error in choosing the correct step height, it would seem better to choose a step height that was too low, which would ensure that the participant achieved as many stages as safely possible. This present study only relates to the use of a 0.30 m step, and whether the above findings are true for the other CST step heights is yet to be assessed.
The other main assumption in the prediction of VO2max by the CST is that HRmax = 220 minus age. For this group of participants, there was a statistically significant negative bias of −5 beats/min in the actual versus the age estimated HRmax. The 95% LoA around this bias was 12 beats/min, which shows that there could in fact be as much as a 17 beats/min difference between actual and estimated HRmax. This agrees with the historically reported errors in the equation of HRmax = 220 minus age, where up to 20 beats/min error can be expected.24–26 It underlines the caution needed when employing this widely used equation, and adds weight to the argument for using RPE along with heart rate in settings where maximal heart rate testing is neither safe nor practical. The validity of the VO2max prediction, in light of the validity of the age estimated HRmax and the VO2 estimate of each CST stage, will be discussed later.
Prediction of VO2max from the CST underestimated the actual VO2max during both trials. For trial 1, this underestimation was a statistically significant bias of –2.7 ml/kg/min. For both trials, the bias ±95% LoA showed that the CST could potentially underestimate VO2max by as much as 9 ml/kg/min or overestimate VO2max by as much as 5.5 ml/kg/min. For purposes of occupational assessment (for example, a firefighter), such an error could result in either falsely “failing” or falsely “passing” an individual in a required test. It is important that testing personnel are aware of this error. However, factors of CST reliability for detecting changes in fitness, as described later, can be advocated with much more confidence than CST validity in predicting VO2max. The accuracy and specificity of a fitness test for making decisions on occupational fitness or health should thus reflect the potential importance of the decision. For the group of participants in this study, the errors in the predicted VO2max compared with their actual VO2max of 48.2±7.7 ml/kg/min, could be an underestimation or an overestimation of 19% and 11%, respectively. This level of error may be acceptable for occupation health promotion but probably not for important employment decisions. The underestimation of 19% is greater than the 5%–15% error reported by Stevens and Sykes.5 It may be possible to suggest that our error prediction is slightly inflated because of the fact that an individual’s VO2max during box stepping is about 97% of that attained during treadmill exercise.2 The remaining discussion will first evaluate aspects of reliability of the individual CST data measurements and then consider the validity of these measures.
RELIABILITY
Although some of the discussion thus far has challenged the validity of the CST to predict VO2max, this certainly does not imply that its use, within the area of field based fitness assessments, is potentially redundant. The test-retest reliability of the predicted VO2max value was far more encouraging than its validity, as for the former there was little inter trial bias (−0.8 ml/kg/min) and the 95% LoA was ±3.7 ml/kg/min was acceptable. These reliability results concur with those of Nevill et al.6 This means that following an exercise training programme, the CST needs to show an increase in VO2max of as little as about 4 ml/kg/min in order to show that a change has occurred through factors other than random error. As an example, for the group of participants in this study with the highest VO2max, an increase in predicted VO2max of about 4 ml/kg/min would represent a 6% increase in aerobic power, and in those with the lowest VO2max, a 9% change. These changes are at acceptable levels, in keeping with the fact that in sedentary individuals, changes in VO2max can range between 10% and 25% following training.2
Ratings of perceived exertion reliability
There were no intertrial differences in RPE at all four of the CST stages performed. The reliability of RPE at stages III and IV was very acceptable. During these two stages, the exercise intensity averaged 54%–65% VO2max (table 5). There was very little intertrial bias (<0.4 RPE scale points) and the 95% LoA showed that, even if participants exercised at the outer limits of the error (±1.4 to ±1.9 RPE points), they would have still be within the upper bound of the recommended RPE range (RPE <16 and <85% VO2max) for safe and effective exercise in healthy adults.18 This also means that RPE can be used reliably as a means of safely and effectively marking when the CST should stop. In order for RPE to be used as a means of showing an improvement in fitness, the 95% LoA data (table 3) suggest the rating would have to decrease by >1.5 RPE scale points at stage III and >2 scale points at stage IV to represent a change that was explicable by factors other than random error. The intertrial 95% LoA of RPE at stages I and II of the CST challenge the use of RPE being used to reliably gauge physiological effort by perceptual means when intensities are lower than 50% VO2max. It could be speculated that it is easier to rate exertion when sensations are stronger and more apparent, as was the case during stages and III and IV, which provides a possible explanation to the enhanced intertrial reliability at these stages.
Heart rate reliability
Similar to RPE, there were no intertrial differences in heart rate for any of the four CST stages performed, and bias was never greater than –2 beats/min. As with RPE, the intertrial reliability of heart rate improved with each successive stage. It must be noted that all heart rate data are required in drawing the line of best fit for predicting VO2max, and with the intertrial 95% LoA being as high as 18 beats/min for both stages I and II, it can be seen how this could significantly affect the reliability in the VO2max prediction. This may provide another reason for not including stage I data in drawing the line of best fit. Similar to RPE, heart rate can reliably represent a given work rate at CST stage IV, where the 95% LoA was ±10 beats/min. In order for a reduction in heart rate to be used as a means of showing an improvement in fitness, the 95% LoA data (table 3) highlight that heart rate would have to decrease by 15 beats/min at stage III and 10 beats/min at stage IV to represent a change that was explicable by factors other than random error. The testers ensured participants performed the correct stepping technique during both trials as described in the CST manual.
Oxygen uptake reliability
As with RPE and heart rate, there were no intertrial differences in VO2 for any of the four CST stages performed, and bias was never greater than –0.3 ml/kg/min. Unlike RPE and heart rate, the 95% LoA for VO2 increased with each successive stage. With the bias being close to zero in all trials, these data show that from one trial to the next, the VO2 of an individual could vary from 2.3–3.3 ml/kg/min at stages I and II, and by 4.3–5.8 ml/kg/min at stages III and IV. These variations are presumed to be due to intertrial differences in movement technique and would thus influence intertrial variability in heart rate. These effects may not be enough, however, to be detectable by RPE, which was confirmed in figures 1 and 2 where heart rate responded in a curvilinear fashion similar to VO2 but RPE responded linearly to the incremented work rates. However, intertrial RPE reliability is also known to be influenced by other non-physiological factors including familiarisation and practice.27–29 It must also be noted that this group of participants were healthy, young, well motor coordinated, and physically active, which raises the question of whether there would be greater intertesting variability in less active and less motor coordinated individuals.
In trial 2, but not in trial 1, VO2 was positively correlated with height at all stages.
The fact that in trial 1 height was poorly correlated with VO2, but in trial two was positively and significantly correlated, is hard to explain from a physiological perspective. However, by examining the data in figures 1C and 2C, it can be seen that the variability (standard deviation) of VO2 data was greater at each CST stage during trial 2 compared with trial 1. It can only be concluded that this greater spread of data increased the correlation coefficient, an inherent characteristic of correlation coefficients.30
VALIDITY
Maximal heart rate and VO2max
Validity of the age estimated HRmax has previously been discussed and is a very likely source of error in the CST prediction of VO2max. An overestimation of an individual’s actual HRmax, would lead to an over prediction of an individual’s VO2max, and vice versa for an under prediction of HRmax. However, this assumes there being no error in the estimated VO2, which is the other main component and source of error in the VO2max prediction. It is possible that the combined errors of estimated HRmax and estimated VO2 at each CST stage could actually cancel each other out and result in little or no error in the predicted VO2max; so it is potentially difficult to establish which error—estimated HRmax or estimated VO2—is at the heart of the overall VO2max prediction error of the CST. In an attempt to separate the individual contributions to VO2max error, a comparison of the 95% LoA to actual HRmax ratio with the 95% LoA to actual VO2 ratio was made. This ratio showed that for HRmax there was a 6% error, when the error margin (95% LoA) in estimated versus actual HRmax was expressed as a percentage of the mean actual HRmax. The corresponding ratio for the estimated versus actual VO2 error showed the lowest ratio to be 11.4%, which occurred in stage III of trial 1, and the highest error to be 20%, which occurred at stage I of trial 2. On this basis, the estimated VO2 would potentially contribute more to the error in the predicted VO2max as compared with the error arising from the age estimated HRmax. The 95% LoA, of the actual and age estimated HRmax would have to rise to >±20 beats/min to achieve an error similar that of the lowest error found in estimated VO2.
Ratings of perceived exertion
The validity of RPE is its ability firstly to distinguish between different exercise intensities. Figures 1 and 2, table 5, and the ANOVA indicate that this facet of validity was achieved, by RPE being significantly greater by 1.5–2.0 RPE scale points for each successive stage of the CST. These RPE scale point increments of 1.5–2.0 corresponded to about 6%–11% in %HRmax and %VO2max (table 5). The second distinguishing feature of RPE validity relates to its ability, on an interindividual basis, to represent a given %HRmax or %VO2max. Exercise prescription guidelines3,18 recommend that RPE 12–16 can be used to estimate either 50%–85% of VO2max or 65%–90% of HRmax. In general, for this group of participants, these targets were achieved. As summarised in table 5, during stage III of the CST, about 54% VO2max and about 70% HRmax elicited an RPE of about 12, and during stage IV of the CST, about 65% VO2max and about 81% HRmax elicited an RPE of about 14. This also shows that the testing procedure for stopping the CST, at a heart rate of 80% HRmax and/or an RPE of 14 are corresponding end points. The reliability of RPE must also be considered at this point, where at stages I and II the reliability was questionable but at stages III and IV it improved to more acceptable limits of agreement (<±2 RPE scale points). A final factor of RPE validity is its general association with %HRmax and %VO2max and this will be discussed separately in the two sections to follow.
RPE and %HRmax
With regard to %HRmax during trial 1, there was a positive and significant correlation with RPE at stages III and IV, and during trial 2 a significant correlation at all stages of the CST (table 6). These results show that there was an improvement in the ability of RPE to be a valid marker of %HRmax when one is familiarised via a second trial with RPE during a specific activity (for example, box stepping). Such a result is in keeping with results previously found.27,28 The %HRmax data were also examined for an increase in variability (standard deviation) during trial 2 compared with trial 1 at each CST stage, which could also be responsible for a greater spread of data and causing an increased correlation coefficient.30 The standard deviations across the trials were similar, which show that the increased correlation from one trial to the next was truly due to a strengthened association between RPE and %HRmax. Furthermore, the strength of the association between RPE and %HRmax was greater at higher exercise intensities (CST stages III and IV, >50% VO2max).
RPE and %VO2max
There was a positive, significant correlation between RPE and %VO2max at CST stages II, III and IV during trial 1 and stages III and IV during trial 2 (table 7). Like %HRmax, there was a systematic increase in the correlation coefficient between %VO2max and RPE with each increment in work rate during both trials. Interestingly, and unlike %HRmax, the correlation coefficients were actually lower at each stage in trial 2 compared trial 1. On further examination of the results, the variability (standard deviation) of the %VO2max data appears to be reduced in trial 2 compared with trial 1, resulting in a reduced spread of data; as noted previously, this can give rise to a reduced correlation coefficient. A final point concerning the relation between RPE and both %HRmax and %VO2max is to acknowledge that the participants of this study all had a similar training status. It is known that RPE is actually more strongly coupled with blood lactic acid accumulation thresholds than with %HRmax or %VO2max.31–36 The more highly trained individual will work to a greater proportion of HRmax or VO2max for a given blood lactate but the RPE at this given blood lactate will be the same in the trained and less trained individual.
CONCLUSIONS
The reliability of the CST as a field based test to detect improvements in aerobic fitness can be recommended. The validity, however, of this test to predict an actual VO2max is questionable and thus its role in fitness testing should be mainly as a reliable measurement tool. In assessing the error of the two main components for predicting VO2max from the CST—the age estimated HRmax and the estimated VO2 at each CST stage—more of the potential error lies with the estimation of VO2 at each stepping stage. The recommendation for the CST to be used to prescribe subsequent recommended exercise intensities, based on the association between RPE and heart rate measured during the CST, requires further validation for its transferability to other activities. During box stepping exercise, the RPE–heart rate relation reliability and validity carries two provisos: (1) when the intensity represents a level >50% VO2max or >65% HRmax and (2) when a practice trial is first performed. Other areas of further investigation include repeating the analyses of this study when performing the CST with the three other recommended step heights; evaluating the reliability and validity of the CST in older and/or more sedentary individuals; and assessing factors of heart rate, RPE, and VO2 reliability and validity during the CST in participants taking β blocking medication.
Take home message
The Chester step test can be used confidently as a reliable assessment of aerobic fitness in healthy young adults but its validity in predicting VO2max is questionable. Heart rate and ratings of perceived exertion data taken during the CST are valid and reliable representations of relative exercise intensity (%VO2max), but only when intensities are >65% HRmax or >50% VO2max and when a practice trial of the Chester step test is first performed.