Article Text

Abstract
In adult patients with cystic fibrosis (CF), the lung clearance index (LCI) derived from the multiple breath washout relates to both acinar and conductive ventilation heterogeneity. The latter component predicts an association between LCI and the number of bronchial segments affected by bronchiectasis. Here, we experimentally demonstrated this association in patients with CF, and also examined an ancillary group of patients with non-CF bronchiectasis. We conclude that lung disease severity in terms of number of bronchial segments results in an associated LCI increase, likely constituting a portion of LCI that cannot be reversed by treatment in patients with CF lung disease.
- Cystic Fibrosis
- Bronchiectasis
- Exhaled Airway Markers
- Respiratory Measurement
- Imaging/CT MRI
Statistics from Altmetric.com
Introduction
Previous studies have scrutinised the relationship of Bhalla or Brody CT scores observed in patients with cystic fibrosis (CF) to tests of ventilation heterogeneity such as the multiple breath washout (MBW).1–3 In advanced CF lung disease, the lung clearance index (LCI) is partly due to ventilation heterogeneities arising between lung units supplied by convective flow, which can affect 30%–50% of total lung volume.4 This suggests that some structural correlate is expected to be visible on the resolution scale of CT. Bronchiectasis in the airways has the potential to impair convective gas flow into subtending airways. Our convection-dependent ventilation model of adult CF disease predicts an association between LCI and the number of lung units affected by bronchiectasis.4 5 Thus, we tested the hypothesis that the number of bronchopulmonary segments with bronchiectasis detected on CT directly relates to LCI measured in the same patients with CF. We also examined data from a group of patients with non-CF bronchiectasis previously published by Bilton et al,6 to underline the specific role of bronchiectasis.
Methods
Over a 1-year period, consecutive adult patients with stable CF visiting the outpatient clinic for their annual check-up were recruited (UZ Brussel ethical committee approval B143201213405). From 24 stable patients with non-CF bronchiectasis in Bilton et al 6 who had both MBW and CT performed (across two sites), we retrieved raw data from 15 patients at the Sydney site and reanalysed these. In our prospective CF study group, lung function measurements (VmaxEncore; Cardinal Health, Ohio, USA) were followed by the nitrogen MBW test, performed in triplicate, and analysed as previously described.5 From mean expired concentration curves, we derived LCI and curvilinearity (curv), the latter being a more specific marker of convection-dependent ventilation heterogeneity.5 From phase III slopes, we computed indices of acinar and conductive ventilation heterogeneity, adapted for severe lung disease (Sacin*,Scond*).5 All measured parameters were related to reference values in age range 20–80 years.7
Volumetric CT images were obtained during quiet breathing, using MDCT (Discovery 750HD,GE Healthcare; Milwaukee, Wisconsin, USA) with a slice thickness 0.625 mm. Manual CT scoring included identification of pattern and severity of bronchiectasis, peribronchial thickening, mucus plugging, bullae, emphysema, collapse and consolidation.1 The sum of subscores was then subtracted from 25 (maximum value) to obtain the Bhalla score. For each patient, the number of segments affected by bronchiectasis (nBE) was recorded; bronchiectasis CT subscore 1, 2 and 3, respectively, correspond to nBE ranges 1–5, 6–9 and >9.1
Statistical analyses were performed with MedCalc (V.16.4.3, Mariakerke, Belgium) accepting statistical significance at p=0.05.
Results
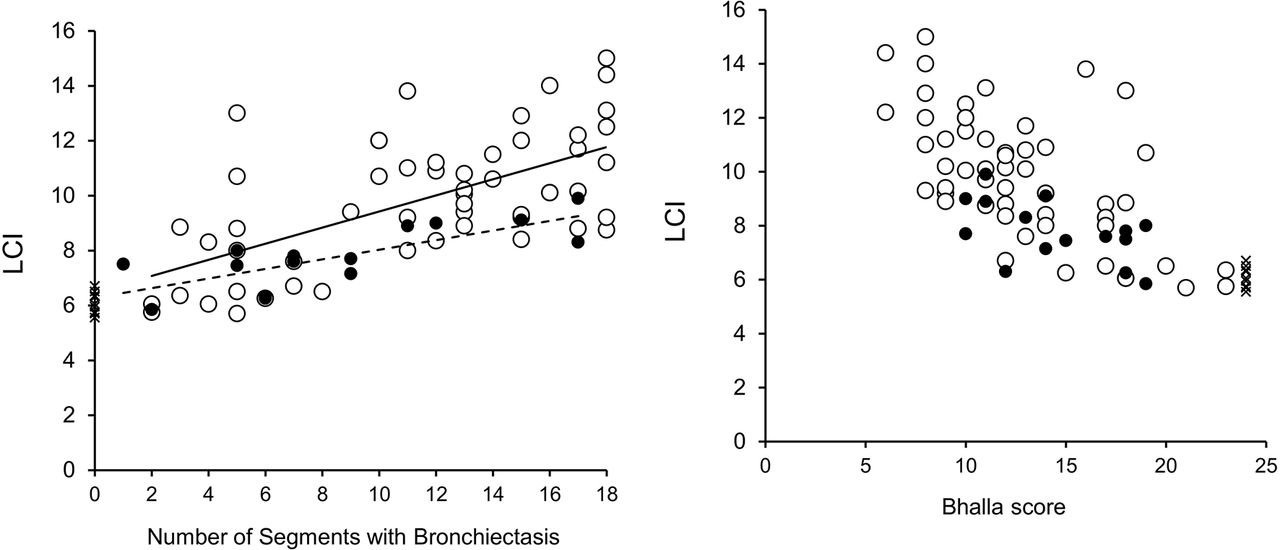
Figure 1A shows significant associations between LCI and nBE in the main study group (patients with CF; n=63) and in the ancillary non-CF bronchiectasis group (n=15) (table 1), consistent with predictions of an almost linear dependence of LCI on nBE for nBE >0 (see online supplementary figure 1). Significant correlations between nBE and LCI, and also between nBE and curv (see online supplementary table 1), were maintained when only including patients with CF, with bronchiectasis subscore >1 (ie, nBE >5).
Supplementary file
(A) LCI versus number of segments affected by bronchiectasis (nBE). Open circles: patients with CF with at least one bronchopulmonary segment affected by bronchiectasis (n=54) and corresponding regression line (solid line; r=+0.62; simple regression slope: 0.3 LCI increase per nBE). Crosses: patients with CF without bronchiectasis (n=9). Solid circles: patients with non-CF bronchiectasis (n=15) and corresponding simple regression line (dashed line; r=+0.76; regression slope: 0.2 LCI increase per nBE). While the slope of the regression lines in the CF group (solid line) and in the non-CF group (dashed line) were not significantly different from each other (analysis of covariance; p=0.26 for ‘heterogeneity of slopes’), their exact value may partly depend on patient group selection and corresponding nBE range. (B) LCI versus Bhalla score. Open circles: patients with CF with at least one bronchopulmonary segment affected by bronchiectasis (n=54). Crosses: patients with CF without bronchiectasis (n=9). Solid circles: patients with non-CF bronchiectasis (n=15). CF, cystic fibrosis; LCI, lung clearance index.
Baseline characteristics of the main study group (CF) and ancillary dataset (non-CF)
To further explore the role of conductive ventilation heterogeneity we performed a stepwise multiple linear regression on nBE, including both Sacin* and Scond* (which are both known to contribute to ventilation heterogeneity in CF). When considering all patients with CF with at least one segment affected by bronchiectasis (open circles in figure 1A), both Sacin* and Scond* were retained in the model (Sacin*: regression coefficient (SE): 6.2 (2.6); partial r=0.32; p=0.02; Scond*: regression coefficient (SE): 41.1 (8.9); partial r=0.54; p<0.001; adjusted R 2=0.42; n=54). However, when including only patients with bronchiectasis CT subscore >1 (n=42), only Scond* was retained (regression coefficient (SE): 30.6 (8.7); r=0.49; p=0.001).
The online supplementary file contains supportive data and study limitations.
Discussion
We have established a highly significant relationship between the number of bronchial segments affected by bronchiectasis (nBE) and LCI in adult patients with CF, as predicted by a very simple mechanistic model showing a dependence of LCI on nBE which is almost linear for nBE >0 (see online supplementary figure 1). The interpretation of this relationship was strengthened by the link between nBE and specific indices of convection-dependent ventilation heterogeneity (Scond* and curv) in our patient with CF group. In addition, the reanalysis of data from an ancillary group of patients with non-CF bronchiectasis confirmed the observed pattern of convective ventilation heterogeneity underlying the relationship between LCI and nBE.
In principle, LCI includes all ventilation heterogeneities down the lung periphery, including those in the acinar spaces. The predominant relationship of nBE with conductive ventilation heterogeneity (Scond*) over Sacin* indicates that ventilation heterogeneity associated with nBE occurs between relatively large lung units, at least large enough to be supplied by convective flow. If convective flow into a lung unit is hampered by the bronchiectatic airway supplying it, average ventilation of the corresponding bronchopulmonary segment will decrease. One large bronchiectatic airway or several more peripheral ones may lead to the same degree of underventilation of a bronchopulmonary segment. The degree of LCI increase with nBE (figure 1A) actually provides a semi-quantification of the extent of underventilation of the affected bronchopulmonary segments. Indeed, our experimental range of 0.2–0.3 LCI increase per nBE, corresponds to affected segments receiving only 40% of their normal ventilation.5 This should be measurable by combined lung imaging modalities, where airways responsible for local underventilation visualised by MRI can be identified by CT.8
Previous studies1–3 have shown correlations between LCI and CT scores in patient with CF groups,9 but these also included patients with CF with normal LCI. Here, LCI correlates with Bhalla score even when excluding patients without bronchiectasis (figure 1B). Nevertheless, categorising nBE into corresponding scores blurs any potential correlation between LCI and CT features. Indeed, according to the 0.2–0.3 LCI units increase per nBE obtained here (figure 1A), any two patients with either 10 or 18 bronchopulmonary segments affected by bronchiectasis could have an average LCI difference of ~2 units (=0.25*(18–10)) despite having the same CT subscore of 3.
In CF, interventions such as physiotherapy or intravenous antibiotics have led to variable LCI effects, whereas other treatments have shown consistent LCI decreases (eg, ref 10). The LCI decreases following treatment with ivacaftor stabilised after a few weeks, but also showed a residual LCI abnormality.10 The clinical implication of our study is that the extent of bronchiectasis increases the lowest possible LCI value to which an individual patient can be reversed after treatment. Even if mucus can be partially displaced or evacuated by any given treatment, the extent of bronchiectasis is determinant of the LCI portion that cannot be reversed.
References
Footnotes
Contributors SV and EV: designed the study and drafted the manuscript. DS, BI, CWE and JdM: performed data analysis at the Brussels site. GGK, WZ, AM and CT: performed data analysis at the Sydney site. SV, CT, GGK, WV and EV: supervised the study and reviewed the final manuscript version.
Funding This project was supported by the Fund for Scientific Research-Flanders (FWO-Vlaanderen, Belgium).
Competing interests None declared.
Provenance and peer review Not commissioned; externally peer reviewed.