Article Text

Abstract
Background: Not all patients with severe chronic obstructive pulmonary disease (COPD) progressively hyperinflate during symptom limited exercise. The pattern of change in chest wall volumes (Vcw) was investigated in patients with severe COPD who progressively hyperinflate during exercise and those who do not.
Methods: Twenty patients with forced expiratory volume in 1 second (FEV1) 35 (2)% predicted were studied during a ramp incremental cycling test to the limit of tolerance (Wpeak). Changes in Vcw at the end of expiration (EEVcw), end of inspiration (EIVcw), and at total lung capacity (TLCVcw) were computed by optoelectronic plethysmography (OEP) during exercise and recovery.
Results: Two significantly different patterns of change in EEVcw were observed during exercise. Twelve patients had a progressive significant increase in EEVcw during exercise (early hyperinflators, EH) amounting to 750 (90) ml at Wpeak. In contrast, in all eight remaining patients EEVcw remained unchanged up to 66% Wpeak but increased significantly by 210 (80) ml at Wpeak (late hyperinflators, LH). Although at the limit of tolerance the increase in EEVcw was significantly greater in EH, both groups reached similar Wpeak and breathed with a tidal EIVcw that closely approached TLCVcw (EIVcw/TLCVcw 93 (1)% and 93 (3)%, respectively). EEVcw was increased by 254 (130) ml above baseline 3 minutes after exercise only in EH.
Conclusions: Patients with severe COPD exhibit two patterns during exercise: early and late hyperinflation. In those who hyperinflate early, it may take several minutes before the hyperinflation is fully reversed after termination of exercise.
- EEVcw, end expiratory chest wall volume
- EFL, expiratory flow limitation
- EIVcw, end inspiratory chest wall volume
- EH, early hyperinflator
- fb, breathing frequency
- FEV1, forced expiratory volume in 1 second
- FVC, forced vital capacity
- FRC, functional residual capacity
- IC, inspiratory capacity
- IRVcw, inspiratory reserve chest wall volume
- LH, late hyperinflator
- OEP, optoelectronic plethysmography
- RER, respiratory exchange ratio
- RV, residual volume
- Tlco, carbon monoxide lung transfer factor
- TLC, total lung capacity
- TLCVcw, chest wall volume at total lung capacity
- Vcw, chest wall volume
- V˙e, minute ventilation
- V˙o2, oxygen uptake
- Vt, tidal volume
- Wpeak, peak workload
- chronic obstructive pulmonary disease
- exercise tolerance
- dynamic hyperinflation
Statistics from Altmetric.com
- EEVcw, end expiratory chest wall volume
- EFL, expiratory flow limitation
- EIVcw, end inspiratory chest wall volume
- EH, early hyperinflator
- fb, breathing frequency
- FEV1, forced expiratory volume in 1 second
- FVC, forced vital capacity
- FRC, functional residual capacity
- IC, inspiratory capacity
- IRVcw, inspiratory reserve chest wall volume
- LH, late hyperinflator
- OEP, optoelectronic plethysmography
- RER, respiratory exchange ratio
- RV, residual volume
- Tlco, carbon monoxide lung transfer factor
- TLC, total lung capacity
- TLCVcw, chest wall volume at total lung capacity
- Vcw, chest wall volume
- V˙e, minute ventilation
- V˙o2, oxygen uptake
- Vt, tidal volume
- Wpeak, peak workload
Progressive dynamic hyperinflation leads to intolerable sensations of breathlessness that make an important contribution to the limitation of symptom limited exercise in most patients with chronic obstructive pulmonary disease (COPD).1 In these patients changes in end expiratory lung volume (EELV) constitute an important outcome in assessing the effects of therapeutic interventions on the development of dynamic hyperinflation during exercise.2–4 The assessment of dynamic changes in EELV is routinely carried out by serial inspiratory capacity (IC) manoeuvres5,6 assuming that, in patients with COPD, total lung capacity (TLC) does not change appreciably during exercise.7,8
On the other hand, there are a significant number of patients with COPD who do not hyperinflate progressively during exercise6,9–12 but still claim dyspnoea as the main cause of exercise limitation.6 The results reported for this category of COPD patients are, however, discrepant as EELV has either been reported to remain constant with increasing intensity12 or actually to fall,11 as is commonly seen in healthy subjects.13 Accordingly, exercise limitation in these patients is not associated with end expiratory dynamic hyperinflation. This implies that simply tracking changes in EELV during exercise is not informative of all the factors that intensify dyspnoea and reduce exercise capacity in these patients. In COPD patients there is also variability in the response of the end inspiratory lung volume (EILV) to exercise: most studies report a progressive increase in EILV1,5,6,12 although Aliverti et al11 found that some patients exhibit a stable EILV. Assessment of all dynamically modified operational lung volumes during exercise is therefore important for understanding which factors contribute to exercise limitation. This study was undertaken primarily to identify possible differences in the pattern of response in operational volumes during exercise in patients with severe COPD.
Optoelectronic plethysmography (OEP) is a technique capable of accurately measuring breath by breath changes in the volumes of the entire chest wall (Vcw) and its rib cage and abdominal chest wall compartments.13–15 In addition, OEP can measure breath by breath variations in end inspiratory and end expiratory Vcw and volume variations of the different chest wall compartments. These measures are crucial for understanding the different ventilatory strategies adopted during exercise between different patients. OEP can also track any changes in Vcw at TLC (TLCVcw) if maximal inspirations are repeatedly made during exercise. Thus, one can determine if tidal volume is restricted when end inspiratory volume is at or near TLC. As the literature is lacking research investigating changes in operational lung volumes following the cessation of exhaustive exercise in patients with COPD, we also investigated the pattern of change in Vcw during recovery from exercise since this could be an important issue for patients when dealing with activities of daily living.
METHODS
Subjects
The study patients included 15 men and 5 women with stable COPD who satisfied the following criteria: (1) post-bronchodilator forced expiratory volume in 1 second (FEV1) <50% predicted and ratio of FEV1 to forced vital capacity (FVC) <65% without significant reversibility (<12% change of the initial FEV1 value); (2) optimised medical treatment; and (3) no clinical evidence of exercise limiting cardiovascular or neuromuscular diseases. Patients signed an informed consent form and the protocol was approved by the University Ethics Committee.
Pulmonary function assessment
Spirometric tests and measurement of lung transfer factor for carbon monoxide (Tlco) were performed by a spirometer (Masterlab; Jaeger, Wurzburg, Germany) while subdivisions of lung volumes were measured by body plethysmography (Medgraphic Autolink 1085D, Medical Graphics, St Paul, MN, USA) according to ATS standards.16
Exercise protocol
The following incremental protocol was performed on an electromagnetically braked cycle ergometer (Ergoline 800; Sensor Medics, Anaheim, CA, USA): after 3 minutes of measurements during quiet breathing, followed by 3 minutes of unloaded pedalling, the work rate was increased every minute (increments of 5 or 10 W) to the limit of tolerance (Wpeak) while patients maintained a pedalling frequency of 60 rpm. The following gas exchange and ventilatory variables were recorded breath by breath (Vmax 229, Sensor Medics): oxygen uptake (V˙o2), carbon dioxide output (V˙co2), respiratory exchange ratio (RER), minute ventilation (V˙e), tidal volume (Vt), and breathing frequency (fb). Cardiac frequency (fc) and percentage oxygen saturation (Spo2%) were determined using the R–R interval from a 12-lead on line electrocardiogram (Marquette Max; Marquette Hellige GmbH, Germany) and a pulse oximeter (Nonin 8600; Nonin Medical, USA), respectively. The modified Borg scale17 was used to rate the magnitude of dyspnoea and leg discomfort every 2 minutes throughout exercise.
Operational lung and chest wall volume measurements
At baseline, during unloaded cycling and incremental exercise, patients performed IC manoeuvres at quiet breathing, every 2 minutes during exercise, and in recovery. Patients were instructed after 3–4 regular tidal breaths to make maximal IC efforts from EELV to TLC according to previously described methods.1 Simultaneously, chest wall kinematics were measured by OEP as previously described.13–15 In brief, the movement of 89 retro-reflective markers placed front and back over the chest wall from clavicles to pubis was recorded. Each marker was tracked by six video cameras (Smart System BTS, Milan, Italy), three in front of the subject and three behind. Subjects grasped handles positioned at the mid sternum level which lifted the arms away from the rib cage so that lateral markers could be visualised. Dedicated software reconstructs the three-dimensional coordinates of the markers in real time by stereophotogrametry and calculates total and compartmental chest wall volume and volume variations using Gauss’s theorem. As in the study by Aliverti and co-workers,11 the chest wall was modelled as being composed of two compartments—the rib cage and the abdomen. Vcw was the sum of the rib cage volume (Vrc) and abdominal volume (Vab).11 Vcw data are reported during quiet breathing, unloaded cycling (0 Watts), at 33%, 66% and 100% of peak exercise workload (Wpeak), and 1 minute (R1) and 3 minutes (R2) into the recovery.
Comparison of OEP with spirometric data
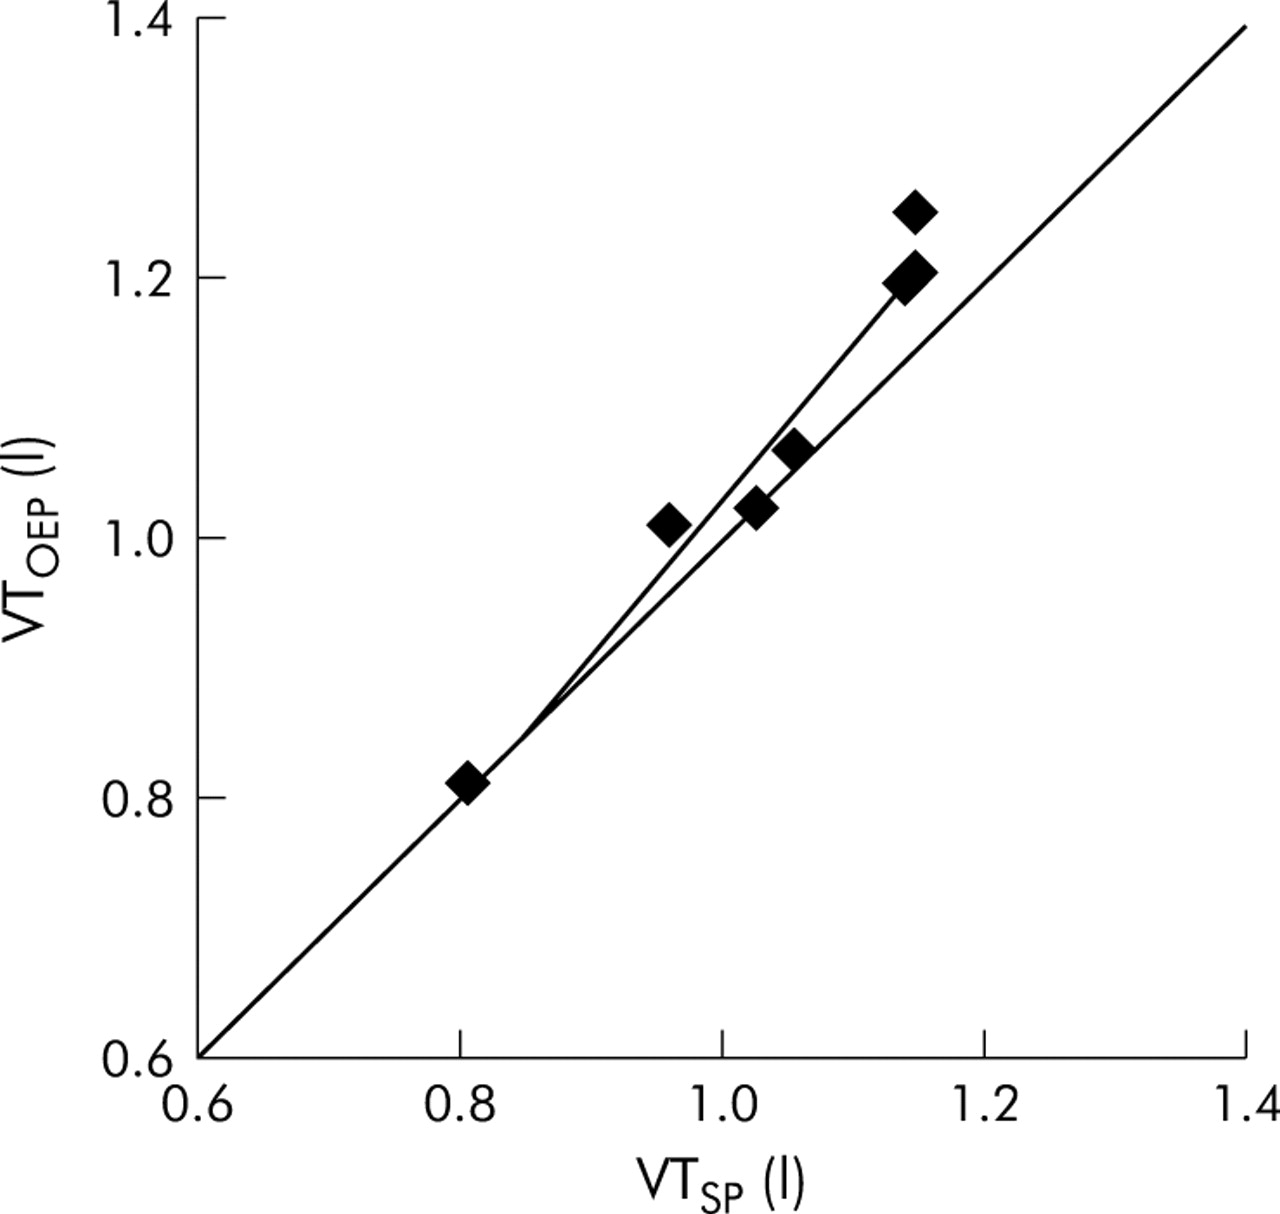
Vt measured by the OEP (Vtoep) was calculated as the difference between end inspiratory and end expiratory Vcw (EIVcw − EEVcw). As in a previous study15 in which we assessed the ability of the OEP to measure changes in lung volumes during exercise, we compared VtOEP with Vt obtained spirometrically (VtSP) over periods of 20 seconds throughout all stages. IC was calculated by the OEP (ICOEP) as the difference between TLCVcw and the EEVcw; the latter value was derived by averaging the EEVcw over a period of 20 seconds before the IC effort (fig 1). ICOEP and EEVcw values recorded at quiet breathing, during exercise and recovery were compared with IC measured by the spirometer (ICSP) according to previously described methods.1

Typical experimental tracings of absolute chest wall volume measurements obtained from (A) an early hyperinflator and (B) a late hyperinflator patient during quiet breathing and peak exercise. A gradual shift in volumes during exercise occurred because of an increase in mean end inspiratory (EI) and mean end expiratory (EE) chest wall volumes indicated by the dashed line. Chest wall volumes at total lung capacity (TLC) are indicated by an arrow.
Statistical analysis
Data are presented as mean (SE) values. Linear regression analysis was performed using the least squares method. Two way analysis of variance (ANOVA) with repeated measures was used to identify statistically significant differences in chest wall volumes across different time points between groups. Within groups one way ANOVA with repeated measures was performed to examine statistical differences, followed by paired t tests when necessary. For all analyses a statistical significance of 0.05 was used, with appropriate Bonferroni corrections for multiple comparisons.
RESULTS
Patient characteristics
Patients were characterised by severe airway obstruction and a reduction in tlco with increased TLC, functional residual capacity (FRC) and residual volume (RV) (table 1). Exercise capacity was severely compromised (table 2).
Mean (SE) demographic and post-bronchodilator data of the study population and subgroups
Mean (SE) peak exercise data of the study population and subgroups
Comparison of OEP with spirometric data
The relationship between VtOEP and VtSP calculated simultaneously over a period of 20 seconds during quiet breathing, exercise, and recovery is shown in fig 2. The linear regression analysis yielded the following equation: VtOEP = 1.20VtSP − 0.18 (r2 = 0.97, p<0.001). The mean percentage difference between VtOEP and VtSP was −2.8 (1.2)% or 31 (14) ml. The difference between the two systems at maximum workload (100%peak) was 8.4 (4.5)% or 93 (17) ml, with the VtOEP values being larger.

Regression line between tidal volume (Vt) from the spirometer (VtSP) and optoelectronic plethysmography (VtOEP) during quiet breathing, exercise, and recovery. Each point represents the mean value of all 20 patients. Line of identity is also shown.
Changes in IC from quiet breathing measured by the spirometer (ΔICSP) were in good relationship with the EEVcw calculated by the OEP (ΔEEVcwOEP) during exercise and recovery (fig 3A). Linear regression analysis provided the following equation: ΔEEcwOEP = 0.82ΔICSP + 0.03 (r2 = 0.91, p<0.001). The mean percentage difference between ΔEEcwOEP and ΔICSP throughout all stages was 7.0 (5.8)% or 35 (24) ml.

(A) Regression line between volume changes from quiet breathing in inspiratory capacity measured by the spirometer (ΔICSP) and end expiratory chest volume calculated by optoelectronic plethysmography (ΔEEVcwOEP) throughout all stages. Each point represents the mean value of all 20 patients. (B) Regression line between the inspiratory capacity measured by the spirometer (ICSP) and the inspiratory capacity calculated by the optoelectronic plethysmography (ICOEP) at quiet breathing, during exercise and recovery. Each point represents the mean value of all 20 patients.
In addition, a close correlation was found between ICOEP and ICSP during all stages (fig 3B). Linear regression analysis provided the following equation: ICOEP = 0.65ICSP + 0.52 (r2 = 0.89, p<0.001). The mean percentage difference throughout all stages between ICOEP and ICSP was 3.8 (1.8)% or 73 (32) ml.
Changes in operational Vcw during exercise and recovery
Two significantly different patterns of change in EEVcw were observed during exercise in our patients (fig 4). Twelve patients exhibited a progressive significant increase in EEVcw during exercise (early hyperinflators, EH) amounting to 750 (90) ml at Wpeak (fig 4A). In contrast, in all eight remaining patients EEVcw remained unchanged from quiet breathing up to 66% Wpeak (fig 4B). In the latter group, however, EEVcw was significantly increased by 210 (80) ml compared with quiet breathing at Wpeak (late hyperinflators, LH). The two groups also differed in terms of the recovery pattern: in the EH group EEVcw was still 254 (130) ml higher at 3 minutes into the recovery period than at quiet breathing while, in the LH group, the EEVcw had returned to the level at quiet breathing within 3 minutes of the recovery (fig 4).

Volumes of the rib cage and the abdominal compartments and of the total chest wall in (A) early hyperinflators (EH) and (B) late hyperinflators (LH) expressed in absolute values during quiet breathing (QB), exercise, and recovery (R1 and R2). Open circles indicate end of inspiration; closed circles indicate end of expiration; triangles indicate chest wall volumes at total lung capacity. †Significant differences in time points between groups.
In the EH group TLCVcw increased, albeit not significantly, compared with quiet breathing from 66% Wpeak onwards (fig 4). At Wpeak the increase in TLCVcw from quiet breathing amounted to 198 (95) ml, corresponding to an increase of 0.8 (0.1)% of TLCVcw measured at quiet breathing. At 1 minute of recovery TLCVcw was still higher than during quiet breathing (by 153 (64) ml), whereas by 3 minutes of recovery TLCVcw had reached values very close to quiet breathing (fig 4). Similarly, in the LH group, TLCVcw increased by 72 (25) ml at Wpeak (0.3 (0.1)% of TLCVcw at quiet breathing) but it did not differ significantly from that recorded during quiet breathing (fig 4).
The pattern of change in EIVcw during exercise did not differ between the groups. EIVcw increased significantly throughout exercise and remained significantly higher than quiet breathing during recovery (fig 4). At Wpeak patients in both groups breathed with a tidal EIVcw that closely approached TLCVcw (table 2), thus restricting further expansion of VtOEP. During exercise, V˙e and VtOEP in the EH group tended to be higher than in the LH group. Nevertheless, volume constraints on VtOEP expansion (VtOEP/ICOEP, IRVcw/TLCVcw) were similar between the groups, whereas IRVcw reached the same level in both groups (table 2). Symptoms of dyspnoea and leg discomfort did not differ between the groups. Neither resting lung volumes, peak exercise workload, nor gas exchange were significantly different between the two groups (tables 1 and 2).
Compartmental tidal volumes
The volume variations for the abdominal compartment were significantly different between groups during exercise and recovery (fig 4 middle panels). In the EH group the increase in EEVcw with increasing work rate was almost entirely attributable to the significant increase in end expiratory Vrc with no significant contribution from Vab (fig 4, top left and middle panels). In contrast, in the LH group there was no significant change in EEVcw up to 66% Wpeak; this was attributed to the significant decrease seen in end expiratory Vab during exercise (fig 4, bottom middle panels). In the EH group VtOEP expansion was due to a progressive increase in end inspiratory Vrc and Vab whereas in the LH group the increase in VtOEP was achieved by an increase in end inspiratory Vrc and a decrease in Vab (fig 4).
In both groups, 3 minutes into recovery VtOEP remained significantly higher than at quiet breathing, mainly as a result of increased end inspiratory Vrc in both groups. In contrast, within 3 minutes of recovery the end expiratory Vrc in both the EH and LH groups was not significantly different than at quiet breathing.
Throughout incremental exercise sensations of dyspnoea and leg discomfort tended to be higher in the EH group than in the LH group (fig 5). However, the differences between the groups were not significant.

Perceptions of (A) dyspnoea and (B) leg discomfort at quiet breathing (QB) and during exercise between early (closed symbols) and late hyperinflators (open symbols).
DISCUSSION
The main findings of this study are:
-
In patients with severe COPD there are two distinct patterns of change in the chest wall volume response to exercise: in the EH group EEVcw progressively increases throughout exercise while in the LH group it remains unchanged up to 66% Wpeak, but increases significantly at Wpeak.
-
Although at the limit of tolerance the increase in EEVcw was significantly greater in the EH than in the LH group, both reached similar values of Wpeak, IRVcw and dyspnoea.
-
Groups did not differ in terms of resting lung volumes or exercise tolerance measures.
-
After exercise the EEVcw did not return to the pre-exercise value by 3 minutes in the EH group.
In healthy subjects, in whom expiratory flow limitation (EFL) is absent, EELV decreases progressively during exercise.13,15 In contrast, the progressive increase in EELV that is typically observed in patients with severe COPD during exercise is mainly dictated by EFL.12,18 Koulouris and colleagues12 have shown that if EFL is present during resting breathing, any further increase in ventilation during exercise is associated with progressive dynamic hyperinflation. The progressive increase in EEVcw observed in the EH group (12 patients) with increasing exercise level presumably reflects the presence of EFL already at rest. On the other hand, eight patients exhibited hyperinflation only at Wpeak. This suggests that in these subjects EFL started only after 66% Wpeak, in line with previous findings12 which indicated that some COPD patients do not reach EFL up to two thirds of Wpeak. Furthermore, it should be noted that in our LH patients, the end expiratory Vab decreased progressively in the range of 0–66% Wpeak. The decreased end expiratory Vab during exercise reflected increased abdominal muscle activity. It has been postulated that such a contraction is beneficial because of lengthening of the diaphragm resulting in improved generation of a negative pleural pressure (better position of the length-tension relationship).19,20 Although, end expiratory Vab was reduced over this exercise range, EEVcw did not change as there was a simultaneous increase in end expiratory Vrc.
Aliverti et al11 have also reported that not all patients with COPD hyperinflate during exercise. They studied 20 patients during incremental exercise: 12 were EH similar to the present study, while in eight the EEVcw actually decreased from early exercise. These subjects were, however, different from the LH subjects of the present study and those of Koulouris et al.12 Their FEV1 averaged 50% of predicted compared with our value of 37%, and their exercise performance was very poor with a Wpeak of only 20 W compared with 40 W in the LH group. In the present study the overall group of patients is comparable, at least in terms of FEV1, to that reported by Aliverti et al11 for the hyperinflators (having an FEV1 of 39% predicted). This is probably the reason why we were not able to identify any “euvolumic” patients as described by Aliverti et al.11
Furthermore, there were important differences in chest wall kinematics in their non-hyperinflators11 compared with our LH group. They found no increase in EIVcw as exercise workload increased and hence the increase in VtOEP during exercise was solely due to the decrease in EEVcw, presumably reflecting absence of EFL throughout exercise. In addition, at Wpeak there was a large IRVcw amounting to approximately 1.3 l, while in our subjects it was only 0.26 l. Neither Koulouris et al12 nor O’Donnell et al6 found patients with such a high inspiratory reserve volume at the limit of tolerance as Aliverti et al.11 In our study VtOEP increased with exercise entirely by an increase in EIVcw so that, at Wpeak, EIVcw was very close to TLCVcw and IRVcw was minimal. We found no decrease in EEVcw and the decrease in end expiratory Vab was considerably less than in their patients. It is therefore possible that, besides the different degree of EFL experienced by patients in the two studies, expiratory muscle recruitment was more in their patients than in ours, leading to a greater work of breathing.
Accordingly, when the findings of the present study are compared with those of Aliverti et al,11 it can be suggested that, during the natural history of COPD, patients pass through a stage with moderate impairment of expiratory flow rates so that exercise does not impose dynamic hyperinflation. With further disease progression, manifested by decreasing FEV1, dynamic hyperinflation might be accompanied by lesser degrees of expiratory muscle recruitment and increased dynamic hyperinflation. Longitudinal studies will be required to determine if this hypothesis is correct.
The present study provides, for the first time, simultaneous changes in Vcw at the end of inspiration, expiration, and at TLC during symptom limited exercise in patients with severe COPD. Interestingly, at Wpeak tidal EIVcw closely approached TLCVcw in both EH and LH. Accordingly, exercise limitation was associated with the fixed mechanical constraint set by the reduced IRVcw rather than the magnitude of the change in EEVcw per se. The increase in dynamic hyperinflation during exercise is therefore not the only mechanism limiting exercise capacity in patients with severe COPD.
We also observed that TLCVcw in both EH and LH increased at Wpeak from quiet breathing, albeit not significantly (EH: by 198 (95) ml or 0.8 (0.1)% of TLCVcw measured during quiet breathing; LH: by 72 (25) ml or 0.3 (0.1)% of TLCVcw measured during quiet breathing). The magnitude of these changes in TLCVcw in both groups during exercise is in agreement with previous suggestions that small changes in TLC may occur during exercise because hyperinflation can cause an increase in lung distensibility.21–23 Accordingly, changes in TLCVcw tended to be larger in EH, possibly because they were more hyperinflated than the LH. It should be noted, however, that changes in chest wall volumes include changes in gas volume, gas compression, and blood volume.13 The progressive increase in TLCVcw seen in both groups could therefore be the result of all of these factors, which may in turn explain, at least in part, the small discrepancies found between the changes in volumes recorded at the mouth by the spirometer and those calculated from the chest wall signals (figs 2 and 3).
In the EH group EEVcw was increased by 254 (130) ml above baseline 3 minutes after exercise. This is in agreement with that recently reported by O’Donnell et al24 who found that IC 3 minutes into recovery from symptom limited exercise was greater by 250 (35) ml than at baseline. The present study extends these findings by showing that, in the EH group, the greater degree of dynamic hyperinflation and air trapping during exercise should have enhanced the threshold loading mainly of the muscles of the rib cage compartment so that during recovery the function of these muscles would take longer to return to baseline. Furthermore, the delayed recovery of dynamic hyperinflation has important clinical implications when designing rehabilitative exercise training regimes for patients with severe COPD, especially if high intensity interval exercise is chosen.25,26
In conclusion, we found that patients with severe COPD fall into two groups: those who hyperinflate early in exercise and those who hyperinflate late. Despite this different pattern, exercise capacity is similar, probably reflecting the fact that both groups closely approached their TLC at Wpeak.
REFERENCES
Footnotes
-
Published Online First 17 June 2005
-
This work was supported by the European Community CARED FP5 project (contract n. QLG5-CT-2002-0893) and by the Thorax Foundation.
-
Competing interests: none declared.
Linked Articles
- Airwaves